Facilities managers are under more pressure than at any point in the last decade. Energy costs are rising. Regulatory requirements across OSHA, ISO 45001, and the UK Building Safety Act are tightening. Boards and CFOs want proof that facility spend is delivering asset life, not just keeping lights on. The average facility operates at 68% maintenance efficiency — meaning nearly one-third of maintenance labor and budget is consumed by reactive work that structured KPI tracking would have prevented. The gap between top-quartile and bottom-quartile facilities on total maintenance cost per square foot is consistently 2–3×. The difference is measurement. Start a free trial on Oxmaint to get your KPI dashboards live within 48 hours — no complex setup required.
Facilities Management · KPIs · Performance Benchmarks
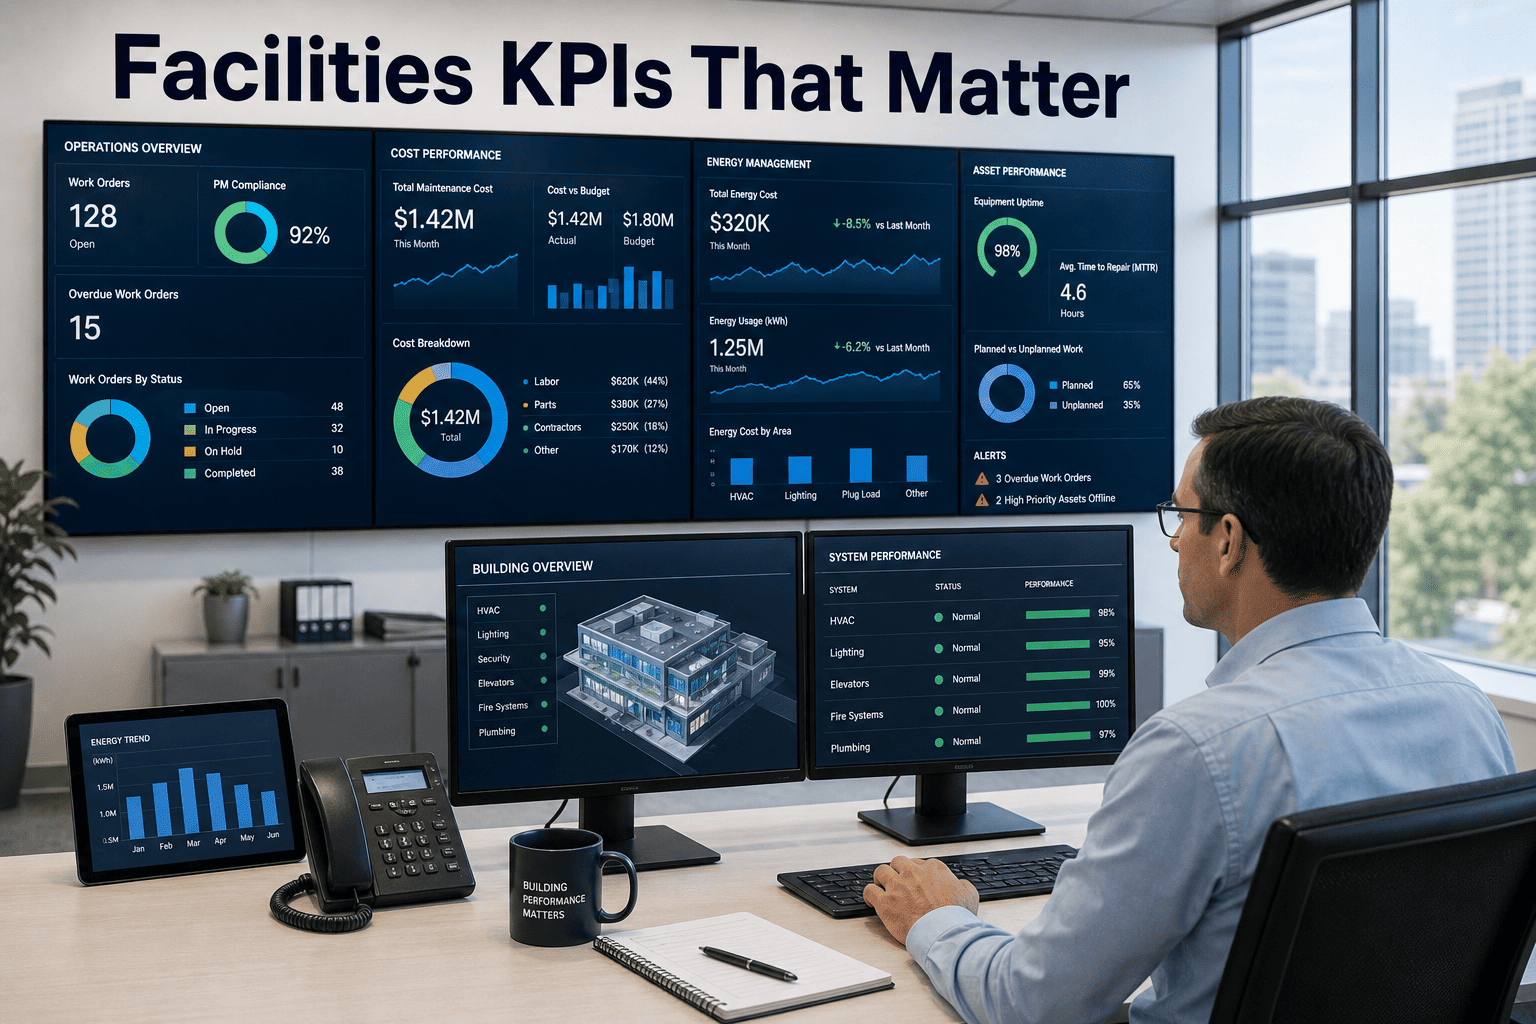
Know Your Numbers. Control Your Facility.
Oxmaint delivers real-time KPI dashboards for maintenance cost, PM compliance, asset uptime, and work order performance — pre-built and ready for your facility from day one.
68%
Average maintenance efficiency of facilities without structured KPI programs
IFMA Benchmarking Report
3×
Cost gap between top-quartile and bottom-quartile facilities per sq ft
BOMA International
80%
PM compliance rate required to sustain planned maintenance discipline
Reliability Leadership Institute
$2.15
Median total maintenance cost per sq ft for commercial office facilities
IFMA 2024
What Are Facilities KPIs?
Facilities Management KPIs: A Working Definition
Facilities management KPIs are quantitative metrics that measure how efficiently a facility or portfolio of properties is being operated, maintained, and managed. They span four domains: cost efficiency, asset performance, maintenance compliance, and occupant experience. Top-performing facilities teams select a tight cluster of 8–12 KPIs — enough to drive decisions but few enough to act on weekly without data overload.
The critical distinction is between lagging indicators — metrics that tell you what happened, like total reactive maintenance spend — and leading indicators that signal what is about to happen, like PM compliance rate and asset condition score. A mature facilities KPI program tracks both. Reactive metrics justify past decisions to finance; leading metrics inform next week's maintenance schedule. Most facilities teams measure only lagging KPIs and then wonder why performance doesn't improve. Book a demo to see how Oxmaint tracks both leading and lagging KPIs in a single dashboard.
Key KPI Framework
8 Essential Facilities Management KPIs and Benchmarks
Cost
Total Maintenance Cost per Sq Ft
Industry median: $2.15/sq ft (office), $3.80/sq ft (manufacturing). Top quartile runs 30–40% below median through PM compliance and reduced reactive spend.
Cost
Reactive vs. Planned Ratio
Best-in-class target: 80% planned, 20% reactive. Facilities above 50% reactive are in the danger zone — emergency work costs 4.8× more than planned work per repair event.
Performance
PM Compliance Rate
Percentage of scheduled PMs completed on time. Benchmark: 85%+ for sustained reliability. Below 70% is a leading indicator of rising reactive work within 90 days.
Performance
Mean Time to Repair (MTTR)
Average hours from work order creation to completion. Tracks technician response efficiency. Benchmark varies by asset class — HVAC MTTR under 4 hours is top-quartile for commercial facilities.
Asset
Asset Uptime / Availability
Percentage of scheduled operating hours an asset is available. Critical for production facilities, data centers, and healthcare. Target 99%+ for life-safety and critical systems.
Asset
Backlog Work Orders (Hours)
Total labor hours in open, unscheduled work orders. Healthy backlog: 2–4 weeks of crew capacity. Backlog over 6 weeks signals under-resourcing or PM scheduling failure.
Efficiency
Wrench Time
Percentage of technician hours spent on actual maintenance work. Industry average: 28–35%. Top-quartile facilities achieve 50–55% wrench time through better scheduling and mobile work order tools.
Efficiency
Energy Cost per Sq Ft
Tracks facility energy efficiency over time. Equipment maintenance directly impacts energy consumption — a degraded chiller or air handler can increase energy cost 15–25% before showing operational symptoms.
Industry Pain Points
Why Most Facilities Teams Can't Track Their Own KPIs
⚠
Data Scattered Across Systems
Work orders in one system, energy data in another, asset records in spreadsheets, vendor invoices in email. Calculating total maintenance cost per square foot requires manual data assembly that takes days per reporting cycle.
⚠
No Baseline for Benchmarking
Without historical CMMS records, facilities teams can't identify whether current performance is improving or declining. Finance requests trend data; operations can't produce it. Every board presentation is built on estimates.
⚠
PM Compliance Tracked Manually
PM completion rates tracked in spreadsheets create reporting delays and undercount missed PMs. A facility that appears 90% compliant on a static report may be running 60% compliance in real time without knowing.
⚠
KPIs Reported Monthly, Not Acted On Weekly
Monthly KPI reports are historical documents, not operational tools. By the time a decline in PM compliance appears in a monthly report, the reactive backlog has already grown for six weeks.
⚠
No Per-Asset Cost Visibility
Knowing total facility maintenance spend is not actionable. Knowing which specific assets consume 40% of the budget — and whether that spend is justified by their criticality — is what drives optimization decisions.
⚠
Vendor Performance Not Measured
External contractors complete 30–60% of facility maintenance work at most sites. Without CMMS-linked work order tracking per vendor, response time, quality, and cost comparisons are impossible to produce objectively.
Every one of these problems is a data structure problem, not a data shortage problem. CMMS solves them at the source. Start a free trial to see how Oxmaint surfaces live KPIs from your first work order.
How Oxmaint Solves It
Built-In KPI Tracking for Facilities and Portfolio Managers
Live PM Compliance Dashboard
Real-time PM compliance rate per site, system, and asset class. Managers see overdue PMs the moment they age past due — not at the end of a monthly reporting cycle.
Planned vs. Reactive Ratio Tracking
Oxmaint auto-classifies every work order as planned or reactive and tracks the ratio over time. Shows exactly when reactive drift begins so managers can intervene before backlog compounds.
Per-Asset Cost Accumulation
Labor, parts, and contractor costs link to every work order and roll up to individual assets. Identify the top 10% of assets driving 40% of costs in three clicks — and justify replacement vs. repair decisions with data.
MTTR and Work Order Aging
Track mean time to repair and work order aging across technicians, asset types, and sites. Identify bottlenecks in labor scheduling, parts availability, or approval workflows that inflate repair duration.
Multi-Site Portfolio Reporting
Roll KPIs from individual sites into portfolio-level summaries for VPs and directors. Compare site performance on standardized metrics. Identify outlier sites that need resource reallocation or management attention.
Vendor Performance Scorecards
Track external contractor response time, first-fix rate, and cost per work order. Use objective vendor scorecards in contract renewals. Eliminate underperforming vendors before they create compliance or safety exposure.
Facilities managers using Oxmaint report their first KPI dashboard live within two days of data entry — no custom configuration or IT involvement required. Book a demo to walk through the facilities KPI dashboard with your asset structure.
Before vs. After
Facilities KPI Management: Without vs. With Structured CMMS
| KPI / Capability |
Without Structured CMMS |
With Oxmaint CMMS |
| PM Compliance Rate |
Estimated from paper schedules; typically overstated by 15–20% |
Live percentage updated in real time as PMs are completed or missed |
| Maintenance Cost per Sq Ft |
Calculated quarterly from manual invoice compilation; delayed by 4–6 weeks |
Auto-calculated monthly from linked work order labor and parts costs |
| Reactive vs. Planned Ratio |
Unknown or estimated; most facilities underestimate reactive share |
Auto-classified and charted over time — shows drift trend before it becomes a crisis |
| Asset-Level Cost Visibility |
Not available; total facility spend only |
Full cost history per asset: labor, parts, contractor — sortable by cost or criticality |
| Vendor Performance |
Subjective, relationship-based contract renewal decisions |
Objective scorecards: response time, first-fix rate, cost per WO per vendor |
| Board Reporting |
2–3 days to compile manually from multiple sources each cycle |
One-click report export with site, asset class, and date range filters |
ROI and Results
What KPI-Driven Facilities Management Delivers
23%
Average reduction in total maintenance cost
Facilities that track and act on planned-vs-reactive ratio within 12 months
35%
Improvement in PM compliance rate
Within 6 months of deploying live compliance dashboards — IFMA member data
40%
Reduction in reporting preparation time
Facilities managers using CMMS-generated reports vs. manual spreadsheet compilation
18%
Energy cost reduction linked to equipment PM compliance
Buildings where HVAC and mechanical PM compliance exceeds 85% — ASHRAE study
FAQ
Facilities Management KPIs — Frequently Asked Questions
What is a good PM compliance rate benchmark for commercial facilities?
The industry standard target is 85% or above for sustained reliability. Facilities running below 70% PM compliance are typically experiencing a reactive maintenance spiral — each missed PM creates a higher probability of unplanned failure, which in turn displaces the next scheduled PM. The Reliability Leadership Institute benchmark for top-quartile facilities is 90–95%. Oxmaint tracks compliance in real time and alerts managers when individual assets or systems fall behind schedule, enabling intervention before the spiral begins.
Start a free trial to see your live PM compliance rate within 48 hours of setup.
How do I calculate maintenance cost per square foot for my facility?
Total annual maintenance cost per square foot equals total maintenance spend (labor + parts + contractors + outsourced services) divided by total gross square footage maintained. IFMA benchmarks for 2024 place the median at $2.15/sq ft for commercial office, $3.80/sq ft for manufacturing, and $5.20/sq ft for healthcare facilities. The challenge is capturing total maintenance spend accurately — facilities without CMMS often undercount by 20–30% because contractor invoices and spot purchases aren't systematically linked to facility records. Oxmaint accumulates all cost categories per asset and site, making this calculation accurate and near-instant.
Which facilities KPIs should I report to the CFO vs. track internally?
For CFO and board reporting: maintenance cost per square foot, total maintenance spend vs. budget, reactive-to-planned ratio trend, and capital expenditure forecast vs. actuals. For internal operational tracking: PM compliance rate, work order backlog, mean time to repair by asset class, wrench time, and vendor performance scores. The distinction matters because CFO-facing metrics need to connect directly to financial outcomes, while operational metrics drive daily scheduling decisions. Oxmaint pre-builds both report types with separate views for executive and operational audiences.
How long does it take to establish reliable KPI baselines with CMMS?
Meaningful baselines emerge within 60–90 days of consistent work order logging. Cost-per-asset baselines require 90–120 days of linked cost capture. PM compliance trending is visible from the first month. Most facilities teams find that 90 days of CMMS data reveals patterns — in reactive spend, backlog growth, or PM compliance drift — that were completely invisible in prior manual records. Historical paper records can be imported to accelerate baseline establishment.
Book a demo to see how quickly your facility's KPI baseline takes shape in Oxmaint.
Facilities Management · KPIs · Benchmarks · CMMS Reporting
Stop Guessing How Your Facility Performs. Start Measuring It.
Oxmaint gives facilities and operations managers live PM compliance rates, planned-vs-reactive ratios, per-asset cost tracking, and board-ready reports — all from the same platform that runs your work orders and PM schedules.