FMEA in RCM (Reliability Centered Maintenance) is the structured process of identifying every functional failure mode on an asset, rating its severity and detectability, and assigning the most effective maintenance task to prevent or catch it — before it stops production. Done right, a failure mode effects analysis turns your PM program from guesswork into a defensible, risk-ranked plan: studies of mature RCM programs show 30–50% reductions in unplanned downtime and up to 25% lower maintenance costs within the first 18 months. This reference walks you through the full FMEA worksheet — failure modes, root causes, local vs. system effects, severity and detection ratings, Risk Priority Numbers, and task selection — with a worked pump example you can copy today. If you want to skip the spreadsheet chaos and run FMEA directly against your asset register, Start Free Trial with OxMaint and log your first failure modes in minutes.
What if every breakdown on your floor had been predicted — and prevented — by a worksheet?
Every equipment failure has a mode, a root cause, and a downstream effect. FMEA inside RCM gives you a repeatable way to catalog all three, rank the risk, and assign the right task — condition-based, time-based, or run-to-failure — so your team stops firefighting and starts planning.
How to run a failure mode effects analysis in RCM, step by step
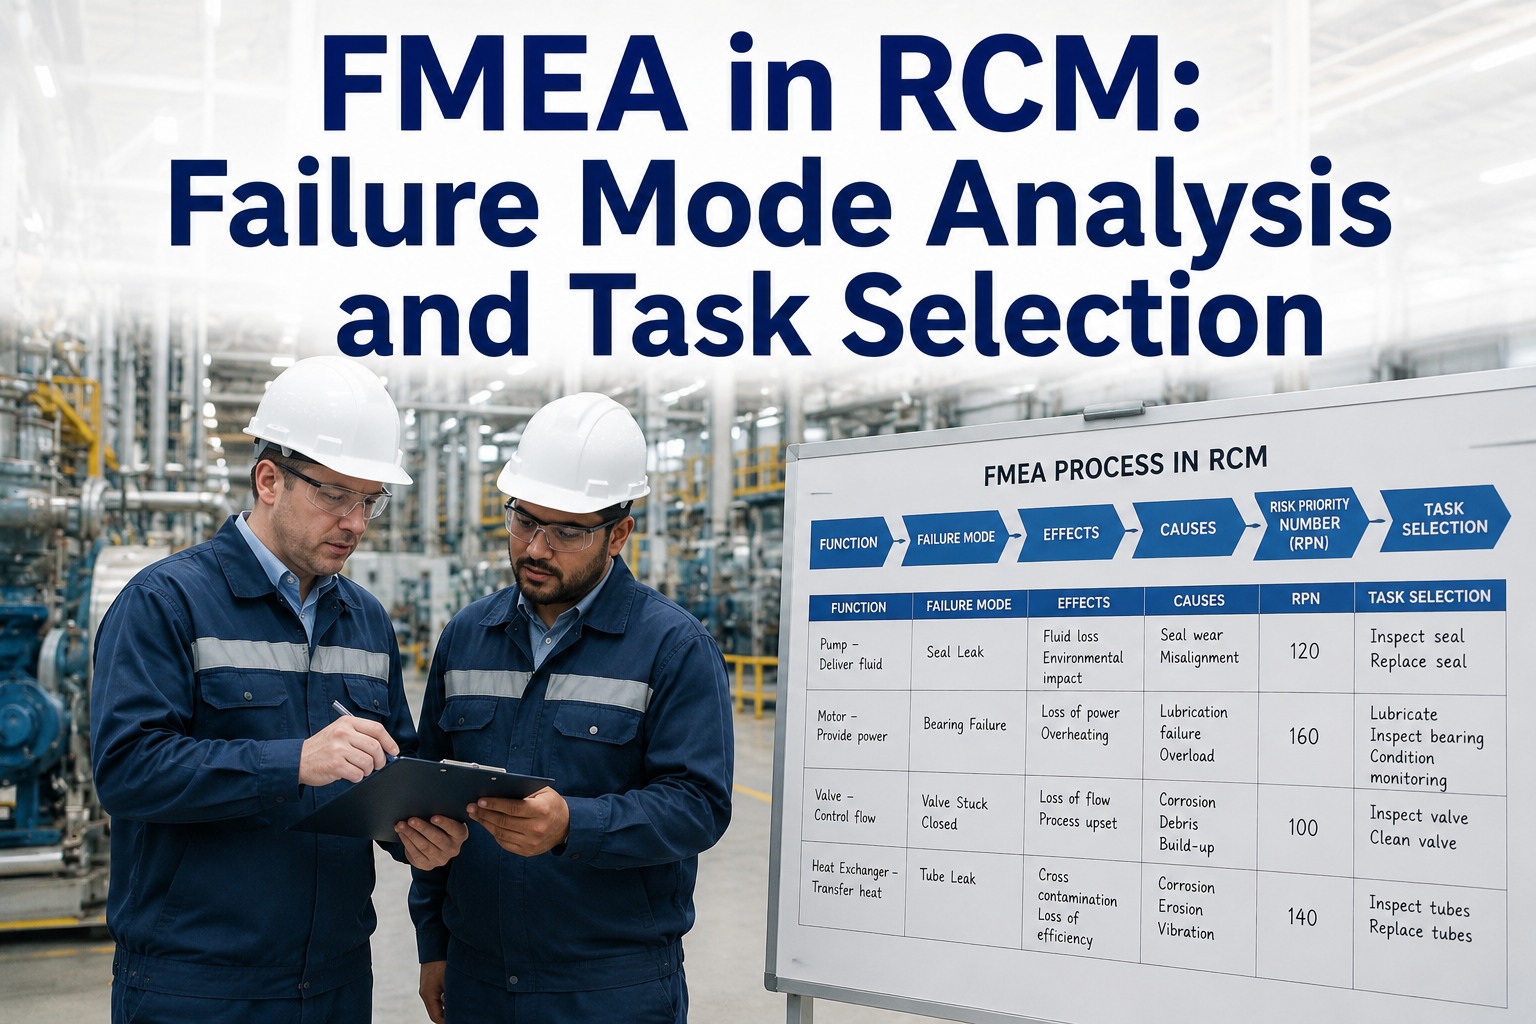
A disciplined RCM FMEA worksheet answers seven questions per asset, in order. Skip one and your task selection falls apart. Here is the exact sequence reliability teams use in a 2–4 hour workshop per asset class.
What must the asset do, and to what standard? A cooling water pump must deliver 450 GPM at 60 PSI, 24/7. No function, no meaningful failure mode.
Every way the asset fails to meet that standard: total failure (no flow), partial failure (flow below 380 GPM), over-performance, or unintended function (runs when it should not).
For each functional failure, list the physical causes: bearing wear, seal leakage, impeller cavitation, coupling misalignment, motor winding degradation, control loop drift.
A local effect stops at the component (seal drips). A system effect cascades (cooling loop trips, reactor overheats, line down 6 hours at $18K/hr). This distinction drives severity scoring.
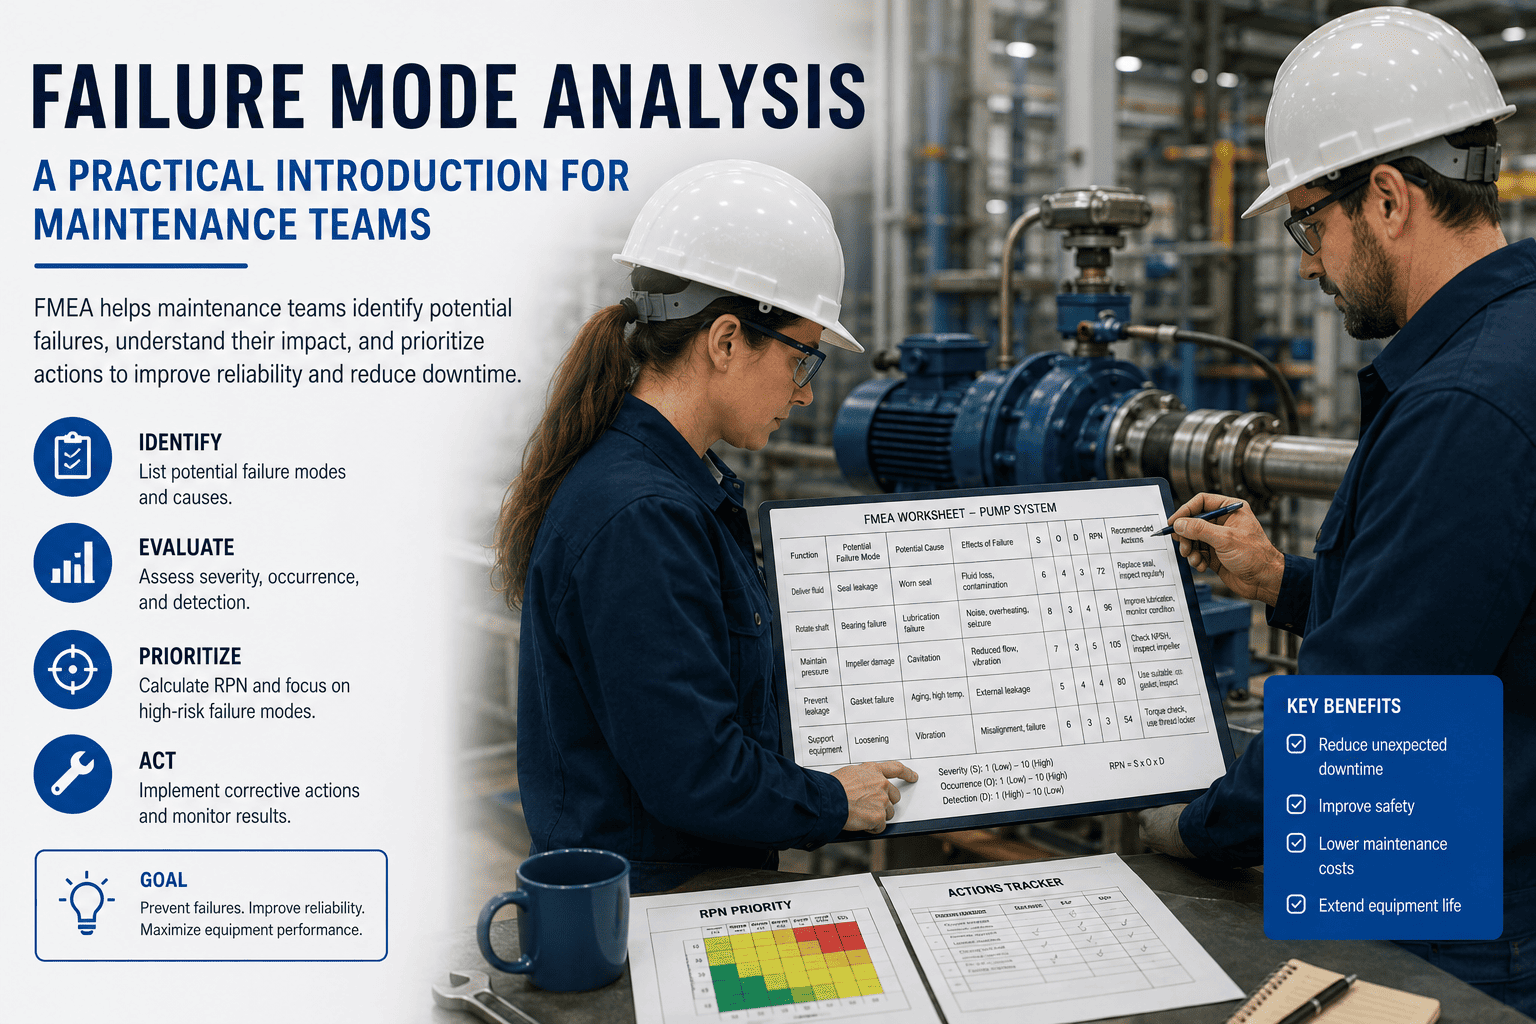
Rate each mode 1–10 on severity (S), likelihood (O), and how hard it is to detect before failure (D). Multiply for the Risk Priority Number: RPN = S × O × D.
High RPN with a measurable P-F interval → condition-based task. Age-related wear → time-based replacement. Hidden failure → failure-finding task. Low consequence → run-to-failure.
FMEA is living. Every actual failure validates or corrects your occurrence and detection ratings. Teams that re-score quarterly cut repeat failures by 40%+.
FMEA severity, occurrence and detection ratings — and the Risk Priority Number
The RPN formula is the engine of FMEA for maintenance planning. A mode scoring S9 × O6 × D8 = 432 demands action this quarter; one scoring S3 × O2 × D2 = 12 can safely run to failure. Use these anchor scales so every technician scores consistently.
| Score | Severity (S) — effect of failure | Occurrence (O) — likelihood | Detection (D) — ability to catch it early |
|---|---|---|---|
| 9–10 | Safety/environmental hazard, regulatory breach, or full plant shutdown | Expected monthly or more often | No known detection method; failure appears without warning |
| 7–8 | Major production loss (>8 hrs) or secondary equipment damage | A few times per year | Detectable only by manual inspection, easy to miss |
| 4–6 | Partial capacity loss, quality defects, single-line stoppage | Once every 1–3 years | Condition monitoring catches it with a usable P-F interval |
| 1–3 | Minor inconvenience, no production or safety impact | Rare — less than once in 5 years | Obvious to operators during normal rounds |
Rule of thumb: severity never gets negotiated down by a good detection score. A severity-10 safety mode with perfect detection is still a severity-10 problem — it gets a redesign conversation, not just a sensor.
RCM FMEA pump example: from failure mode to assigned task
A 180-asset food plant was spending $42K/yr on emergency pump callouts. One FMEA workshop on their critical cooling-water pump produced this worksheet — and cut pump-related downtime 61% in nine months by shifting three modes to condition-based tasks.
| Failure mode | Root cause | Local effect | System effect | S | O | D | RPN | Assigned RCM task |
|---|---|---|---|---|---|---|---|---|
| Bearing wear | Lubricant degradation, misalignment | Vibration, heat at housing | Pump seizes; cooling loop trips; line down 6 hrs | 8 | 6 | 3 | 144 | Condition-based: monthly vibration analysis + ultrasound lubrication |
| Mechanical seal leakage | Face wear, dry running | Drip at seal, product loss | Slip hazard; eventual pump trip | 7 | 5 | 4 | 140 | Condition-based: weekly visual + leak-rate trend in CMMS |
| Impeller cavitation | Low suction head, clogged strainer | Noise, pitting, flow drop | Flow below 380 GPM; process overheats | 8 | 4 | 5 | 160 | Condition-based: pressure differential monitoring + monthly strainer PM |
| Motor winding failure | Overheating, insulation aging | Motor trips on overload | Full pump loss until rewind (3 days) | 8 | 3 | 6 | 144 | Time-based: annual insulation resistance test + thermography |
| Control loop drift (PLC) | Sensor calibration drift | Wrong speed/pressure setpoint | Quality defects, energy waste | 5 | 4 | 7 | 140 | Time-based: quarterly calibration check |
| Coupling guard corrosion | Washdown chemicals | Surface rust | None until guard fails inspection | 3 | 3 | 2 | 18 | Run-to-failure with annual visual inspection |
Notice the pattern: the four highest-RPN modes all had usable P-F intervals, so condition-based tasks beat calendar PM. The corrosion mode scored 18 — spending PM hours there would have been pure waste. That is the economic logic of FMEA task selection.
FMEA maintenance task assignment: match every mode to the right strategy
RCM gives you four task types. The FMEA output — severity, occurrence, detection, and whether a P-F interval exists — tells you which one applies. Misassigning tasks is how plants end up over-maintaining cheap assets and under-maintaining critical ones.
Use when a measurable warning exists (vibration, temperature, oil debris, leak rate). Covers ~70% of failure modes on rotating equipment. Typical win: 30–50% less unplanned downtime.
Use only for genuinely age-related modes with a known wear-out point — belts, filters, batteries. Applied blindly, calendar PM introduces infant-mortality failures on 1 in 6 overhauled components.
For hidden, protective functions: standby pumps, relief valves, backup power, alarms. Test on an interval that keeps unavailability below your risk threshold — often quarterly proof tests.
The correct answer for low-severity, low-cost modes (RPN under ~40). Deliberate run-to-failure with a stocked spare beats a $400 PM on a $60 component every time.
Turn your RCM FMEA worksheet into daily action with OxMaint
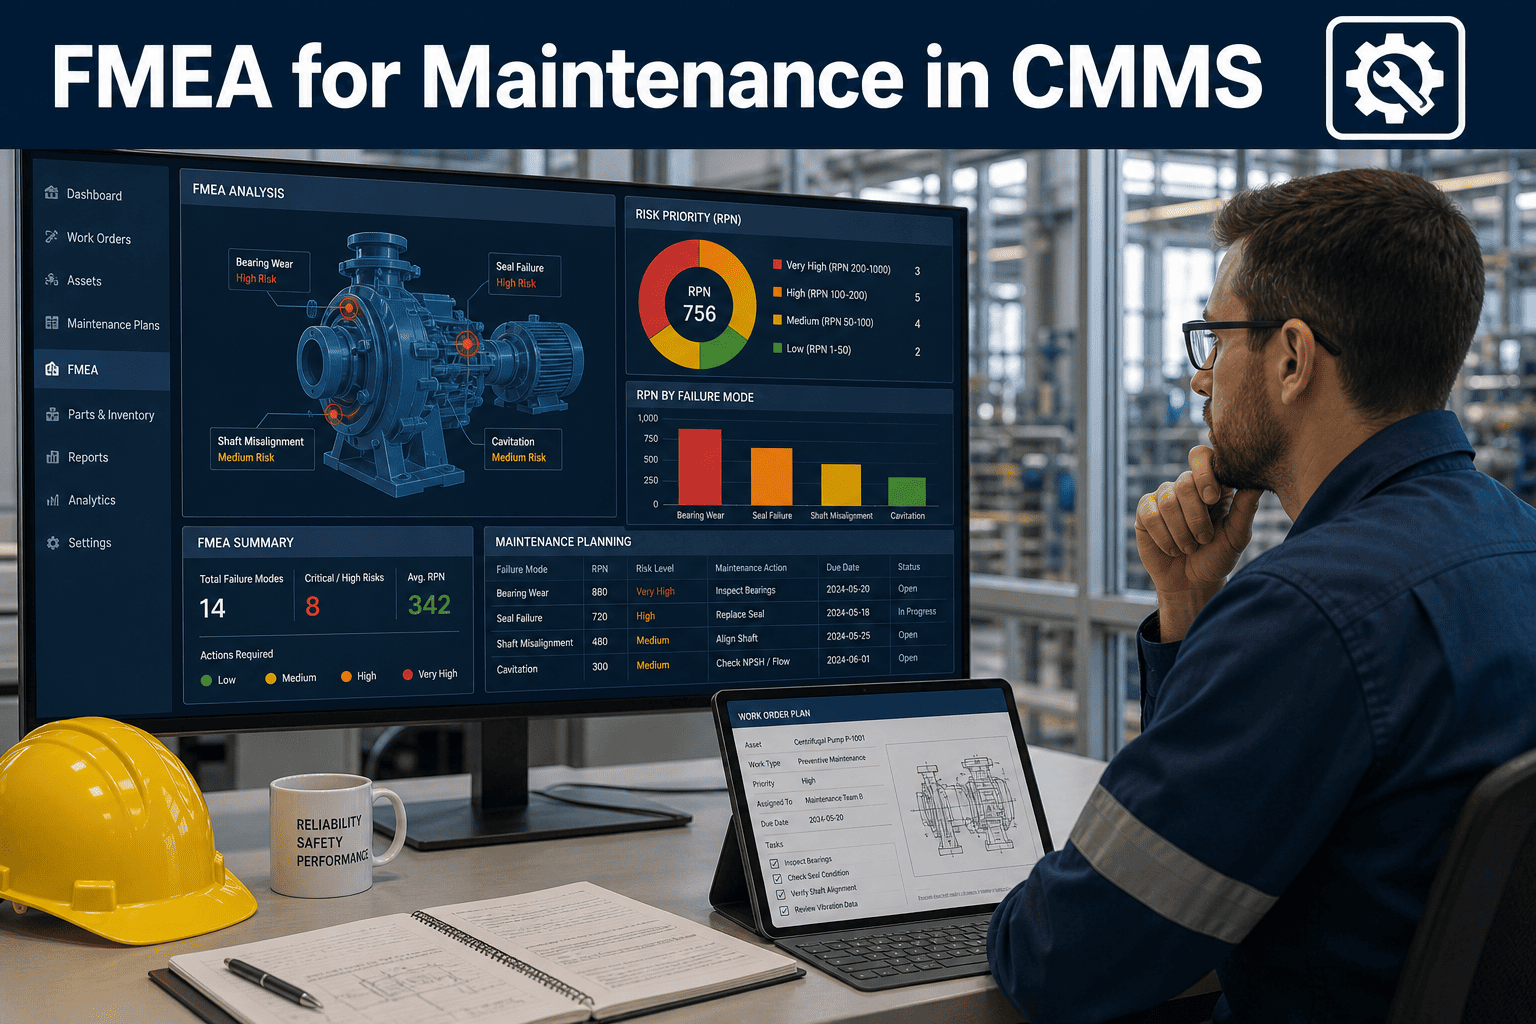
Most FMEAs die in a binder. OxMaint keeps yours alive — every failure mode, rating and task lives on the asset record, drives real work orders, and gets smarter with every completed job.
Log modes, root causes, S/O/D ratings and effects directly against each asset. Technicians see the FMEA context on every work order — no more guessing why a task exists.
Map each mode to a condition-based or time-based task with the right interval. OxMaint generates and assigns the work order automatically — vibration route due, calibration due, proof test due.
Every breakdown logged with its mode sharpens your occurrence ratings. Analytics show which RPNs were wrong, so next quarter's review is evidence-based, not opinion-based.
High-severity modes flag the spares you must stock; run-to-failure modes flag the ones you shouldn't. Plants typically cut inventory carrying cost 15–20% while improving fill rate.
See your own assets through an FMEA lens — book a 30-minute demo
Bring one problem asset. We will show you how OxMaint logs its failure modes, scores the risk, and schedules the right tasks — live, on your data.
FMEA in RCM: frequently asked questions
FMEA is the analysis technique — identifying failure modes, causes and effects. RCM is the broader decision framework that uses FMEA output to select maintenance tasks. In practice, the FMEA worksheet is step one of every RCM analysis; RCM adds the task-selection logic (condition-based, time-based, failure-finding, run-to-failure) on top.
RPN = Severity × Occurrence × Detection, each scored 1–10, giving a range of 1–1000. Modes above roughly 200 get priority action, and any severity of 9–10 (safety or environmental) gets acted on regardless of the total. Re-score after every real failure to keep numbers honest.
A local effect is what happens at the component itself — a seal drips, a bearing heats up. A system effect is what cascades downstream — the cooling loop trips and the production line stops for six hours. Severity scoring must be based on the system effect, which is why the same seal leak scores a 3 on a utility pump and an 8 on a critical cooling pump.
Start with your criticality top 10–20%: assets whose failure stops production, creates safety risk, or costs the most in emergency repairs. A focused FMEA on 15 critical assets typically uncovers 60–90% of a plant's downtime risk. OxMaint's asset criticality ranking makes that shortlist automatic — Start Free Trial and run your first workshop this week.
Review quarterly for critical assets and after every significant failure, modification, or operating-context change. FMEAs that sit untouched for 2+ years drift badly — occurrence ratings go stale and new failure modes (from aging, new operators, new duty cycles) never get captured. A CMMS that logs failure modes on every work order keeps the review cycle evidence-based.
Stop firefighting. Start predicting — with FMEA built into your CMMS.
OxMaint turns your failure mode analysis into scheduled tasks, stocked spares and a searchable reliability history. Set up your first asset class in under an hour.