Failure Mode and Effects Analysis — FMEA — is the most practical risk reduction tool available to maintenance teams, and most teams either never use it or use it once during a capital project and file it away forever. Done right, FMEA for maintenance teams is a living document that directly drives PM schedule design, spare parts stocking decisions, and technician training priorities — and organizations that run active FMEA programs see 30–50% fewer repeat failures on the assets they analyze.
Connect your FMEA risk priorities directly to Oxmaint's AI predictive engine and auto-generate work orders before failure modes activate.
- Asset criticality scoring built on FMEA risk ranking
- Predictive monitoring targeted at your highest-RPN failure modes
- PM schedules auto-configured to address each failure mode's interval
Trusted by 1,000+ reliability-focused maintenance teams · Live in days, not months
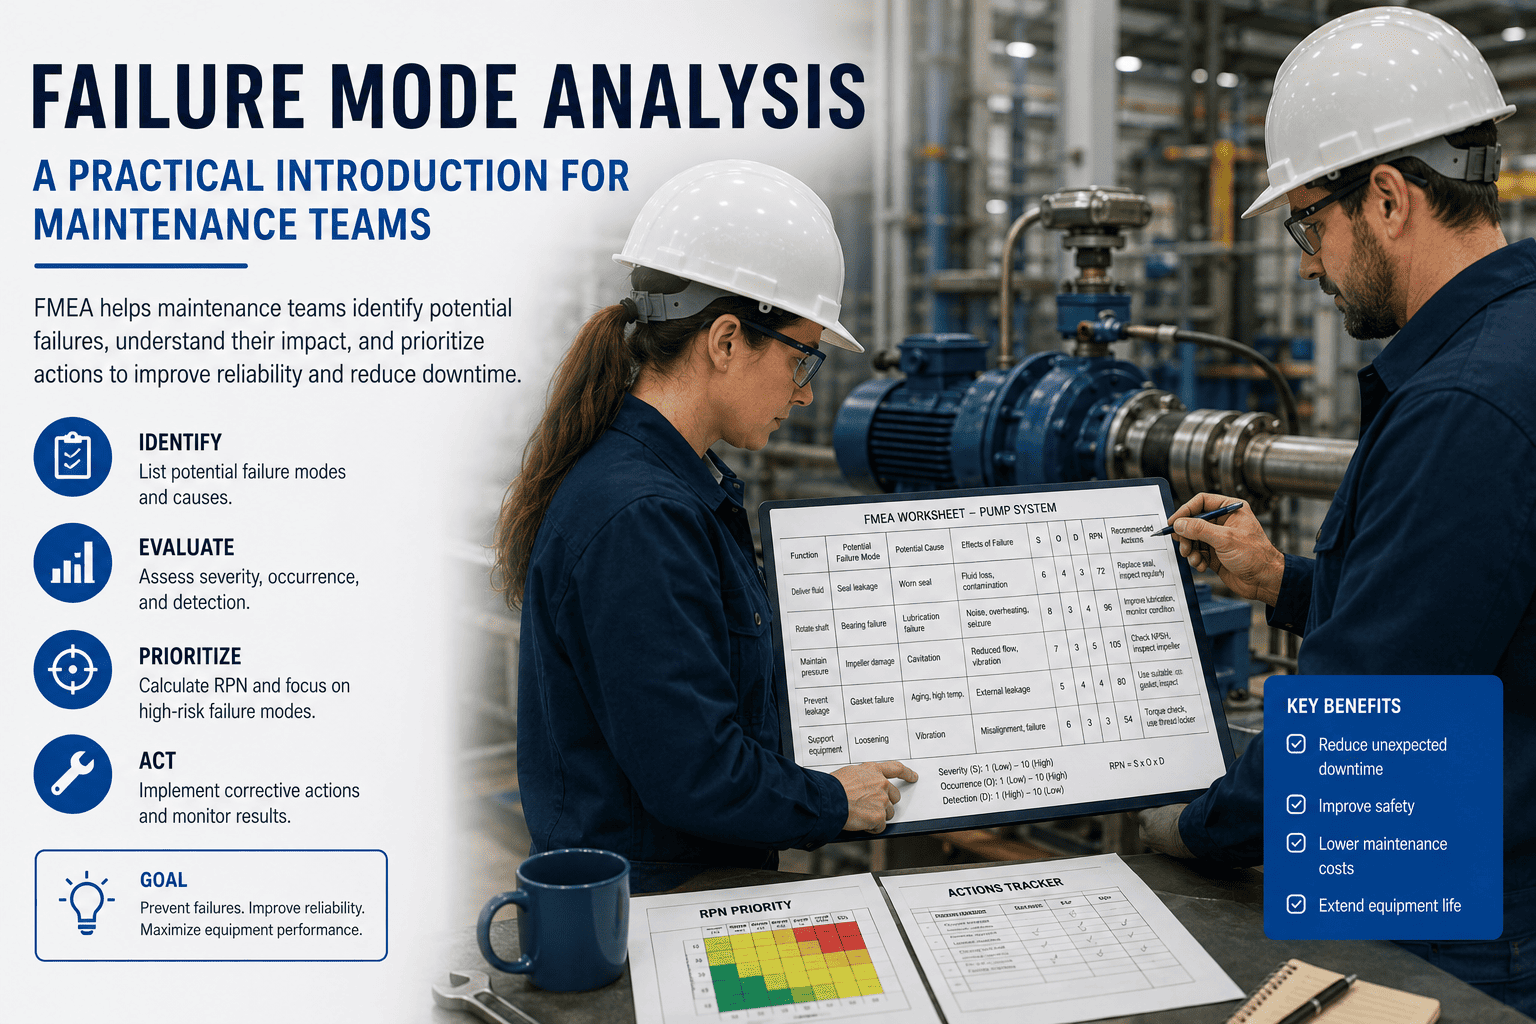
Failure mode analysis for maintenance teams: a practical FMEA introduction with examples
Failure Mode and Effects Analysis (FMEA) is a structured method for identifying every way a piece of equipment can fail, assessing the consequences of each failure mode, and ranking them by risk so maintenance resources are directed at the failures that matter most. For maintenance teams, FMEA translates directly into three operational outputs: which assets need predictive monitoring, what PM tasks are required and at what frequency, and what spare parts must be stocked to avoid extended downtime when high-risk failure modes occur.
A basic maintenance FMEA has five columns: the asset or component, the failure mode (how it fails), the failure effect (what happens when it does), the current controls (what's already in place to prevent or detect it), and a risk score. The risk score — called the Risk Priority Number or RPN — is calculated by multiplying three 1–10 ratings: Severity (how bad is the effect), Occurrence (how often does this failure mode happen), and Detection (how early can it be caught). High-RPN failure modes get resources first. Asset management platforms that integrate FMEA data link risk scores directly to PM schedules and sensor alert thresholds.
The practical value of FMEA is not the worksheet — it is what the worksheet drives. A well-run predictive maintenance program uses FMEA to decide where to put sensors, what sensor signatures to monitor, and what work order to auto-generate when a specific failure mode's early warning signal appears. FMEA without a connected action system is an analysis exercise. FMEA connected to a live CMMS is a failure prevention engine.
The 8-step FMEA process for maintenance teams — with examples
Decide whether the FMEA covers a single asset (a specific pump), a system (the cooling water circuit), or a component (the drive-end bearing on motor M-07). Starting with a critical asset FMEA produces faster, more actionable results than top-down system FMEA. Example: centrifugal pump P-31 on the primary cooling circuit.
Before listing failure modes, document what the asset is supposed to do under normal operating conditions — including secondary functions like maintaining flow rate, containing fluid, and operating within noise/vibration limits. Failure modes are defined relative to these functions. Example for P-31: transfer cooling water at 120 m³/hr at 4.2 bar discharge pressure.
A failure mode is the specific way a function fails — not the cause, not the effect, just how the failure manifests. Example for P-31: (a) fails to deliver rated flow, (b) leaks at mechanical seal, (c) excessive vibration, (d) bearing failure, (e) impeller wear/erosion. List every physically possible failure mode, not just the common ones.
The effect is what happens to the process or plant when this failure mode occurs. Effects can be local (bearing seizure stops the pump), system-level (cooling circuit loses flow, reactor temperature rises), or safety-level (seal failure releases process fluid, fire risk). Effects determine the Severity rating. Example: P-31 bearing failure → pump trips → primary cooling circuit offline → production stop within 20 minutes.
Severity: how bad is the worst credible effect (1=negligible, 10=safety event or catastrophic production loss). Occurrence: how frequently does this failure mode happen with current controls in place (1=almost never, 10=routinely). Detection: how detectable is this failure mode before it causes the effect (1=always caught early, 10=undetectable until failure). Example: P-31 bearing failure — Severity 8, Occurrence 4, Detection 5. RPN = 160.
RPN = Severity × Occurrence × Detection. Maximum possible RPN is 1,000. For maintenance prioritization, failure modes with RPN above 100–125 typically warrant proactive action — either enhanced monitoring, revised PM frequency, or design change. Rank all failure modes and identify the top quartile for immediate action. Example: all five P-31 failure modes ranked — bearing failure (RPN 160) and seal failure (RPN 140) are the top two priorities.
For each failure mode above your RPN threshold, specify the action that most effectively reduces risk — targeted at the highest of the three rating components. High Detection score: add a sensor or inspection task to catch it earlier. High Occurrence: revise PM interval or add a lubrication task. High Severity: add redundancy or revise operating procedures. Map each action to a specific work order type in your preventive maintenance schedule.
FMEA is a living document. Each time a failure mode occurs in practice, the Occurrence rating for that mode should be revised upward, and the action plan reviewed for adequacy. Organizations that treat FMEA as a one-time project miss 60–70% of the long-term value. Connect FMEA updates to your CMMS analytics so that failure events automatically prompt an FMEA review flag.
4 ways teams fail to get value from FMEA
FMEA done during a capital project or a safety audit typically reflects the asset's initial state — not its condition after five years of operation. Occurrence ratings that were a 2 at installation may be a 7 after accumulated wear. Static FMEA documents become dangerously misleading over time. The fix is connecting FMEA review cycles to failure event close-out in your CMMS work order system.
A complete FMEA with no direct link to PM task frequencies, sensor placement decisions, or spare parts stocking levels is an analysis exercise, not a maintenance program. The moment the FMEA output should drive is the PM schedule configuration in the CMMS — every high-RPN failure mode should have a corresponding PM task or predictive monitoring trigger. See how Oxmaint structures FMEA-driven PM.
FMEA conducted without actual maintenance history — failure frequency data, MTBF records, repair cost history — produces Occurrence ratings based on engineering opinion rather than operational evidence. These ratings are often significantly wrong in both directions. Connecting FMEA to real CMMS failure data converts opinion-based risk scoring into evidence-based risk scoring, with measurably better maintenance outcomes.
Teams that attempt plant-wide FMEA simultaneously exhaust their reliability engineering resources and produce shallow analysis on every asset rather than deep, actionable analysis on the critical few. The correct starting point is always the highest-consequence assets — your top 15–20% by criticality score. Asset criticality ranking in Oxmaint identifies the right starting scope in minutes.
4 ways Oxmaint turns FMEA analysis into live maintenance action
Oxmaint's asset criticality model uses production impact, safety consequence, replacement lead time, and maintenance cost history to score every asset — directly replicating the Severity and Occurrence dimensions of FMEA at scale. The output is a ranked asset list that tells you exactly where to run your first detailed FMEA workshop. Asset management details.
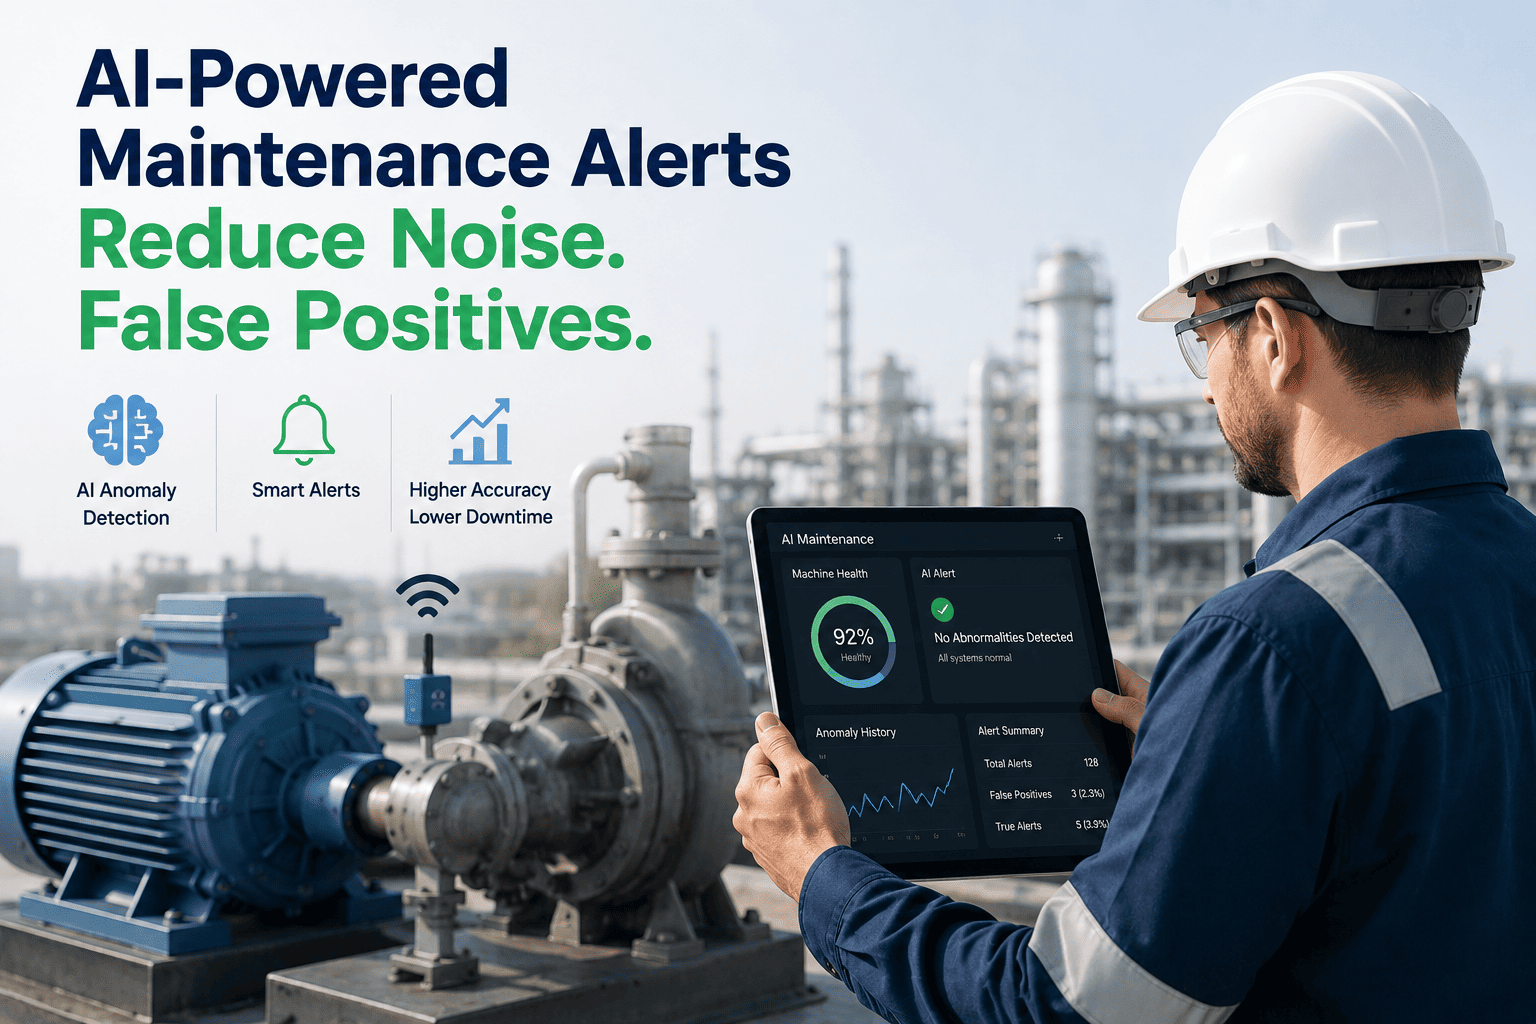
Once FMEA identifies the top failure modes for a critical asset — bearing wear, seal degradation, cavitation — Oxmaint connects IoT sensor monitoring specifically to those modes. Vibration analysis targets bearing defect frequencies. Thermal monitoring targets seal failure precursors. The AI flags the failure mode's early signature, not just a generic anomaly. Predictive maintenance module.
High-RPN failure modes with high Occurrence ratings become PM tasks in Oxmaint with the interval set to intercept the failure mode before it activates. High-Detection failure modes (ones that are hard to catch before they fail) get condition monitoring tasks rather than fixed-interval PMs. The FMEA outputs directly populate the PM library. Preventive maintenance scheduling.
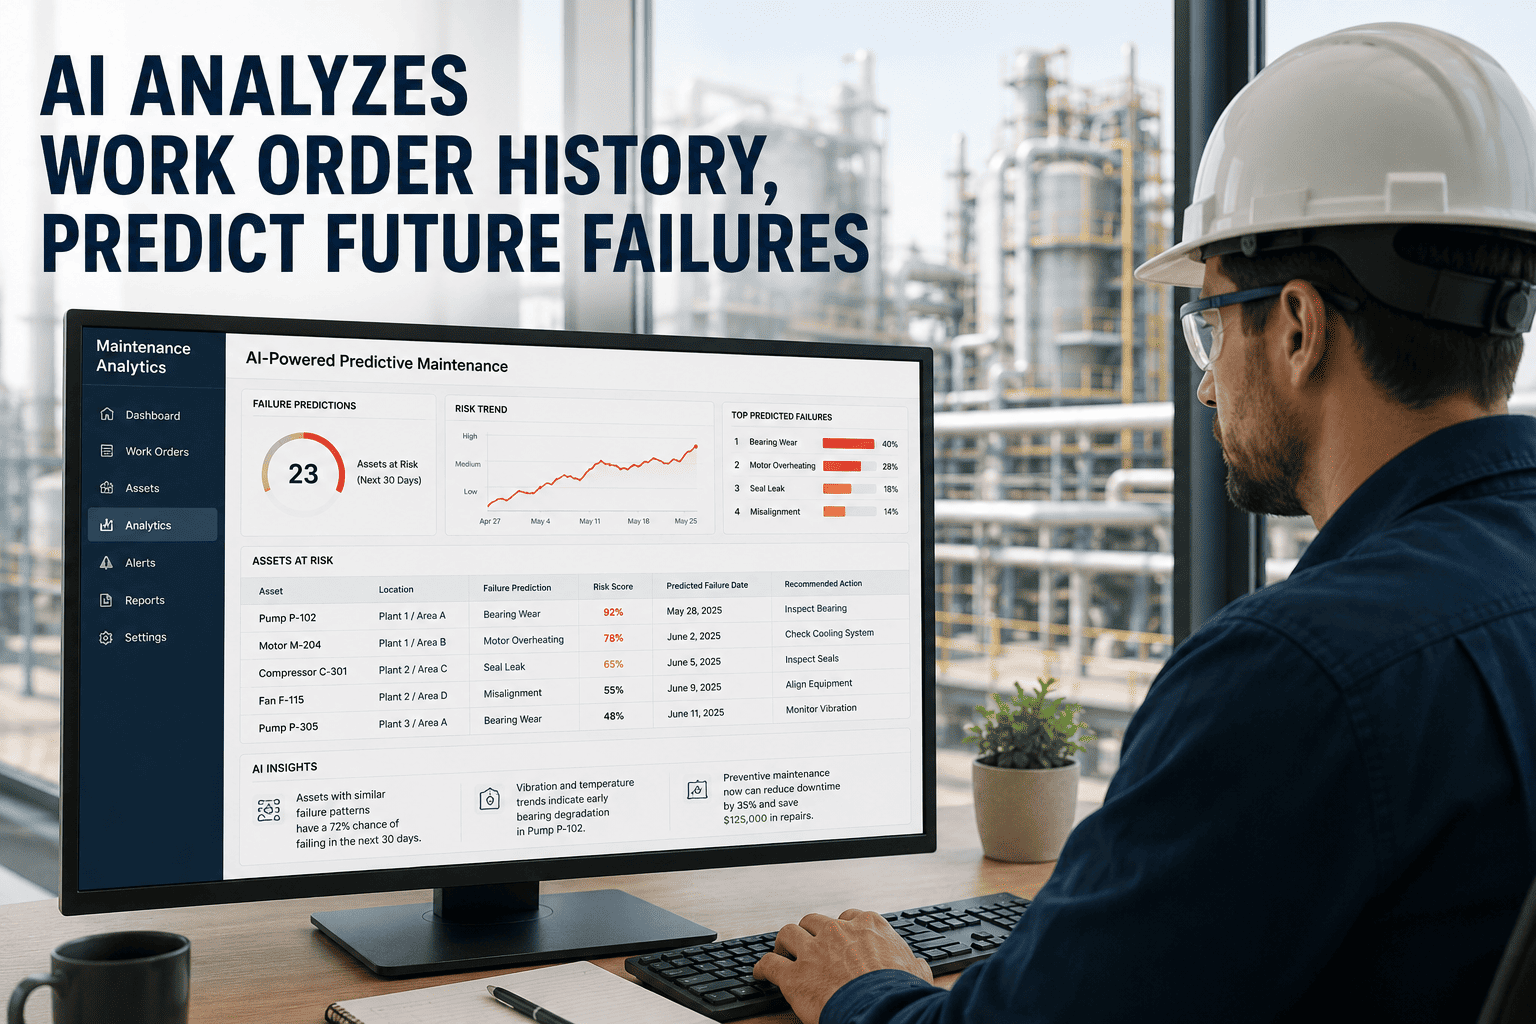
Every corrective work order closed in Oxmaint requires a failure code. Over 12–24 months, failure code frequency data by asset directly validates or corrects the Occurrence ratings in your FMEA. Assets that are failing at higher rates than the FMEA predicted are flagged for RPN re-review. Your FMEA becomes a living document maintained by operational data, not periodic workshops. Analytics and reporting.
Sample FMEA for a centrifugal pump — maintenance team format
| Failure Mode | Effect | SEV | OCC | DET | RPN | Recommended Action |
|---|---|---|---|---|---|---|
| Drive-end bearing failure | Pump trip, cooling circuit offline | 8 | 4 | 5 | 160 | Add vibration sensor — bearing defect freq. monitoring |
| Mechanical seal leakage | Process fluid release, fire risk | 9 | 3 | 5 | 135 | Quarterly seal inspection + thermal camera monitoring |
| Impeller wear / erosion | Reduced flow — process impact | 6 | 4 | 5 | 120 | Annual flow performance test; replace at 15% degradation |
| Cavitation damage | Impeller erosion, noise, vibration | 6 | 3 | 4 | 72 | Monitor suction pressure — alarm below NPSHr + 0.5m |
| Coupling misalignment | Accelerated bearing and seal wear | 5 | 3 | 4 | 60 | Laser alignment check at every bearing replacement |
SEV = Severity · OCC = Occurrence · DET = Detection · RPN = Risk Priority Number (SEV × OCC × DET). RPN above 125 = immediate action. 75–124 = scheduled action. Below 75 = monitor.
What active FMEA programs deliver in practice
Teams that connect FMEA analysis to live CMMS scheduling and predictive monitoring see compounding returns — each failure event refines the FMEA, which improves PM design, which reduces the next failure. Calculate your reliability program ROI, or book a demo to see how Oxmaint structures FMEA-driven maintenance for your asset types.
Common questions about FMEA for maintenance teams
What is FMEA and how is it used in maintenance management?
How do you calculate RPN in a maintenance FMEA?
What is the difference between FMEA and root cause analysis in maintenance?
How long does it take to complete an FMEA for a critical industrial asset?
FMEA Is the Map. Oxmaint Is the Engine That Acts on It.
FMEA tells you which failure modes are highest risk and what to do about them. Oxmaint connects that analysis to live sensor monitoring targeted at your highest-RPN failure modes, PM schedules configured to intercept each one, and auto-generated work orders when early warning signatures appear. The gap between identifying risk and preventing failure closes when analysis connects directly to operational action.
- Asset criticality scoring — FMEA Severity and Occurrence mapped to every asset
- Predictive monitoring targeted at specific failure mode signatures
- Failure code data that continuously refines your FMEA Occurrence ratings
Trusted by 1,000+ reliability-focused maintenance teams · Live in days, not months