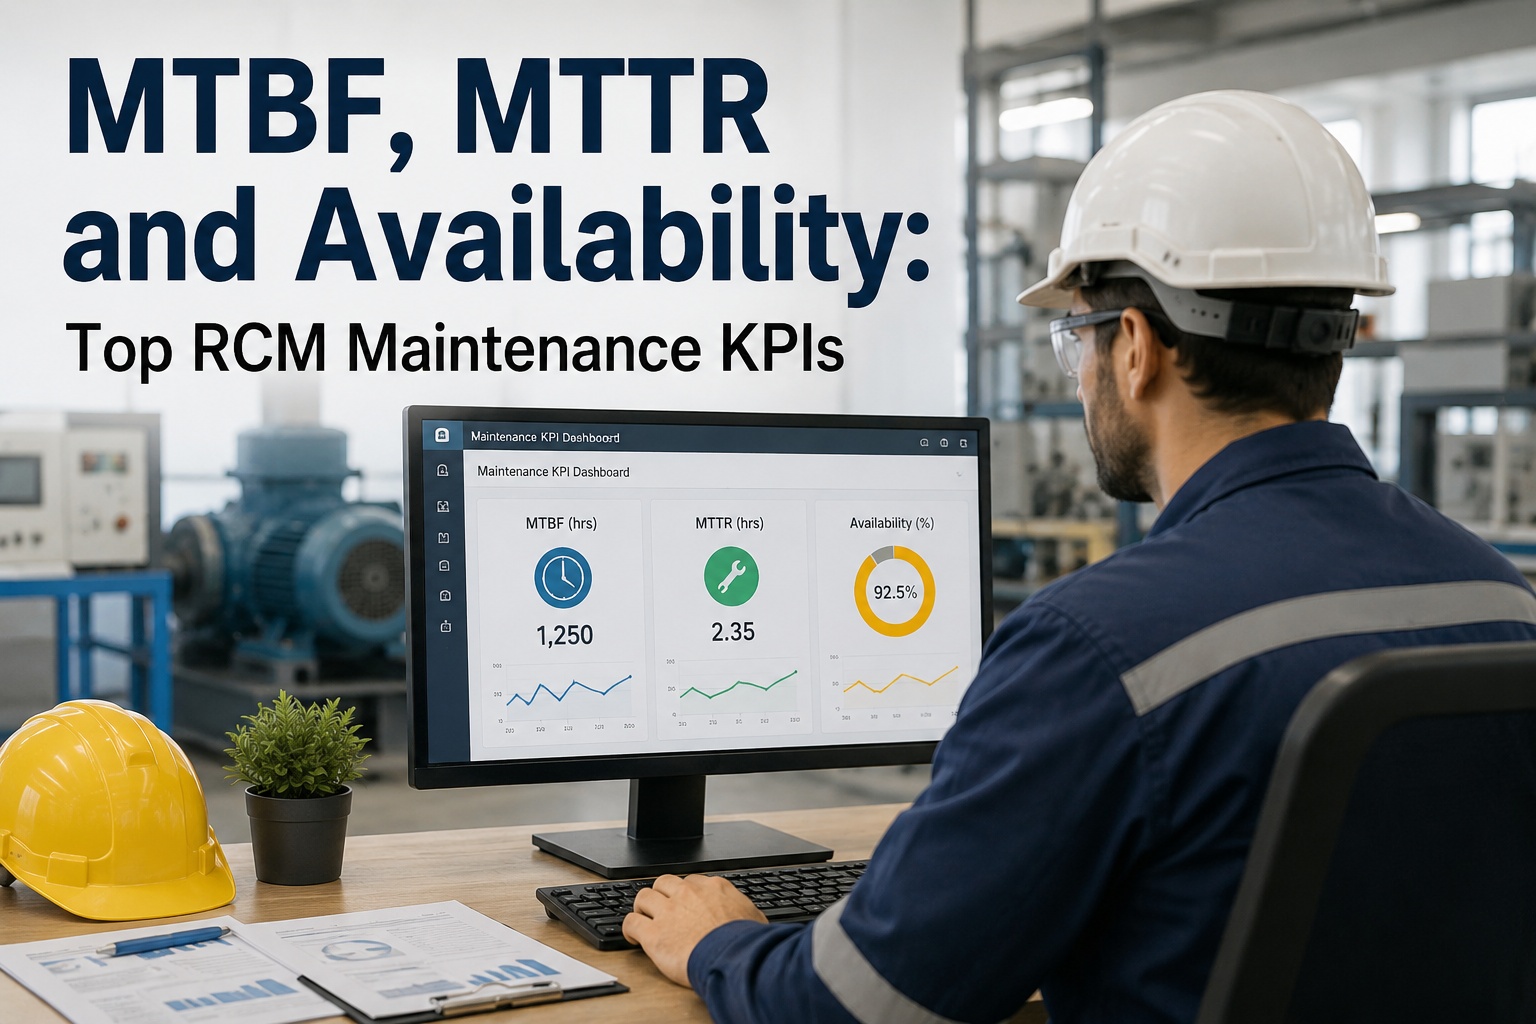
When an MRI is down, a ventilator is missing from the ICU, or an infusion pump fails mid-shift, patients wait and clinicians improvise. Most hospitals know their equipment breaks. Far fewer can say how often, for how long, and which devices cause the most trouble. That is what uptime KPIs answer. This guide explains the metrics that matter, how to calculate them, what "good" looks like, and how to build a dashboard your biomedical team can act on, using OXMAINT AI, the AI-powered CMMS built for hospital maintenance and biomedical teams.
Hospital Maintenance · Biomedical Engineering · Equipment Reliability
If You Can't Measure Equipment Uptime, You Can't Protect Patient Care
Uptime, MTBF, MTTR and PM compliance turn "the device keeps breaking" into numbers you can trend, benchmark and improve. OXMAINT AI calculates them automatically from your work orders.
Live Uptime Dashboard
MTBF & MTTR Tracking
Criticality-Based Targets
The Uptime Formula in 30 Seconds
Everything starts with one simple calculation. Equipment uptime, also called availability, is the share of scheduled time a device is ready for clinical use. Sign up free and see uptime calculated for every asset.
Why 99% Is Not "Almost Perfect"
A few percentage points sound small until you convert them into days a device is unavailable. This is why critical devices need much tighter targets than general equipment.
What Uptime Means Over a Full Year (8,760 Hours)
Bar length is relative to 95% uptime. Downtime hours shown per year, per device.
The 6 KPIs Every Hospital Equipment Team Should Track
Uptime tells you the outcome. These six metrics tell you why it moved and what to fix. Book a demo to see all six on one dashboard.
AVAILABILITY
Equipment Uptime %
(Scheduled time − downtime) ÷ scheduled time
Shows how often a device is ready for patients. Track by device, department and criticality tier.
RELIABILITY
MTBF
Operating hours ÷ number of failures
Mean time between failures. Higher is better. A falling MTBF warns of ageing or misuse before big failures.
RESPONSIVENESS
MTTR
Total repair time ÷ number of repairs
Mean time to repair. Lower is better. Long MTTR often points to parts delays, vendor waits or skill gaps.
DISCIPLINE
PM Compliance %
PMs completed on time ÷ PMs scheduled
Measures whether prevention is actually happening. Many hospitals target 90% or higher, with critical devices at or near 100%.
MIX
Planned vs. Reactive Work
Planned work orders ÷ total work orders
A rising share of planned work usually means fewer emergencies, calmer shifts and lower repair cost.
REPEAT FAILURE
Repeat Repair Rate
Repeat repairs within 30 days ÷ total repairs
Exposes fixes that did not hold. Useful for spotting root causes, training needs and replacement candidates.
How MTBF and MTTR Combine Into Availability
Reliability and repair speed work together. A device that rarely fails but takes weeks to fix can still have poor availability. Start free and track both automatically.
Worked Example: An ICU Ventilator Fleet
STEP 1
MTBF
1,000 hrs
Average run time between failures
+
STEP 2
MTTR
8 hrs
Average time to restore to service
→
RESULT
Availability
99.2%
1,000 ÷ (1,000 + 8)
Cut MTTR from 8 hours to 4 and availability rises to about 99.6%, without changing how often the device fails.
Not All Devices Need the Same Target
Setting one uptime goal for every asset wastes effort. Tier equipment by patient-risk and set targets accordingly. The tiers below are illustrative, so tune them to your own risk assessment. Book a demo to see criticality tiers in the asset register.
TIER 1 · LIFE SUPPORT
Ventilators, defibrillators, anesthesia machines, infusion pumps, patient monitors in critical care
Target: highest uptime · backup units ready · PM near 100% · fastest response
TIER 2 · DIAGNOSTIC & THERAPY
MRI, CT, X-ray, ultrasound, sterilizers, dialysis machines, lab analyzers
Target: high uptime · vendor SLAs · planned downtime scheduled off-peak
TIER 3 · GENERAL CLINICAL
Beds, wheelchairs, exam lights, general-ward monitors, suction units
Target: standard uptime · routine PM · swap-out when needed
TIER 4 · NON-CLINICAL
Office and low-risk support equipment
Target: run-to-failure or light PM · minimal tracking effort
Where Downtime Usually Hides
Repair time is only part of the picture. Much of the lost availability sits in waiting: for someone to notice, for a technician, for a part, for a vendor. Tracking each stage shows where hours actually disappear. Sign up free and time every stage of a repair.
Typical Downtime Timeline of a Single Failure (Illustrative)
Reportdelay
Responsewait
Diagnose
Parts / vendorwait
Repair
Test
In many departments, waiting phases outweigh hands-on repair time. Measure each phase, then shorten the longest first.
See Every Device's Uptime Without Building a Single Spreadsheet
OXMAINT AI turns work orders, PM completions and downtime timestamps into live KPIs by device, department and tier.
What a Useful Uptime Dashboard Looks Like
A good dashboard gives the biomedical manager the answer to "what needs attention today" in seconds.
Illustrative Equipment Performance Panel
Infusion Pumps (ICU)
ON TARGET
Green = target met · Amber = trending down · Red = intervention needed · figures are examples only
Your 90-Day Plan to Improve Uptime
You do not need a big programme to start. Build the baseline, then improve it in steps. Book a demo and we will map this plan to your fleet.
Days 1–30
Baseline
Load your asset register · tag criticality tiers · log every failure with start and end times · set PM schedules
Days 31–60
Measure
Review uptime, MTBF, MTTR and PM compliance monthly · find the top 10 problem devices · timestamp each waiting stage
Days 61–90
Improve
Fix root causes on repeat failures · stock critical spares · tighten vendor SLAs · build the replacement case with data
What OXMAINT AI Gives Your Biomedical Team
One maintenance platform for tracking, scheduling and proving equipment performance.
Automatic KPI Calculation
Uptime, MTBF, MTTR and PM compliance computed from work orders, with no manual math.
Downtime Timestamps
Capture when a device goes down, when it is fixed and what caused the delay.
PM Scheduling & Alerts
Time- and usage-based PMs with reminders so due dates do not slip.
Criticality-Based Asset Register
Tier every device and set targets, response times and priorities to match.
Failure History & Repeat Repairs
Full life-of-device history that exposes recurring faults and replacement candidates.
Audit-Ready Reports
Maintenance and inspection records available on demand for accreditation reviews.
Frequently Asked Questions
What is a good uptime target for hospital medical equipment?
It depends on criticality. Life-support devices usually need the highest targets, often supported by backup units, while low-risk equipment can have looser goals. Set targets by tier, then track actual performance against them.
Sign up free and set tiered targets.
What is the difference between MTBF and MTTR?
MTBF measures how long a device typically runs between failures, so it describes reliability. MTTR measures how long it takes to restore the device after a failure, so it describes repair speed. You want MTBF high and MTTR low.
Does preventive maintenance really improve uptime?
How do we start tracking downtime if we have no data today?
Start with your Tier 1 and Tier 2 devices. Log every failure with a start time, end time and cause for 30 days. That baseline is enough to calculate your first uptime and MTTR figures.
How long does it take to set up equipment KPIs in OXMAINT AI?
Most teams load their critical assets and PM schedules within days, then expand to the full fleet. KPIs begin appearing as soon as work orders are logged.
Start free this week.
Know Your Uptime. Fix What Fails. Keep Patient Care Moving.
Bring equipment tracking, preventive maintenance and performance KPIs onto one platform, and turn reactive firefighting into measurable reliability.