Most weekly maintenance reports fail the same way: they're a data dump the maintenance manager spends hours assembling and executives spend thirty seconds skimming before filing. The problem isn't effort — it's structure. Executives don't want your work-order count; they want to know whether the plant is getting more reliable or less, what nearly went wrong, and what you need from them. A weekly report either builds executive trust in the maintenance function or quietly erodes it. This guide breaks down the eight sections that actually get read — the KPIs that belong at weekly cadence, the incidents worth surfacing, and the forward-risk view that turns you from a cost center into a partner. Start free on OxMaint to auto-generate every section, or book a demo.
Weekly Report · KPIs · Backlog · Forward Risk
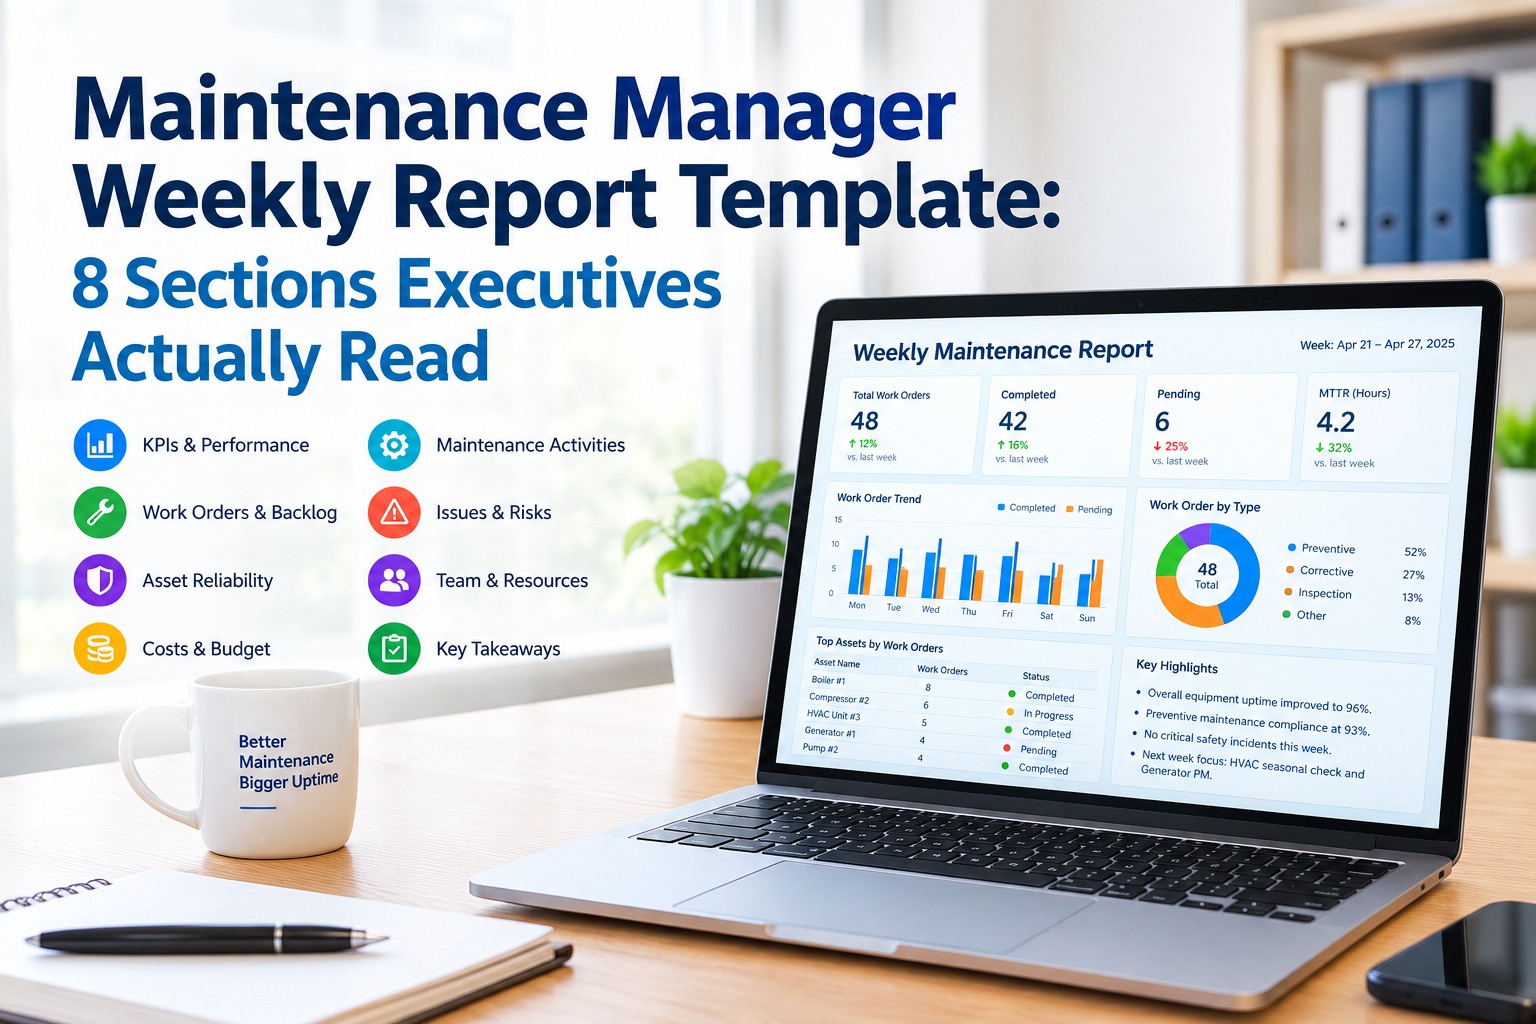
Maintenance Manager Weekly Report Template: 8 Sections Executives Actually Read
A great weekly report answers three executive questions in one page: is reliability improving, what nearly broke, and what do you need? Here's the eight-section structure that delivers it.
What every executive is really asking
1 Is the plant getting more reliable?
2 What nearly went wrong this week?
3 What do you need from me?
Why Most Weekly Reports Get Ignored
A KPI reviewed every Monday at 8 a.m. becomes a management tool; a report reviewed "when we get around to it" stays a document nobody reads. The reports that fail share three traits: they mix weekly operational metrics with monthly trend metrics until nothing is actionable, they bury the one incident that mattered under fifty routine closures, and they never say what the manager needs. Plants running on stale weekly snapshots average nine more hours of unplanned downtime per week than those working from live data — so the report isn't just admin, it's the difference between reacting and anticipating. The eight sections below fix all three failures — and you can sign up free to have every one of them built from live data instead of assembled by hand.
The 8-Section Anatomy
Each section earns its place by answering something an executive acts on. Notice the order: it opens with the verdict, not the detail — executives read top-down and stop when they're satisfied. Want it pre-built for your plant? Book a demo and we'll map all eight sections to your CMMS data.
1
Executive Summary — The Verdict First
Three to four sentences: reliability direction, the week's one big event, and any ask. If an executive reads only this, they should know whether to worry. Everything below is the evidence.
2
Weekly KPIs — The Right Metrics for the Cadence
Only leading, still-actionable numbers belong weekly: schedule compliance, backlog weeks, emergency/reactive work %, and wrench time. Save MTBF, MTTR, and PM compliance for the monthly — they need cycles to accumulate.
3
Backlog Health & Aging
Not a raw count — a trend by age bucket (0–7, 8–30, 30–90, 90+ days). A healthy backlog is 3–5 weeks of ready work per craft; a growing 30+ day bucket means work is arriving faster than you clear it.
4
Incidents & Significant Events
The one or two failures that mattered — what happened, impact, and root cause or action. This is the section executives actually remember; don't drown it in routine completions.
5
Safety & Compliance
Safety-critical PMs completed, inspections due, any compliance gaps. Executives carry the liability here — a clean line builds trust; a hidden gap destroys it when it surfaces later.
6
Spend & Resources
Week's labor and parts spend against plan, plus crew load balance. Frame overtime and expedited parts as the cost of specific decisions, not a line item — it makes the number legible.
7
Forward Risk — Next Week's Watchlist
The section that changes your standing: assets trending toward failure, PMs at risk of slipping, parts shortages ahead. This turns the report from a rear-view mirror into a windshield.
8
The Ask — Decisions & Support Needed
Explicit, short: budget approvals, resource conflicts, decisions only leadership can make. A report with a clear ask gets a response; one without one gets filed.
Auto-Generate Every Section From Live Data — Free Forever
Stop assembling this by hand every Friday. OxMaint calculates schedule compliance, backlog aging, reactive %, and spend automatically from work-order data as your team works — so the weekly report is a five-minute review of live numbers, not an afternoon in a spreadsheet nobody trusts. No card, no time limit.
Weekly vs Monthly: Put the Metric in the Right Report
The single most common reporting mistake is putting monthly trend metrics in a weekly report, where they can't move enough to be actionable and just add noise. Match the metric to the cadence its data supports — or start free and let OxMaint sort each KPI into the right report for you automatically.
Weekly — leading, act now
Schedule compliance
Backlog weeks & aging
Emergency / reactive %
Wrench time / crew load
You can still change the outcome this week.
Monthly — lagging, trend
MTBF
MTTR
PM compliance
Availability / OEE
Needs multiple cycles to mean anything.
The Number That Anchors the Whole Report
If you surface one benchmark to executives, make it PM compliance against the 85% line — because it predicts everything downstream.
At or above 85%
Reactive failure rates stay controlled and the program holds. This is the floor, not the goal.
Below 85%
Reactive failures climb sharply — every 1% drop tends to show up as measurable MTBF loss within 60 days.
How OxMaint Builds Your Weekly Report
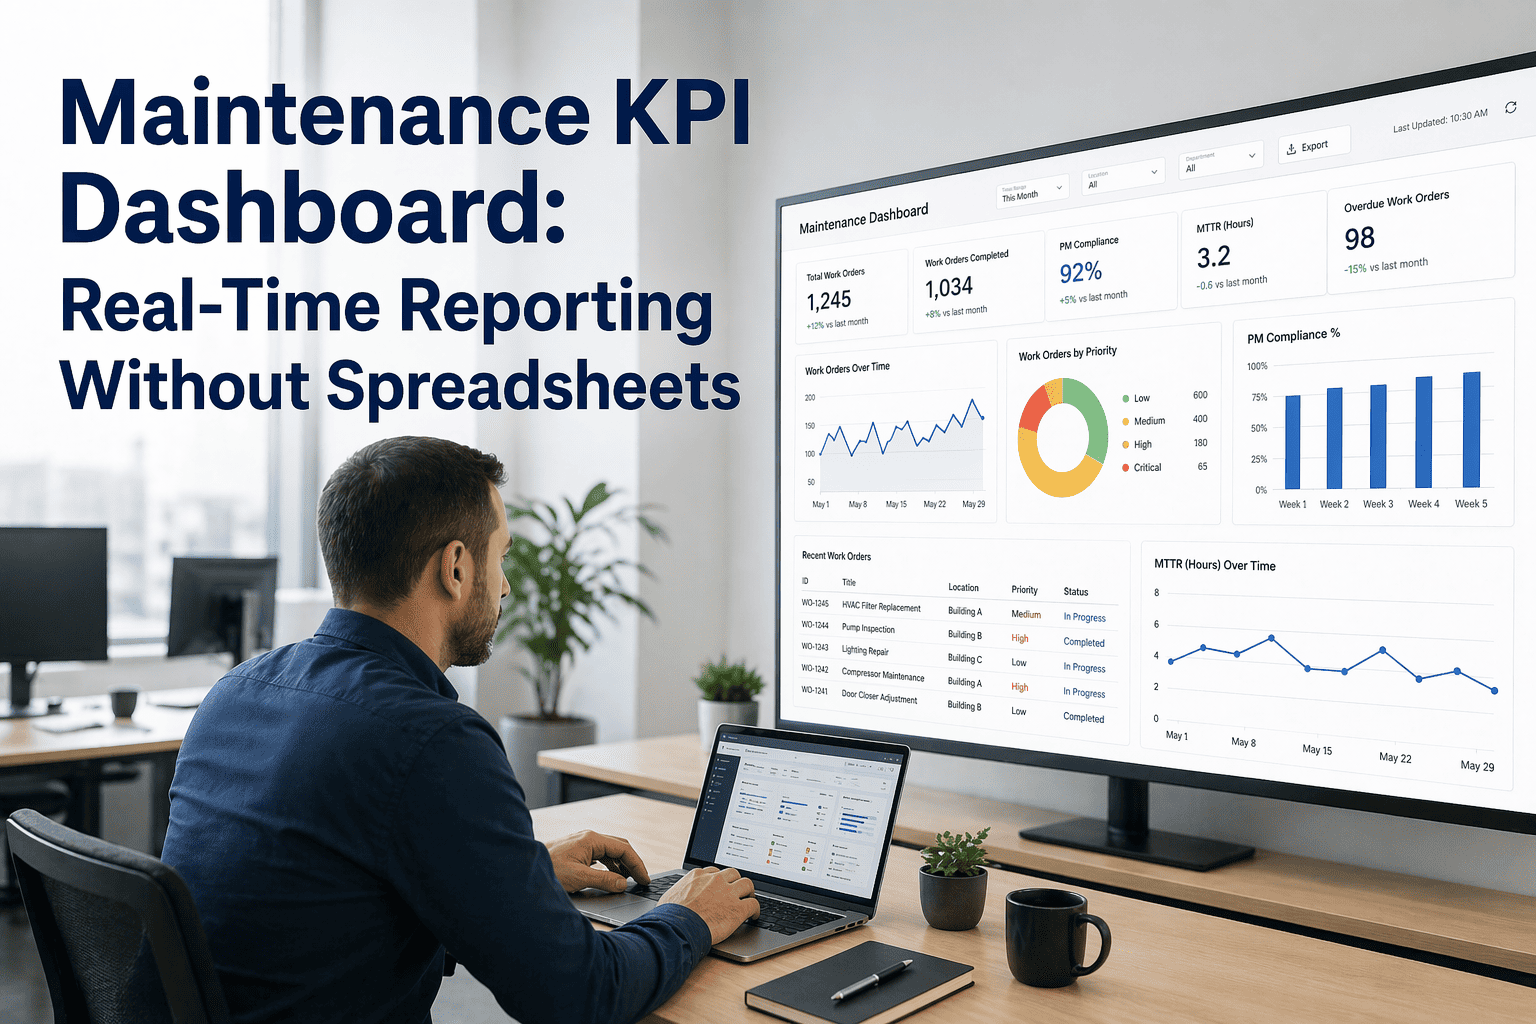
Every work order your team opens and closes feeds a live KPI engine — so the eight sections assemble themselves from real data, in role-based views, ready to review in five minutes every Monday instead of an afternoon of spreadsheet wrangling.
Auto-Calc
Live KPIs
Schedule compliance, backlog, reactive %, and spend computed from work-order data in real time — zero manual math.
Aging
Backlog Buckets
Open work auto-grouped by 0–7 / 8–30 / 30–90 / 90+ days, with the trend that flags a growing bucket.
Flag
Incidents & Risk
Significant events and assets trending toward failure surfaced automatically for the incident and forward-risk sections.
Roles
Audience Views
Executive scorecard, manager backlog view, engineer asset detail — one dataset, the right cut for each reader.
Schedule
Auto-Distribution
The report generated and emailed on a set day and time, as PDF or dashboard — consistency without the reminder.
Trend
Rolling History
Each week compared to prior periods so direction — the thing executives read for — is always visible.
Turn Friday Afternoon Into a Five-Minute Review
Free forever plan — no card, no time limit. Let OxMaint build all eight sections from live work-order data, in the right view for every reader, distributed automatically. Or book 30 minutes and we'll wire your weekly report to your CMMS data end to end.
Frequently Asked Questions
Which KPIs belong in a weekly maintenance report — not monthly?
Weekly reports should carry leading, still-actionable metrics: schedule compliance, backlog weeks and aging, emergency/reactive work percentage, and wrench time or crew load. Save MTBF, MTTR, PM compliance, and OEE for the monthly report — they're lagging trend metrics that need several maintenance cycles to move meaningfully, so they just add noise at weekly cadence.
Start free to see them auto-calculated.
What makes a weekly report one executives actually read?
Lead with the verdict, not the data. Open with a three-sentence executive summary answering whether reliability is improving, what nearly went wrong, and what you need — then let the sections below serve as evidence for anyone who wants detail. Surfacing the one incident that mattered and ending with a clear ask are what turn a filed document into a decision-driving tool.
Book a demo to see the verdict-first template built on your data.
What is a healthy maintenance backlog?
Roughly 3–5 weeks of ready-to-schedule work per craft. Below about 2 weeks, planners can't build efficient schedules and end up working day-to-day; well above 5 weeks, work is arriving faster than it clears. Report backlog as an aging trend across 0–7, 8–30, 30–90, and 90+ day buckets — a growing 30+ bucket is the early warning, not the raw total.
Why is 85% PM compliance the number to highlight?
Because it's the most predictive leading indicator you have. At or above 85%, reactive failure rates stay controlled; below it, they rise sharply — and every 1% drop typically shows up as measurable MTBF reduction within about 60 days. Putting PM compliance against the 85% line gives executives a single number that forecasts where reliability is heading.
Book a demo to see it tracked live.
Can a CMMS generate the weekly report automatically?
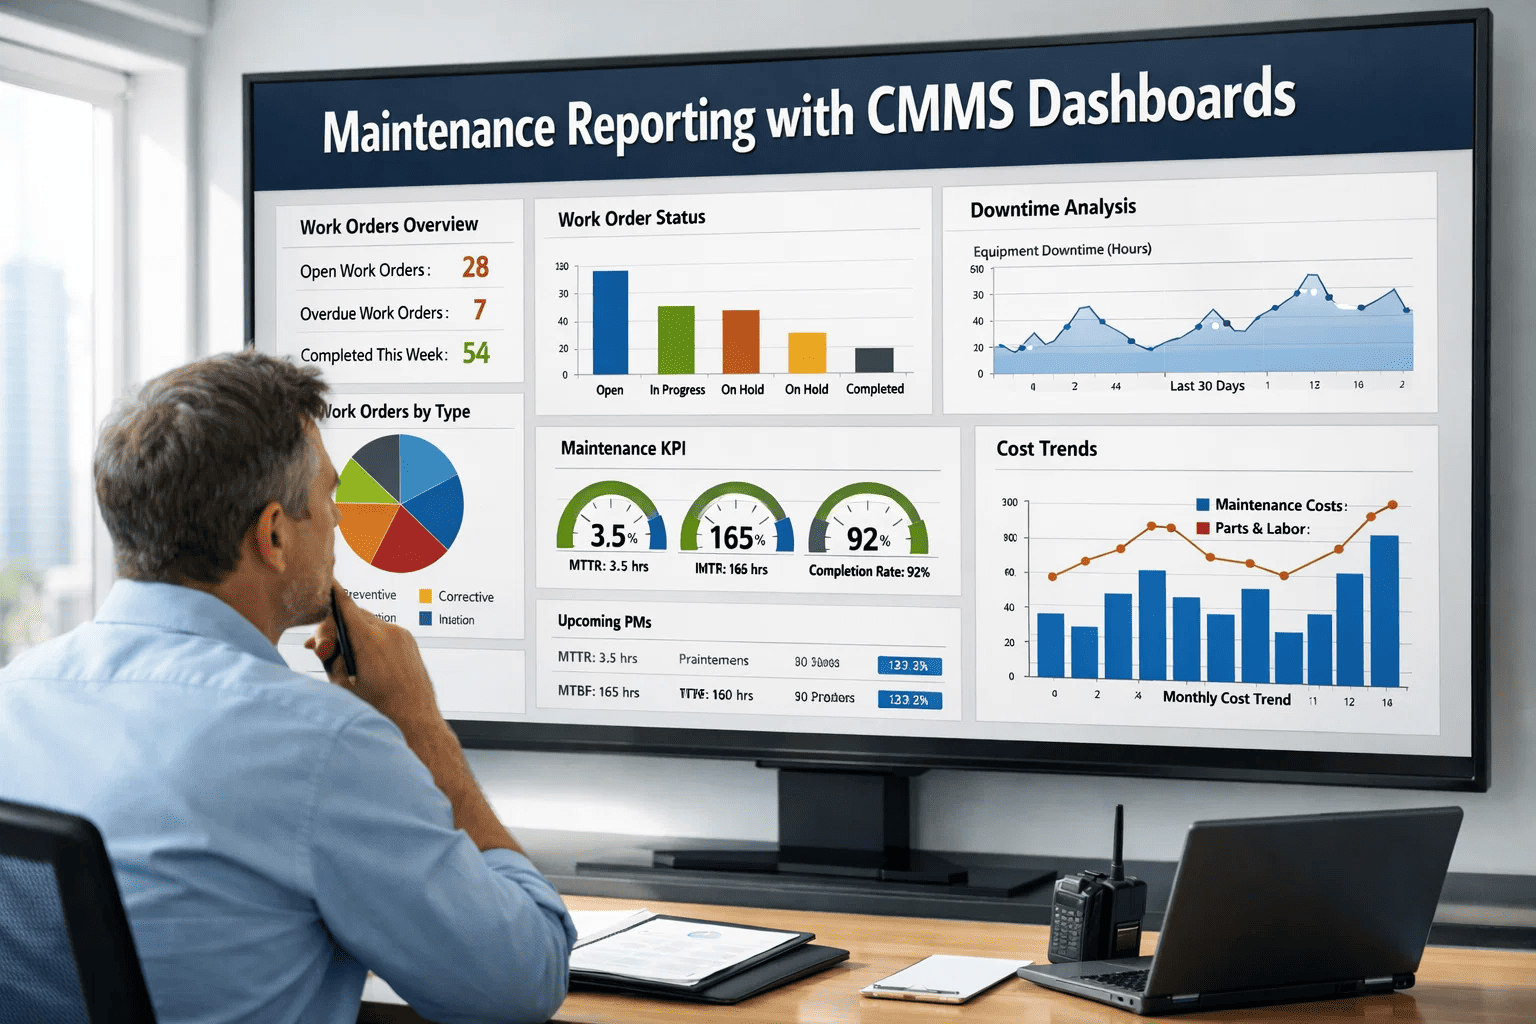
Yes — that's the point of moving off spreadsheets. As your team opens and closes work orders, OxMaint calculates the weekly KPIs, ages the backlog, flags incidents and at-risk assets, and assembles role-based views that can be scheduled and emailed on a set day. The manager's job shifts from gathering data to interpreting it — a five-minute Monday review instead of a Friday afternoon lost to a spreadsheet nobody trusts.