PLC and control systems don't fail loudly — they drift. A processor runs a few degrees hotter than it did last quarter, a 24 VDC rail sags under load, an I/O module logs a handful of communication retries per hour, and none of it trips an alarm. Then the line goes down at 3 a.m. and the diagnostic buffer shows the drift had been building for weeks. Real condition monitoring for PLC and control systems catches those signals early — cabinet temperature, power-rail stability, I/O health, event-log frequency — and turns each abnormal reading into a scheduled work order instead of an emergency call-out. This guide covers what to monitor, where to place sensors, how to set thresholds that actually trigger action, and how to run it all as a closed-loop program. Book a setup session to map monitoring onto your control assets.
The Drift Nobody Sees Until It's a Trip
Voltage sag, thermal creep, and I/O retry noise show up long before the fault code.
±5%
Tolerance on the 24 VDC control rail — sag beyond this drives intermittent I/O faults
55°C
Typical CPU derating point where processor scan-time and reliability start to degrade
Weeks
Lead time drift gives you before a hot processor or a sagging rail actually trips
4
Signals that catch most PLC and I/O failures early — temp, voltage, comms, humidity
Sensor Placement Map · Where Readings Actually Come From
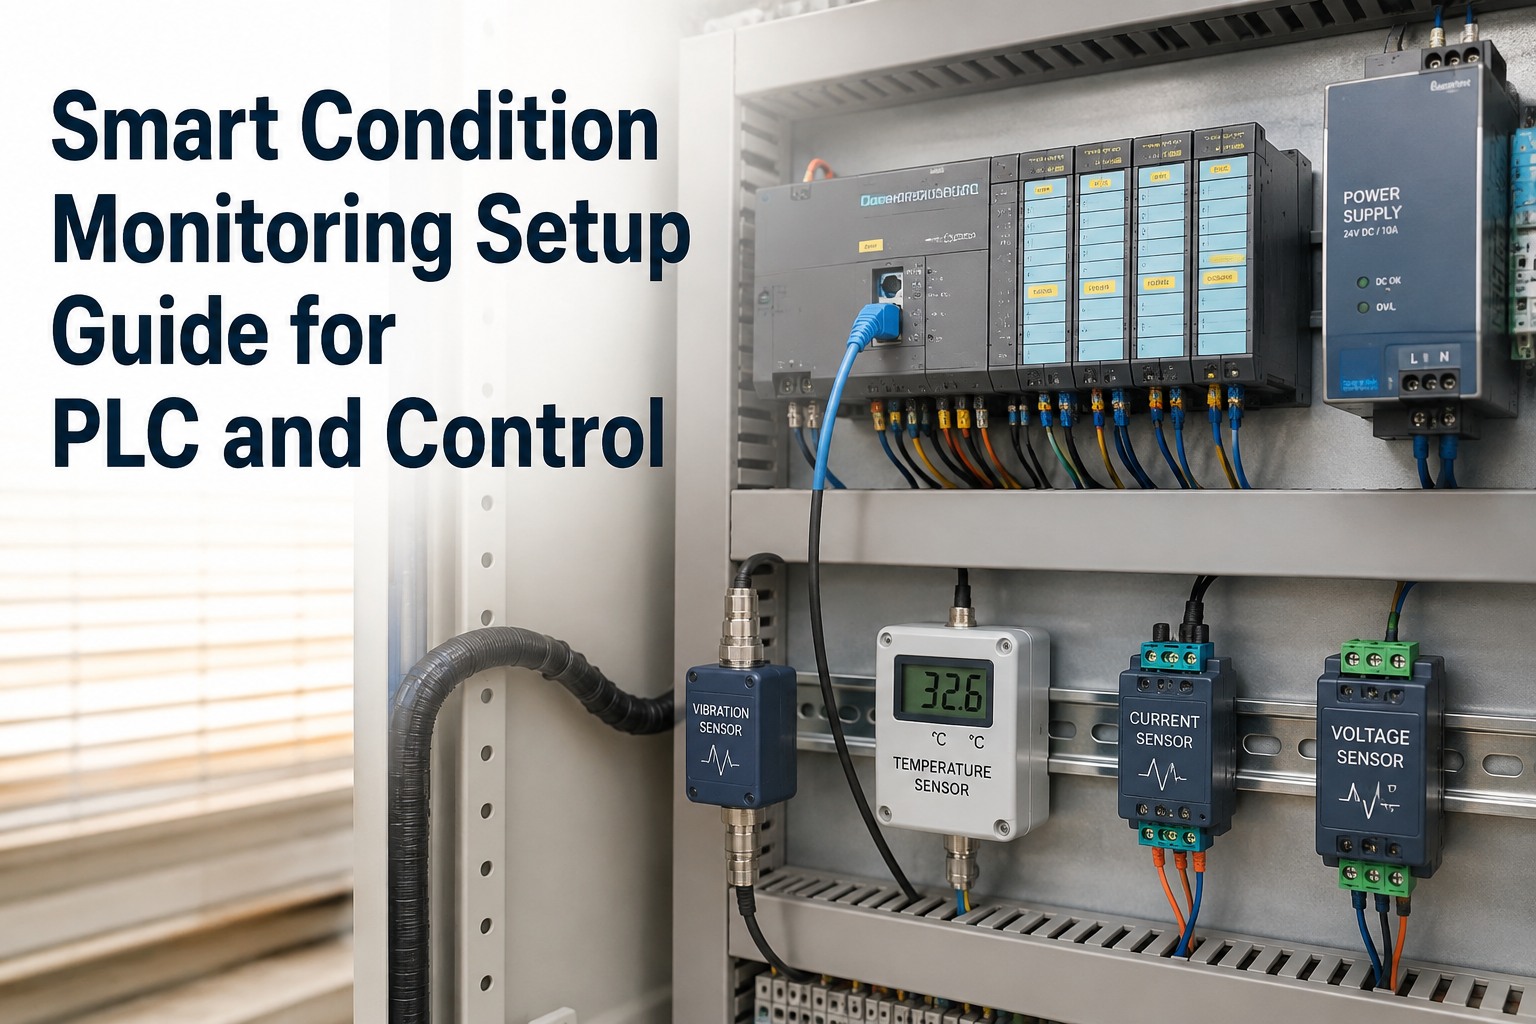
The single most common setup mistake is one temperature sensor stuck on the cabinet door. That reading tells you about the room, not the processor. Effective condition monitoring places sensors at the specific points where drift shows up first — inside the cabinet at CPU height, on the DC rail terminals, at the I/O rack, and at cable entry points where humidity gets in.
01
CPU / Processor Module
Temperature probe within 25mm of CPU heatsink — catches thermal creep before scan-time degrades
02
I/O Rack — Input Cards
Module status via backplane — retry counts and diagnostic bits pulled directly, no external sensor needed
03
I/O Rack — Output Cards
Current-draw per channel where the module supports it — early sign of a shorting field device
04
24 VDC Power Supply
Voltage tap on the DC terminal block — trend the rail under load, not just at rest
05
Line-Side AC / Breaker
Current transformer on incoming feed — flags fan/heater loads that shouldn't be drawing
06
Cable Entry / Bottom Gland Plate
Humidity + dew-point sensor at the coldest interior surface — where condensation forms first
The Six Signals That Catch Most Failures Early
Vibration gets the headlines in condition monitoring, but for PLC and control systems the high-yield signals are electrical and environmental. These six cover the failure modes that account for the majority of unplanned control-system downtime — power supply, I/O, and processor faults. Teams new to condition monitoring can start free on OxMaint and begin logging these signals against a single critical cabinet before rolling out plant-wide.
POWER
24 VDC Rail Stability
Trend voltage under load, not idle. A supply that reads 24.1 V at rest but sags to 22.8 V when contactors pull in is on its way out — and drives intermittent input faults that get blamed on field devices.
THERMAL
Cabinet + CPU Temperature
Ambient inside the cabinet plus a spot reading near the processor. Rising delta between the two flags a failing cabinet fan or a blocked filter long before the CPU hits its derating point.
I/O HEALTH
Module Diagnostic Bits
Every modern I/O module exposes retry counters, blown-fuse bits, and channel-fault flags on the backplane. Poll them; a card logging steady retries is failing, not the field sensor upstream of it.
ENVIRONMENT
Humidity + Dew Point
A cabinet cooling overnight into humid ambient can condense on terminal blocks. Track dew-point margin, not just relative humidity, and the corrosion trail becomes preventable.
LOAD
Output-Channel Current
On modules that report it, per-channel current trend catches a solenoid coil starting to short before it takes the module's output fuse with it. Rising baseline is the tell.
EVENT LOG
Diagnostic Buffer Rate
Count entries per hour, per module. A quiet controller that suddenly logs a dozen minor faults an hour is telling you something changed — even if nothing has tripped yet.
Turn These Six Signals Into Auto-Generated Work Orders
30-minute working session — bring your PLC asset list and current alarm setup. We'll map each signal to a threshold, show how OxMaint auto-generates work orders on warning vs alarm, and how the trend history stays attached to the asset.
The Threshold Ladder · Normal, Warning, Alarm, Trip
A threshold that only fires on trip is a broken threshold — by the time it goes off, the failure has already happened. Effective monitoring uses a four-band ladder: a normal operating range, a warning band that generates a maintenance work order, an alarm band that escalates to on-call, and the trip that stops the process. The bands below are typical starting points for a general control cabinet — always tune to your specific hardware's derating curves.
Signal
Normal
Warning
Alarm
Action Triggered
24 VDC rail (under load)
23.5–24.5 V
22.8–23.5 V
< 22.8 V
Warning → PM work order for supply test; alarm → replace
Cabinet interior temperature
< 40 °C
40–50 °C
> 50 °C
Warning → check fan/filter; alarm → cabinet cooling repair
CPU temperature
< 50 °C
50–55 °C
> 55 °C
Warning → confirm airflow; alarm → derating risk, plan outage
Dew-point margin
> 8 °C
4–8 °C
< 4 °C
Warning → check heater/desiccant; alarm → condensation risk
I/O retry count (per module)
0 / hour
1–5 / hour
> 5 / hour
Warning → wiring/terminal check; alarm → module swap plan
Diagnostic-buffer entries
Baseline ± 20%
+50% vs baseline
+200% vs baseline
Warning → review new entries; alarm → root-cause investigation
Values above are illustrative starting points for a general 24 VDC control cabinet. Always align warning and alarm bands to the specific derating curves in your CPU, power supply, and I/O module datasheets — a rack that operates at 55 °C by design needs different thresholds than one specified to 40 °C. Book a 30-minute demo and we'll walk through your hardware datasheets to set the bands that actually fit your cabinets.
Setup Sequence · Five Steps to a Working Program
A condition-monitoring program that skips the baseline stage produces alarms nobody trusts. This is the order that actually gets you to actionable readings — asset list first, baseline second, thresholds third, and only then the alarm routing that people will act on. You can sign up free forever to run the baseline stage and the first threshold set on unlimited assets — no card, no time limit.
01
Inventory the Assets Worth Monitoring
Not every PLC needs a full sensor kit. Rank cabinets by the downtime cost of the process they control — the top 20% of assets typically drive 80% of the risk and get the full six-signal treatment first.
02
Install Sensors at the Map Points
Cabinet temperature, CPU-adjacent temperature, humidity/dew-point at cable entry, and voltage taps on the DC rail. Wire I/O diagnostic bits and event-log pulls through the backplane, not extra hardware.
03
Run a 30-Day Baseline Before Setting Thresholds
Log every signal for a full production cycle — day/night, weekday/weekend, seasonal ambient shift. Warning and alarm bands set against real baseline data catch drift; bands guessed from a datasheet generate noise.
04
Route Warnings to Work Orders, Alarms to People
Warning-band crossings should auto-generate a scheduled PM work order — no phone call, no interruption. Only alarm-band events wake someone up. This is the discipline that keeps the program trusted long-term.
05
Log Every Intervention Against the Asset
The trend line only means something with the interventions overlaid on it. Every fan swap, every module replacement, every threshold adjustment — logged against the asset so next year's baseline is defensible.
Early Warning Signals a Technician Should Escalate
Between scheduled inspections, these are the readings and observations a control-room operator or maintenance tech should treat as a trigger to investigate — even when nothing has tripped and nothing is alarming yet.
Rising baseline current draw on an output channel with no process change to explain it
DC rail voltage sag under load — 24 V at rest, dropping to 23 V or below on contactor pull-in
Widening cabinet-to-ambient temperature delta — points to a failing fan or clogged filter
New diagnostic-buffer entries that weren't in last week's log, even at low frequency
Intermittent input false-reads that clear on their own — usually a supply or terminal-block issue, not the sensor
Scan-time creep over consecutive weeks with no program change — often thermal or memory-related
How OxMaint Closes the Loop From Reading to Work Order
Sensor data is only worth collecting if it drives action. OxMaint ingests the signals from your PLCs and cabinet sensors, applies your thresholds, auto-generates the right work order on warning versus alarm, hands the technician the trend chart plus the recommended action, and logs every intervention back against the asset — so next year's baseline is defensible and the program actually pays for itself.
Ingest
Sensor + Backplane Data In
Cabinet sensors, I/O diagnostic bits, and event-log pulls flow into the asset record — one trend history per PLC and per critical module.
Trigger
Thresholds Generate Work Orders
Warning-band crossings auto-create a scheduled PM work order; alarm-band events escalate to on-call — no manual translation, no missed drift.
Direct
Trend + Recommended Action
The technician opens the work order to the trend chart, the failure mode most consistent with the reading, and the checklist for verifying it.
Execute
Mobile Sign-Off With Photos
Mandatory fields and photo capture on completion — evidence the reading was investigated, what was found, what was replaced.
Learn
Interventions Overlay the Trend
Every fan swap, module replacement, and threshold change plots against the trend line — so patterns become obvious across similar cabinets.
Prove
Reliability Metrics Per Asset
MTBF, MTTR, and cost per intervention roll up per cabinet and per site — the defensible answer when finance asks what monitoring is returning.
Shift PLC Maintenance From Reactive to Predictive
See how OxMaint ingests condition-monitoring signals from your control cabinets, applies your thresholds, generates work orders on warning versus alarm, and builds the reliability history that proves the program is paying off. Free forever plan available.
Frequently Asked Questions
Which signals matter most for PLC and control system condition monitoring?
For control cabinets the high-yield signals are electrical and environmental rather than mechanical — 24 VDC rail stability (measured under load, not at rest), cabinet and CPU temperature, I/O module diagnostic bits and retry counts, humidity with dew-point margin, output-channel current trend where the module reports it, and the rate of new entries in the diagnostic buffer. These six catch the majority of power-supply, I/O, and processor failures weeks before they trip.
Book a review of your current setup.
Where should temperature sensors actually be placed inside a control cabinet?
One sensor on the cabinet door only tells you about room ambient. Effective placement uses at least two — an interior ambient sensor at mid-cabinet height, and a spot reading within about 25 mm of the CPU heatsink. Tracking the delta between them is what flags a failing cabinet fan or clogged filter before the CPU actually hits its derating point.
How do I set warning and alarm thresholds without generating alarm fatigue?
Log every signal for a full 30-day production cycle first — day/night, weekday/weekend — and set warning bands against that real baseline rather than a generic datasheet number. Then route warning-band crossings to auto-generated PM work orders, not to a person's phone; only alarm-band events wake someone up. That separation is what keeps the program trusted long-term.
Do I need external sensors for I/O module health, or is backplane data enough?
Modern I/O modules already expose retry counters, blown-fuse bits, channel-fault flags, and on many platforms per-channel current draw — pulled straight from the backplane. External sensors add value for cabinet temperature, humidity, and DC-rail voltage under load, but I/O health itself is best monitored from the diagnostic data the modules are already reporting.
Sign up free to trend it against the asset.
How does OxMaint turn condition-monitoring data into actual work?
OxMaint ingests sensor data and I/O diagnostic bits against each PLC asset, applies your warning and alarm thresholds, auto-generates the right work order on each crossing, delivers the trend chart plus the recommended action to the technician on mobile, captures completion with photo evidence and e-signature, and overlays every intervention against the trend line — so MTBF, MTTR, and intervention cost roll up per cabinet and per site as defensible reliability metrics.