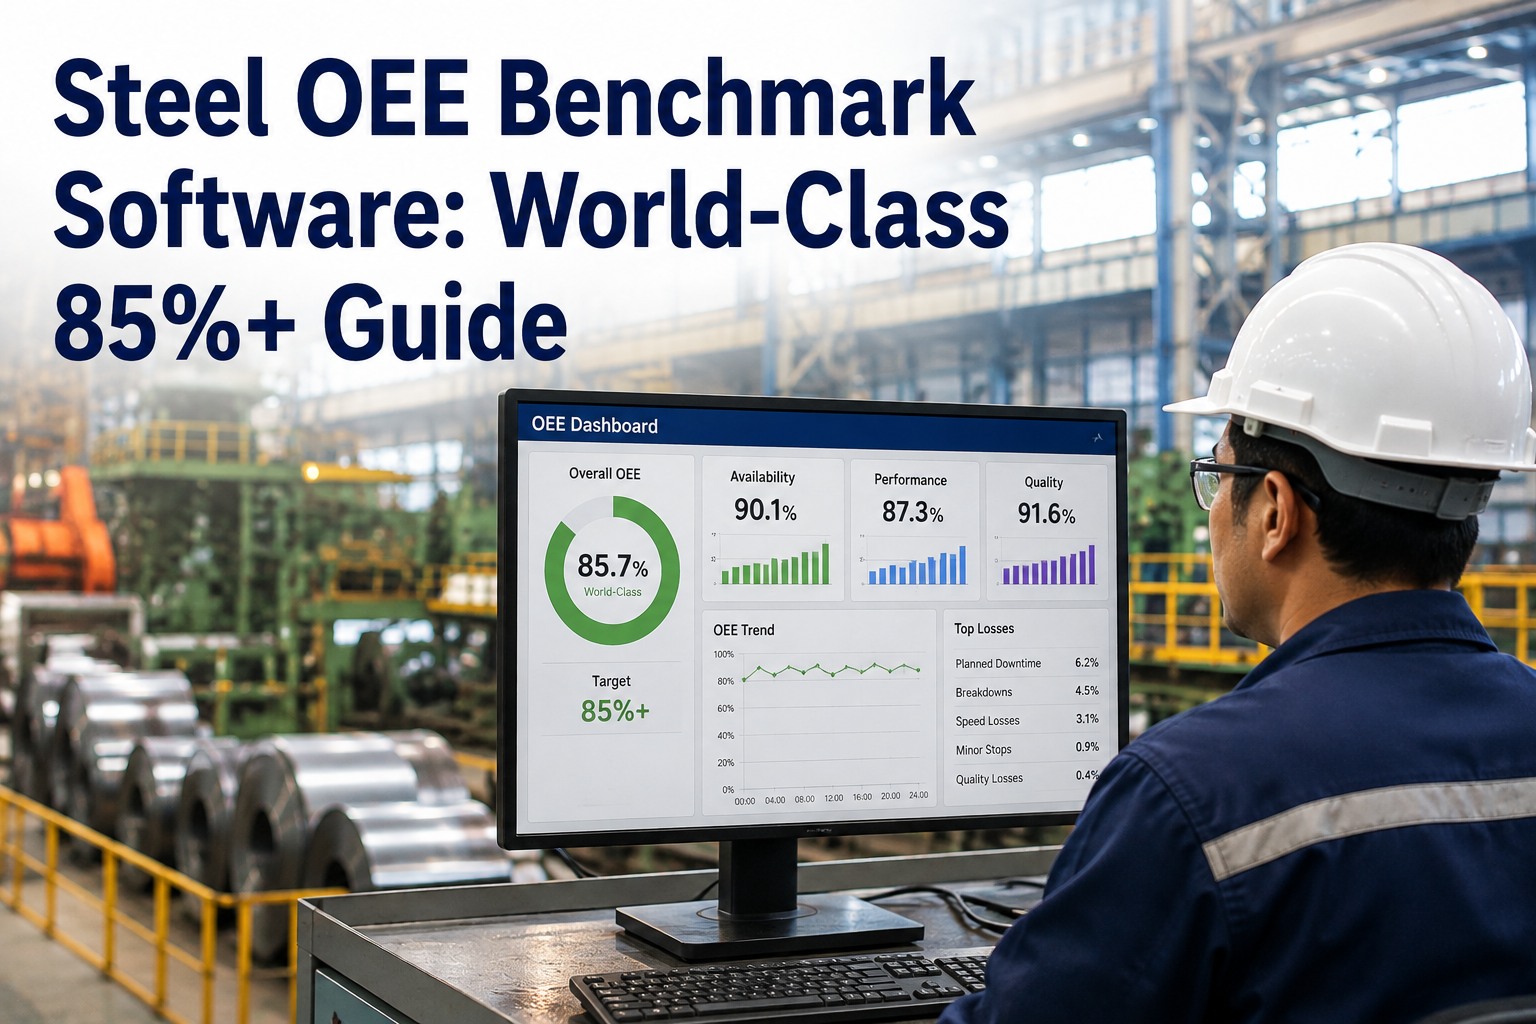
Most steel plants think their OEE is higher than it actually is. Measured properly across a 30-90 day baseline, the number typically lands 10-15 points below the plant manager's assumption — and the industry median for integrated steel producers sits around 65%, with top-quartile operations reaching 80%, and only about 3% of manufacturers globally sustaining the 85% world-class threshold defined by Nakajima's TPM work. The 85% number is the mathematical product of 90% availability × 95% performance × 99.9% quality — a directional target for how tightly the three components must work together. This guide breaks down where 85% comes from, how each component behaves in a steel environment, and how OxMaint CMMS turns your work-order stream into a live OEE benchmark dashboard. Start free or book a demo to see your live OEE against world-class within your first shift.
Steel · OEE Benchmarks · World-Class TPM · CMMS 2026
Steel OEE Benchmark Software: World-Class 85%+ Guide
Benchmark steel plant OEE with CMMS. Position vs industry 65-75% and world-class 85%+ targets — the benchmark discipline steel plant managers use for shift-level, line-level, and grade-level performance tracking.
85%
World-class OEE threshold — Nakajima TPM benchmark, 1984
~65%
Industry median OEE for integrated steel producers
~3%
Share of global manufacturers sustaining 85%+ consistently
8-14 pp
Typical OEE gain within 12 months of disciplined tracking
The Benchmark Ladder — Where Your Plant Actually Sits
Before you can close the gap to world-class, you have to know honestly which rung you're standing on. Most steel plant managers overestimate their OEE by 10-15 points until it's measured properly against a 30-90 day baseline. The ladder below is the industry-standard band map every plant manager reads against. Sign up free and OxMaint will calculate your live OEE band directly from your work-order stream within your first 30 days — no manual spreadsheets, no consultant engagement, and the free forever plan includes unlimited users so every shift supervisor can see the same number.
85% +
WORLD-CLASS
~3% of manufacturers globally
Nakajima TPM benchmark. All three factors firing simultaneously — near-zero unplanned downtime, disciplined micro-stop management, negligible scrap.
75-84%
TOP QUARTILE
Above steel industry median
Competitive integrated producer. Well-defined loss categories, strong maintenance-production alignment, PM compliance ≥85%.
60-74%
TYPICAL
Where most steel plants sit
Industry median band (~65%). Availability is usually the dragging factor. Big recoverable capacity — 8-14pp gain achievable in 12 months.
40-59%
BELOW AVERAGE
Reactive maintenance culture
Major losses across all three factors. Firefighting dominates. Immediate priority: baseline data capture + top-5 loss identification.
< 40%
CRITICAL
Capacity crisis territory
Equipment likely needs overhaul or replacement, OR the data is wrong. Verify measurement before making CAPEX decisions.
Where the 85% Number Actually Comes From — The Math
World-class 85% is not one number. It's the product of three components, and each one has to hit its own target simultaneously for the composite to clear the bar. Miss any single component and the multiplication effect punishes you. A plant at 90/90/90 doesn't score 90% — it scores 73%. That's the trap most steel operations fall into. Below is the arithmetic broken out. Book a 30-minute walkthrough and an OxMaint steel specialist will show you which of your three components is the drag anchor — before you ever open a trial workspace, you'll leave the call knowing where to focus first.
THE WORLD-CLASS OEE EQUATION · NAKAJIMA TPM 1984
AVAILABILITY
90%+
Uptime vs planned production time
×
PERFORMANCE
95%+
Actual speed vs designed speed
×
QUALITY
99.9%+
Good parts vs total parts
=
WORLD-CLASS OEE
85%+
Only ~3% globally
THE 90-90-90 TRAP
0.90 × 0.90 × 0.90 = 72.9%
"Good enough" on each factor still leaves you 12 points short of world-class. The multiplication punishes every small loss.
The Six Big Losses — Where Steel Plants Actually Bleed OEE
Every OEE point you lose maps to one of TPM's Six Big Losses. Each loss ties back to a specific component — availability, performance, or quality — and each has a specific corrective response. Steel plants tend to lose the most points to availability losses, because equipment intensity and thermal cycling hammer uptime harder than in almost any other industry. Below is the loss-to-component map every steel reliability engineer works against. Start free and OxMaint will auto-classify your work-order data into the Six Big Losses category as it comes in — you'll see which loss is bleeding the most points inside your first month, without any manual reclassification work.
AVAILABILITY LOSSES
01
Equipment Breakdowns
Unplanned failures — bearing seizures, motor failures, hydraulic leaks. The single biggest OEE killer in steel.
02
Setup & Changeovers
Roll changes, mandrel swaps, tundish changes. Reducible through SMED discipline and coordinated scheduling.
PERFORMANCE LOSSES
03
Minor Stops & Idling
Micro-stops under 5 minutes — jams, sensor trips, feed hesitations. Rarely logged, always add up.
04
Reduced Speed
Running below design cycle time. Often accepted as "the way it runs" — masks deeper equipment condition issues.
QUALITY LOSSES
05
Startup & Yield Losses
Off-spec product at head-end during ramp-up. Head/tail crops on strip. Warm-up scrap on continuous casters.
06
Production Defects & Rework
Surface defects, gauge variance, chemistry deviations. Steady-state quality losses across the coil or slab.
A Quarterly OEE Number Is a Post-Mortem. A Live One Is a Decision.
Plants that track OEE quarterly look backwards at capacity already lost. Plants that track it live — by shift, by line, by product grade — close the world-class gap 3x faster because every shift handover starts with the same visible score. OxMaint calculates it automatically from work-order data.
The 12-Month Improvement Trajectory — What "Realistic" Looks Like
World-class doesn't happen in a quarter. Steel facilities that commit to disciplined OEE tracking through a CMMS typically capture 8-14 percentage points of improvement within 12 months — with the majority of the gain landing in the first 90 days from loss identification and focused intervention on the highest-OEE-impact equipment. Below is the timeline shape most plants follow, mapped to the maintenance discipline that unlocks each phase. Book a 30-minute assessment call and an OxMaint steel engineer will build your site-specific improvement projection — including which of your production units will drive the biggest OEE gains — before you commit to a trial.
Day 0-30
Baseline Capture
Establish honest current-state OEE by production unit and shift. Most plants discover their actual OEE is 10-15 points lower than assumed once properly measured. This truth is the starting line, not the failure signal.
Day 31-90
Loss Identification & Quick Wins
Classify losses into the Six Big Losses buckets. Attack the biggest availability drag first — usually top-5 equipment breakdown modes. Expect 4-6 percentage points of gain from focused intervention alone.
Month 4-6
PM Compliance Push
Drive PM compliance from a typical 72% baseline toward 90%. This is where availability starts to lock in — breakdowns transition from surprise events to caught-early defects.
Month 7-12
Composite OEE Consolidation
Attention shifts to performance (micro-stops, reduced speed) and quality (yield losses, defects). Cumulative gain reaches 8-14 percentage points — a 65% plant lands at 73-79%.
Year 2-3
Sustained World-Class Trajectory
Closing the last 6-10 points to 85% takes 24-36 months and requires the full TPM culture — autonomous maintenance, focused improvement, early equipment management. The CMMS is the scaffold that holds all three together.
Spreadsheet OEE Reporting vs. OxMaint Live Benchmarking
Most steel plants still calculate OEE in a monthly spreadsheet cycle: shift logs → operator notebook → Excel workbook → PowerPoint deck for the plant manager review. That workflow tells you what happened, never what's happening. Here's what changes when the work-order stream feeds OxMaint directly. Start free to see your OEE calculated live from work-order data in your first workspace — no CAPEX request, no PLC replacement, no consulting engagement to get the baseline running.
Mills that put the same OEE number on every shift supervisor's screen close the world-class gap materially faster than plants that circulate a monthly PDF. Sign up free forever — unlimited users, unlimited work orders, no credit card — and get your first live OEE dashboard configured this week, or book a demo to see a working OEE benchmark dashboard from a live customer steel plant before you commit.
"
Our plant manager review was showing OEE at 71% and we felt fine about it — top of the industry median band. When we moved off the monthly spreadsheet onto OxMaint and let it calculate from live work-order data, the actual number came in at 63%. That eight-point delta wasn't a measurement error — it was 15-30% MTTR under-reporting on the paper logs. Once we saw the honest number, the loss classification pointed straight at three availability failure modes on the hot mill roughing stand. Six months in, we're at 74% for real, and the crews argue about OEE at shift handover the way they used to argue about tonnage. The number became the shared language.
Reliability Manager · Integrated Steel Producer · Hot Rolling Mill · Central Europe
Frequently Asked Questions
Is 85% OEE realistic for a steel plant?
85% is achievable but rare — only about 3% of manufacturers globally sustain it consistently, and steel faces harder availability constraints than most industries due to equipment intensity and thermal cycling. Top-quartile steel operations reach the 80% band. A realistic 12-month target from a 65% baseline is 73-79%, with sustained 85% typically requiring 24-36 months of committed TPM culture.
Why does 90/90/90 only equal 73% OEE?
OEE is the multiplication of Availability × Performance × Quality. 0.90 × 0.90 × 0.90 = 0.729, or 72.9%. This is the multiplication trap — "good enough" on each factor still leaves you 12 points short of world-class. To reach 85% you need approximately 90% availability × 95% performance × 99.9% quality simultaneously.
Sign up free to see which of your three factors is the drag anchor.
How does OxMaint calculate OEE without a separate MES?
OxMaint calculates availability directly from work-order timestamps (downtime events, PM windows, breakdown response times) and can integrate performance and quality data via CSV upload, API, or connector to existing L2/L3 systems. You don't need to replace your MES or PLC — OxMaint sits alongside as the maintenance-driven OEE layer, with the free forever plan supporting unlimited work orders and unlimited users from day one.
How long before I see OEE improvement after switching from spreadsheets?
Steel facilities typically capture 4-6 percentage points of OEE gain in the first 90 days from loss identification alone — once the Six Big Losses become visible in a live dashboard, the top-3 offenders usually stand out immediately. Full 8-14 point gain lands within 12 months with disciplined PM compliance push.
Book a demo for a site-specific projection.
What's the difference between industry median and world-class benchmarks?
The industry median for integrated steel producers sits around 65%. Top-quartile reaches 80%. World-class is 85%+, based on Seiichi Nakajima's 1984 TPM benchmark of 90% availability × 95% performance × 99.9% quality. Being at the industry median isn't failure — being in the bottom quartile signals immediate improvement priority. Context matters: your own baseline and improvement trajectory are more meaningful than chasing an arbitrary number.
Can OxMaint benchmark across multiple mills and plants?
Yes. One OxMaint workspace can hold multiple mills, multiple sites, and one consolidated OEE benchmark dashboard across the whole network. SAP and Maximo can overlay as source-of-truth for asset master data while OxMaint runs the OEE calculation and benchmarking layer — giving corporate reliability leaders a single view of world-class positioning across every plant.
Do I need a credit card or CAPEX approval to start?
No. OxMaint's free forever plan requires no credit card, no CAPEX request, and no consulting engagement — you can
sign up in under 2 minutes and have your first assets and work-order stream flowing within a shift. The steel plant asset library ships with pre-built templates for hot mills, cold mills, casters, and blast furnaces, so day-one configuration is minutes, not weeks.
Turn the 85% Target Into a Live Number Every Shift Can See.
OxMaint calculates OEE, MTBF, MTTR, and PM compliance automatically from work-order data — position your plant live against 85% world-class, top-quartile, and industry median bands by line, shift, and product grade. Start free — no credit card, unlimited users, forever. Or book a demo for a site-specific OEE improvement projection.