Steel plant maintenance is where billion-dollar production schedules are won or lost — and the plants winning in 2026 treat KPIs as operating levers, not monthly slides. PM compliance below 85%, MTTR drifting past 4 hours, and availability stuck under 92% are not abstract numbers; they are the difference between a competitive cash cost per ton and an emergency shutdown that wipes out a quarter's margin. OxMaint maintenance management software gives maintenance leaders the tiered dashboards, benchmark reporting, and analytics that turn raw CMMS data into managed performance — from the technician on the caster floor to the plant manager in the Monday review. Start Free Trial and benchmark your mill against the 2026 ranges in this guide before the next outage catches you.
Four numbers decide whether your steel plant runs data-driven maintenance — or opinion-driven firefighting.
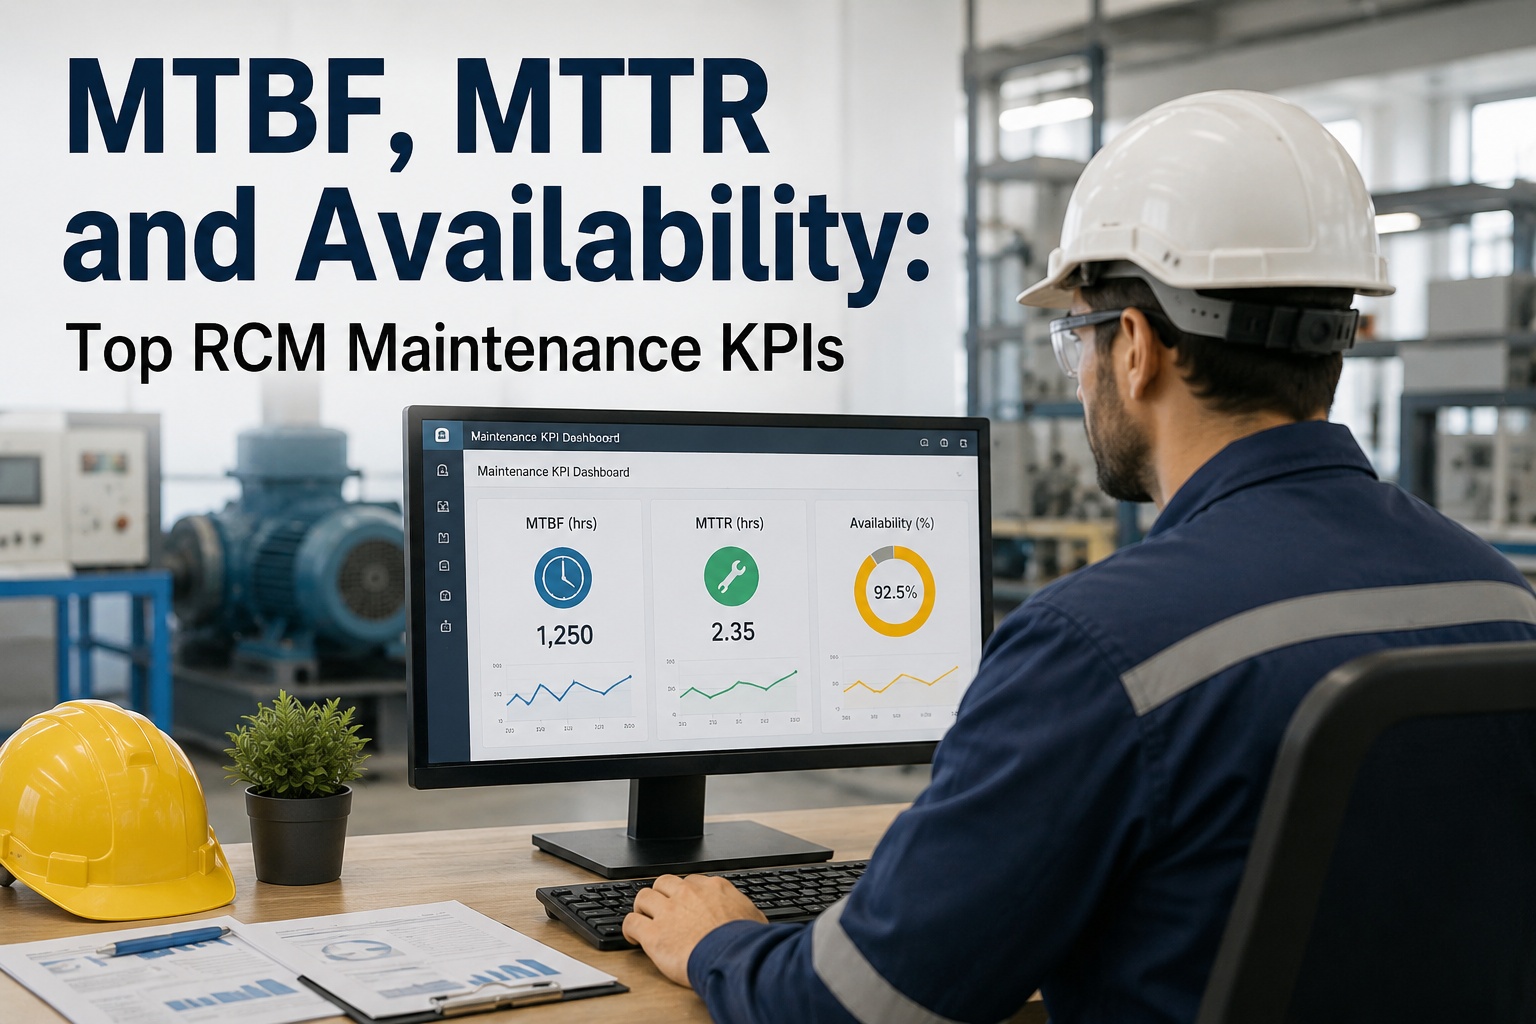
PM compliance, MTBF, MTTR and availability translate raw work-order data into reliability decisions. Plants that track them against 2026 industry ranges cut unplanned downtime 18–30% inside two quarters.
The metrics that separate managed reliability from reactive firefighting
A steel plant running 320+ days a year cannot afford maintenance that is measured by gut feel. These four KPIs — tracked consistently across cranes, casters, mills, and utilities — form the minimum reliability scorecard every plant manager should see before 8 a.m.
PM Compliance
85% – 95%
Percentage of scheduled preventive maintenance work orders completed on or before their due date. Below 85%, corrective work begins to crowd out planned work and the failure spiral accelerates. Top-quartile mills hold 92%+.
MTBF
250 – 400 hrs
Mean Time Between Failures for critical rotating assets — pumps, fans, hydraulics, roll drives. A 12-month rolling MTBF above 320 hours signals a healthy predictive layer; under 200 hours means failures are outpacing prevention.
MTTR
2.0 – 4.0 hrs
Mean Time To Repair measures the clock from failure notification to production restart. Every hour above 4 on a strand caster can cost $180K–$420K in lost throughput. Spares readiness and shift coverage are the two biggest levers.
Availability
92% – 96%
The percentage of scheduled production time the asset is actually available to run. World-class integrated mills sustain 94–96% on bottleneck equipment; anything below 90% on a primary asset is a direct margin leak.
How each KPI is calculated — and where plants get the math wrong
Miscounting "downtime" is the single most common reason benchmark comparisons fall apart. Use these standard definitions, aligned with ISO 14224 and SMRP best practice, so your numbers are defensible in front of finance.
Count only work orders closed by the original due date — not deferred-and-closed. Exclude rebuild projects; include only recurring PMs on production-critical assets.
Operating hours = scheduled run time minus planned downtime. A "failure" is any event that stops production or requires corrective intervention — not just a catastrophic breakdown.
Repair hours start at failure notification and end at production-ready handover. Include diagnostic time, parts retrieval, and re-test — excluding operator-caused delays you cannot control.
Downtime includes unplanned failures AND planned maintenance windows during scheduled production. Track separately so you know whether losses are reliability-driven or planning-driven.
2026 steel plant maintenance benchmark ranges by tier
Use this table as a quarterly scorecard. Tier-1 targets reflect integrated mills with mature TPM programs; Tier-3 reflects plants still operating reactively and losing margin to unplanned downtime every week.
| KPI | Tier-1 (World-Class) | Tier-2 (Average) | Tier-3 (Reactive) | Annual Cost Impact |
|---|---|---|---|---|
| PM Compliance | 92 – 96% | 80 – 88% | Below 75% | +$1.2M unplanned labor |
| MTBF (Critical Assets) | 350 – 400 hrs | 220 – 280 hrs | Below 150 hrs | 14 – 22 extra outages/yr |
| MTTR | 1.5 – 2.5 hrs | 3.0 – 4.5 hrs | Above 6 hrs | $220K per caster event |
| Availability (Bottleneck) | 94 – 96% | 90 – 93% | Below 88% | 8 – 14 lost production days |
| Planned : Reactive Ratio | 80 : 20 | 60 : 40 | Below 50 : 50 | 3.2× repair cost premium |
| Wrench Time | 55 – 65% | 38 – 45% | Below 30% | 22% overtime spend |
A 180-asset mill that turned four KPIs into $2.7M
A mid-sized bar mill running 180 critical assets across melt shop, continuous caster, and rolling stand was spending $42K per month on emergency contractor labor and losing 11 production days per quarter to unplanned downtime. Here is what changed in 9 months.
- 71%PM Compliance — reactive work consumed 62% of mechanic hours
- 168 hrsMTBF — strand caster failed every 7 days on average
- 5.8 hrsMTTR — spares stored off-site, no kitting
- 87%Availability — rolling mill was the plant bottleneck
- 93%PM Compliance — tiered dashboards surfaced overdue PMs daily
- 342 hrsMTBF — vibration-based PMs cut caster failures 51%
- 2.3 hrsMTTR — spares kitting and shift coverage tightened
- 94%Availability — 9 production days recovered per quarter
One KPI layer per role — from technician to plant manager
A KPI only changes behavior when the right person sees it at the right frequency. OxMaint rolls the same underlying data into three dashboard tiers so each role acts on what it can actually control.
Work-order completion & PM backlog
- Today's PM queue with due-date color coding
- Open corrective work orders by priority
- Mean wrench-time per work order type
- Parts requested vs. parts picked
Drives PM compliance from the floor up — every closed PM feeds the plant-level number within minutes, not the next morning's spreadsheet.
Failure trends & asset health
- MTBF / MTTR by asset class and criticality
- Bad-actor list — top 10 repeat failures
- PdM alarm-to-failure conversion rate
- RCFA status on open investigations
Turns week-over-week KPI movement into action — bad actors get escalated to rebuild projects before they consume the maintenance budget.
Benchmarks & cost-of-unreliability
- Availability vs. 2026 Tier-1 benchmark by area
- Planned-to-reactive ratio trend (12-month)
- Downtime cost in dollars, not just hours
- Maintenance cost as % of asset replacement value
The one screen that ends opinion-driven maintenance — every number ties back to a defensible benchmark and a dollar figure finance can audit.
Stop debating maintenance performance in Monday meetings. Start managing it.
OxMaint turns your existing work-order data into PM compliance, MTBF, MTTR and availability dashboards — tiered for every role, benchmarked against 2026 steel industry ranges, and live within weeks.
Steel plant maintenance KPI questions, answered
What is a good PM compliance target for a steel plant in 2026?
World-class integrated mills hold PM compliance between 92% and 96% on critical assets. Below 85%, corrective work begins to crowd out planned work and the failure spiral accelerates. The key is measuring only recurring PMs closed on or before their due date — not deferred work counted as complete. OxMaint enforces this definition automatically so the number is defensible in front of finance and operations.
How is MTBF calculated for critical steel plant assets?
MTBF = total operating hours divided by the number of failures in that period. Operating hours exclude planned downtime, and a "failure" is any event that stops production or requires corrective intervention — not just a catastrophic breakdown. For a strand caster running 320 hours between failures, a 12-month rolling MTBF above 320 hours indicates a healthy predictive layer. You can Start Free Trial and OxMaint will calculate it automatically from your existing work-order history.
What does MTTR really cost a steel plant per hour?
On a continuous strand caster, unplanned downtime typically costs $180K–$420K per hour in lost throughput, plus contractor labor and emergency spares. MTTR above 4 hours usually signals a spares-readiness or shift-coverage problem rather than a repair-skill problem. Kitting parts before the failure notification and pre-staging tooling can cut MTTR by 40–60% without adding headcount.
How quickly can a steel plant see measurable KPI improvement?
Plants that deploy OxMaint tiered dashboards and enforce daily PM-completion visibility typically see PM compliance climb 8–12 points within 60 days, and MTBF improvements on critical assets within one full failure cycle (90–120 days). Availability gains lag by one quarter because they depend on PM compliance and MTBF compounding first.
Do these benchmarks apply to mini-mills and integrated mills equally?
The four core KPIs apply to both, but the targets shift. Integrated mills with blast furnaces and coke batteries face longer failure cycles and higher consequence per event, so MTBF targets run higher and MTTR tolerance is tighter. Mini-mills with EAFs and casters see faster cycles and can sustain higher PM compliance because the asset base is smaller. OxMaint lets you set benchmarks per asset class, not just per plant. To map your asset hierarchy, Book a Demo.
See where your mill ranks against 2026 steel maintenance benchmarks.
Deploy OxMaint in weeks, not quarters. Tiered dashboards from technician to plant manager, benchmark reporting, and the analytics that make every KPI continuously actionable.
Free 14-day trial · No credit card