Every airport maintenance director inherits a backlog. Two thousand open work orders, some tagged P1, most not tagged at all, oldest one from 14 months ago, and no one still on the team remembers what it was for. Research shows airports running a backlog above 10% of their total work-order volume see roughly twice as many emergency failures as peers — because a real backlog isn't a to-do list, it's a lagging indicator of understaffing, poor scheduling and parts-delay compounding. This guide is a practical 12-month cleanup plan: how to age & risk-tag every open work order, level capacity against the queue, and burn the backlog down on a chart your executive team will actually read. Every step is one your team can run in OXMAINT AI, the CMMS software that ties aging, risk, capacity and burn-down together on one dashboard.
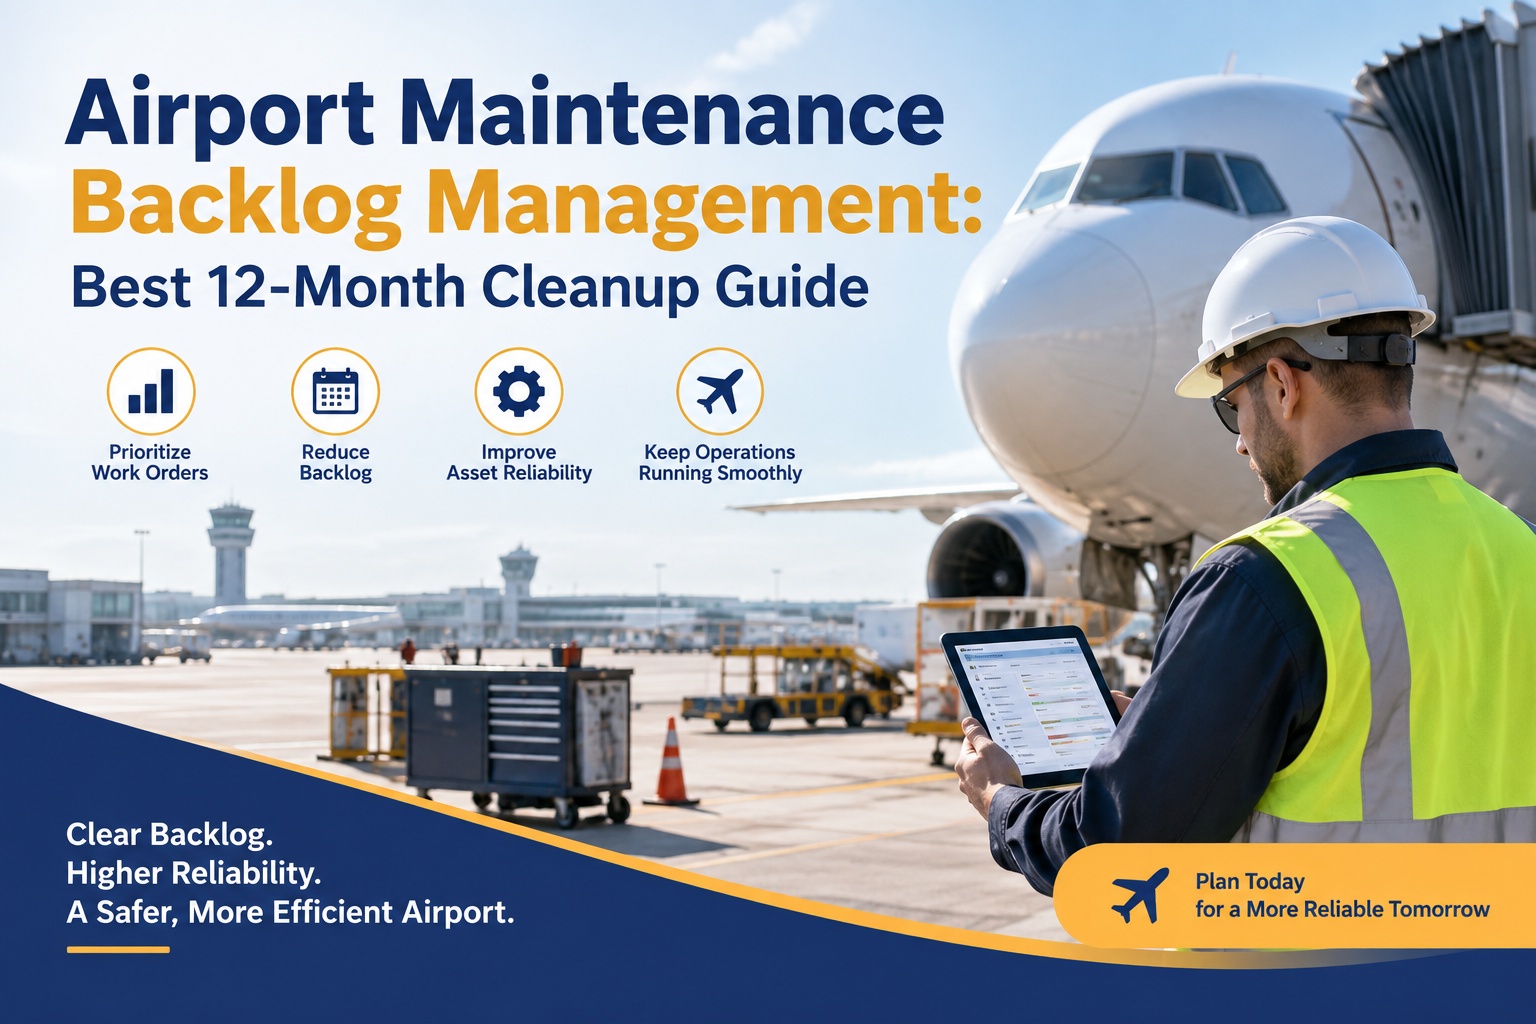
Airport Maintenance Backlog Management: Best 12-Month Cleanup Guide
Turn a bloated work-order queue into a governed backlog — with aging bands, risk-tagged priority, capacity leveling & a monthly burn-down chart. OXMAINT AI, an AI-powered CMMS, connects the whole cleanup workflow so every open WO has an age, a risk score, an owner and a target close date.
Why "Just Work Through It" Never Cleans a Backlog
Every airport maintenance team has tried the same thing: allocate a Friday afternoon, work down the oldest tickets, feel good for a week. Two months later the queue is bigger than it was. That's because backlog isn't a list of tasks — it's a flow imbalance between new work coming in and closed work going out, layered with aging, risk and capacity constraints. Cleaning it takes a governed process, not a heroic afternoon. Sign up free and see your backlog as a governed queue in OXMAINT AI.
Step 1 — Age Every Open Work Order
Before you triage or plan, you need to know the shape of the queue. That means putting every open work order into an aging band — the same way finance teams age receivables. Four bands, each with its own escalation protocol. In OXMAINT AI the aging is calculated live off the work-order created date and refreshed on every dashboard load. Book a demo to see your aging bands live on a real backlog.
Step 2 — Risk-Tag Every Work Order With P1 / P2 / P3
Age tells you how long a WO has been open. Risk tells you how much it matters. The two together are what governs which work goes to the top of tomorrow's schedule. Every open work order needs a priority tag — assigned at creation, revisited on aging. The P1-to-total ratio is the single most-watched number on any airport backlog dashboard. Sign up free and start priority-tagging every open WO in OXMAINT AI.
The Risk-vs-Age Matrix — Where the Real Fires Live
Plot every open work order on a 3×4 matrix — priority on one axis, aging band on the other — and the backlog stops being a wall of tickets and becomes a map. The top-right corner (aged + high-risk) is where post-incident reviews come from. This is the single most important visualization in a backlog governance program. Book a demo to see your matrix on a real dataset.
A Backlog Without Governance Is a Risk Register in Disguise.
Every un-tagged, un-aged, un-owned work order in your queue is a small risk sitting on the balance sheet. OXMAINT AI closes that gap: aging bands calculated live, priority tags enforced at creation, capacity leveled against real technician availability, and burn-down charts drawn from the work-order stream itself.
Step 3 — Level Capacity Against the Queue
A backlog is a flow problem. Every week, X new work orders arrive; Y get closed. If Y is smaller than X, the backlog grows regardless of how hard the team works. Capacity leveling is the discipline of matching scheduled work to actual technician-hours available — with P1s slotted first, P2s next, and P3s only when there's genuine slack. In OXMAINT AI the leveling view shows scheduled hours vs available hours by shift & trade. Sign up free and open the capacity view on your fleet.
Step 4 — Draw the Monthly Burn-Down Chart
A burn-down chart is what turns a maintenance conversation into an executive conversation. One line: total open work orders, month by month, with the target line running underneath. If the actual curve stays above the target, your governance isn't working — no matter how good the anecdotes are. Here's the shape a healthy 12-month cleanup looks like. Book a demo to see your actual burn-down against target.
The 12-Month Cleanup Schedule
Four quarters, four outcomes. Each stage builds on the last — you can't level capacity until you've aged the queue, and you can't burn down against target until capacity is leveled. Here's the quarter-by-quarter plan OXMAINT AI runs airport teams through. Sign up free and start Quarter 1 with your live queue today.
The 5 Backlog KPIs Every Airport Should Track
You can't govern what you don't measure. These are the five backlog KPIs that turn a maintenance metric into an operating one — the numbers a maintenance director should be able to answer on a phone call from the CFO. Each one is auto-calculated in OXMAINT AI from work-order data your team is already entering. Book a demo to see these KPIs on your live queue.
What OXMAINT AI Gives an Airport Maintenance Leader
OXMAINT AI runs the whole backlog governance loop — aging, risk tagging, capacity leveling, burn-down & KPIs — on the same platform where the work orders themselves live. No exports, no spreadsheets, no drift between systems. Sign up free and start the governance loop this week.
When I took the role, we had roughly two thousand open work orders and no one could tell me how many were P1s or how old the oldest was. Three months in, we'd tagged everything, aged everything, and closed or cancelled about four hundred that shouldn't have been on the list at all. The moment that changed the executive conversation was the first burn-down chart — one line, twelve months, target line underneath. It stopped being "maintenance is behind" and started being "we're on plan." Nine months later we're near target, and the P1-over-30-day cell on the matrix is empty for the first time anyone remembers.
Frequently Asked Questions
Age It, Tag It, Level It, Burn It Down.
Turn a bloated queue into a governed backlog with OXMAINT AI — every work order aged into a band, risk-tagged P1/P2/P3, leveled against real capacity, and tracked on a burn-down chart the executive team actually reads. Start free — no credit card, unlimited users.