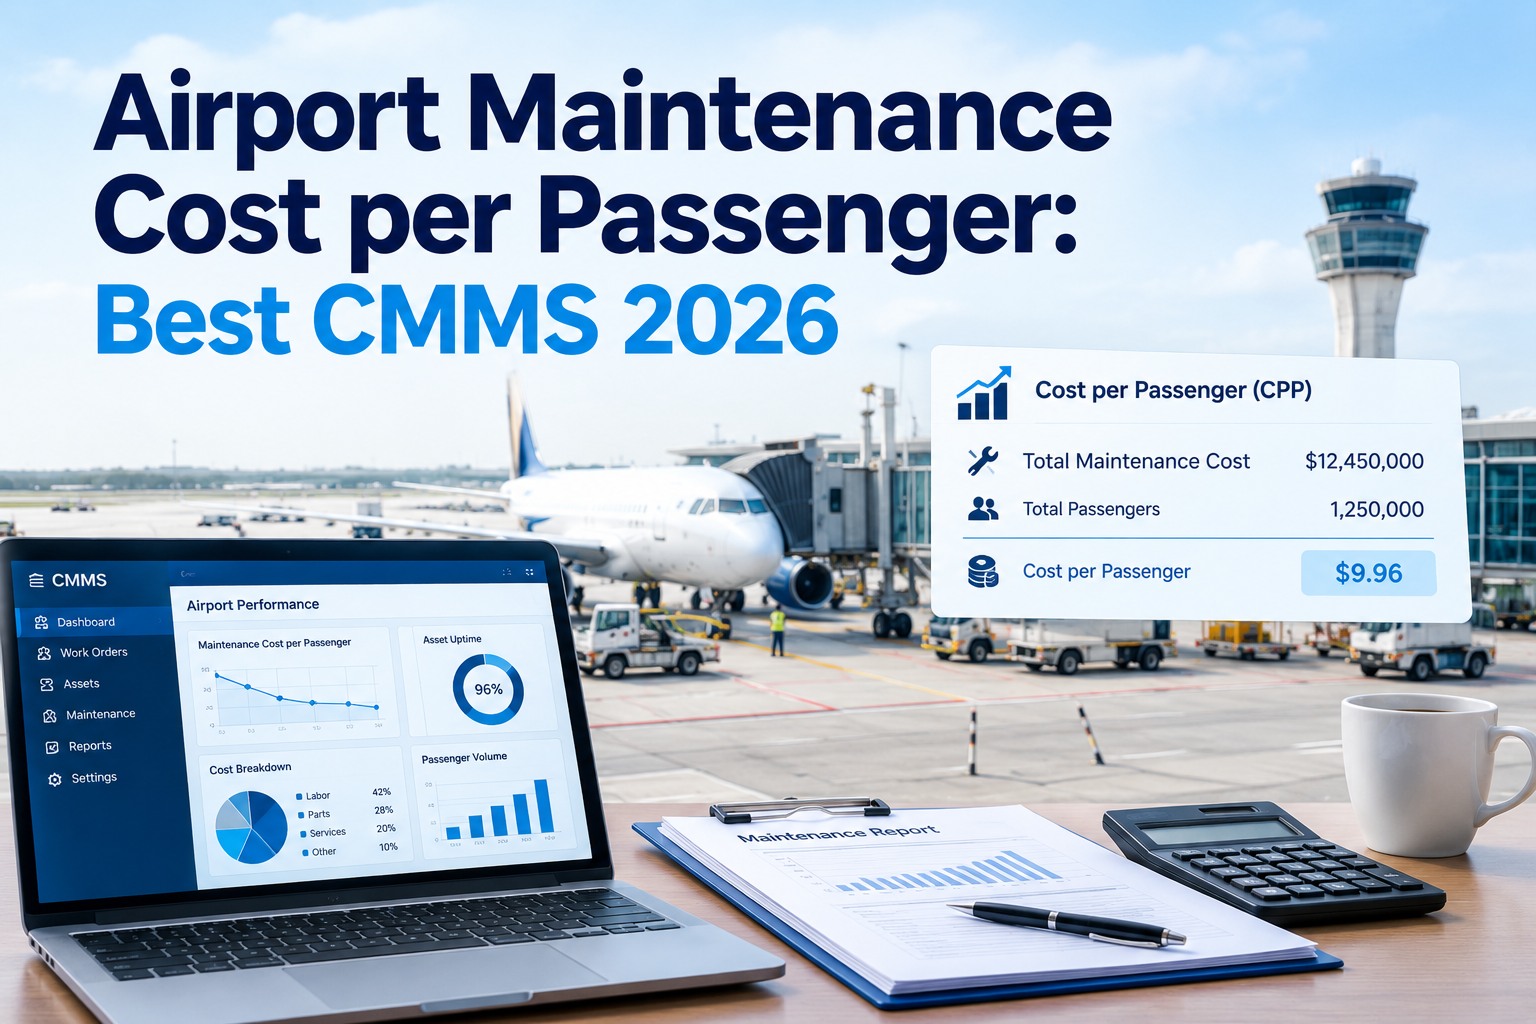
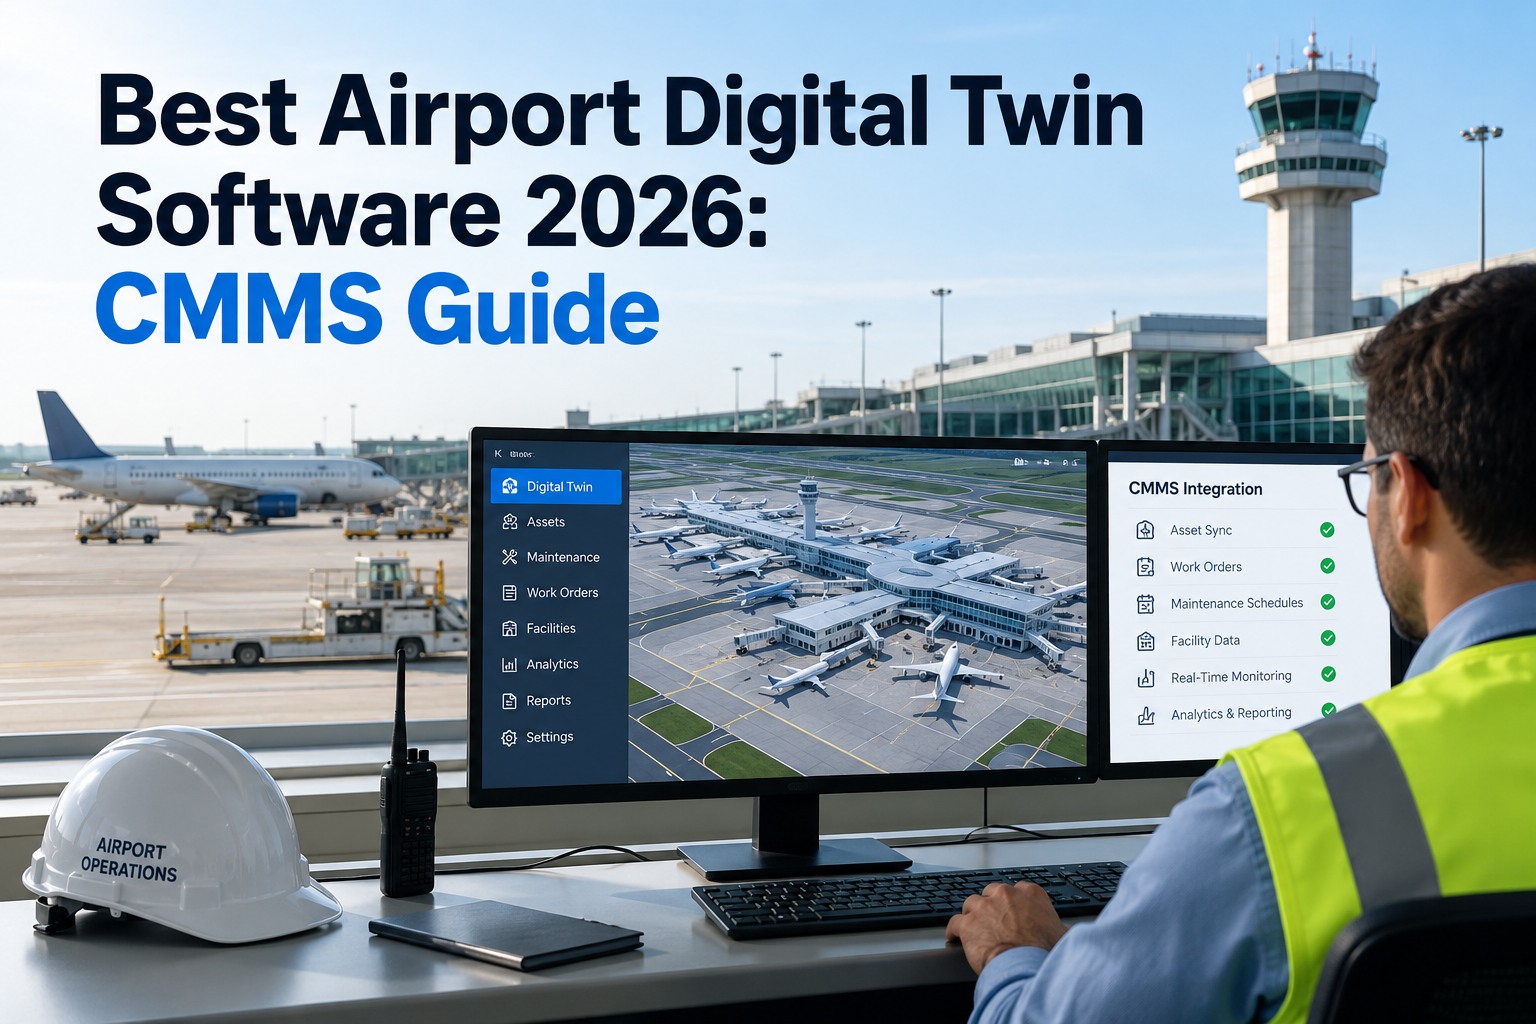
Cost per passenger (CPP) is the one maintenance metric an airport CFO, a board, and a benchmarking body all understand at a glance — total maintenance spend divided by passengers handled. It's also the metric most airports quote and can't defend. When finance asks "why is our CPP higher than the airport down the coast?", the honest answer is usually a shrug, because the number was pulled from a spreadsheet that can't trace a single rupee, dollar, or euro back to an asset, a work order, and a reason. CPP done right is the difference between a budget conversation and a budget defence. This 2026 guide shows how to calculate, benchmark and actually use maintenance cost per passenger — and where OxMaint's maintenance management software makes every figure behind it traceable and CFO-ready.
Aviation · Benchmarking · Cost per Passenger · CMMS Guide 2026
Airport Maintenance Cost per Passenger & Best Benchmark CMMS
A CPP number is only as good as the data underneath it. Learn to calculate it correctly, compare it fairly, and defend every figure — then run it on a CMMS that traces each cost back to an asset and a work order.
1 number
the metric every CFO, board and benchmark body understands instantly
4 traps
that make a CPP comparison misleading or indefensible
3 layers
of drill-down a defensible CPP needs behind the headline figure
100%
traceable spend — the standard that turns a debate into a data conversation
Why Most CPP Numbers Fall Apart Under Questioning
CPP fails as a management tool not because the formula is wrong, but because the numerator is a black box. Four traps turn a clean-looking metric into one you can't stand behind in a budget review. Sign up free and OxMaint closes all four by tying every cost to a source you can point to.
Trap 1
Untraceable spend
The total is a ledger sum nobody can break down. When finance asks "spent on what?", there's no answer below the line item.
Trap 2
Apples-to-oranges scope
Your CPP includes contractor labor and capital projects; the airport you're compared to doesn't. The gap is definition, not performance.
Trap 3
Wrong denominator
Enplanements, total passengers, or workload units? A cargo-heavy or transfer-heavy hub looks artificially expensive on raw passenger count.
Trap 4
No drill-down
A single headline number with nothing behind it. You can report the CPP but you can't explain, forecast, or act on it.
The Three Layers of a Defensible CPP
A benchmark you can defend isn't one number — it's a headline figure that drills down into three progressively sharper layers. The headline starts the conversation; the layers below win it. Book a demo to see the full drill-down on your data.
Headline
Total maintenance cost per passenger
The board-level figure. Useful for trend and peer comparison — but only credible if you can open it up.
Layer 1
By category — labor, parts, contractor, PM vs. reactive
Splits the number into cost types, so a high CPP is instantly explained as "reactive-heavy" or "contractor-heavy" — an actionable diagnosis.
Layer 2
By asset class — HVAC, baggage, bridges, lighting, GSE
Shows which asset families drive the cost, pointing directly at where reliability investment lowers CPP most.
Layer 3
By individual asset & work order
The bottom of the stack: every euro traced to one chiller, one work order, one business reason. This is the layer that ends the debate.
You Can't Drill Into a Spreadsheet Total.
A CPP built from a monthly ledger export stops at the headline — there's nothing to click into. That's why the number wins nothing in a budget review. When every cost is logged against an asset and a work order from the start, the three layers already exist; you just open them. OxMaint captures spend at the source, so a defensible CPP isn't a year-end reconstruction — it's a live query.
How to Benchmark CPP Fairly
Comparing your CPP to another airport's is worthless unless you normalize the definition first. Get these five agreements right and the comparison becomes a genuine performance signal instead of a definitional artefact. Start free and standardize your scope from day one.
01
Fix the cost scope
Agree what's in: in-house labor, contractors, parts, PM, capital? Both sides must count the same things.
02
Pick one denominator
Enplaned passengers, total passengers, or a workload unit — chosen for the traffic mix, and used consistently.
03
Normalize for climate & age
A 40-year-old terminal in a harsh climate will cost more per passenger — context the raw number hides.
04
Separate capital from operating
A big refurbishment year spikes CPP. Report operating CPP and capital CPP separately so trends stay readable.
05
Trend before you compare
Your own CPP over time is the most honest benchmark. Direction matters more than a single peer snapshot.
Spreadsheet CPP vs. OxMaint CPP
The metric is identical; the defensibility is not. Here's the same cost-per-passenger figure produced two ways — and why only one survives a CFO's follow-up question. Book a demo to see the traceable version.
How OxMaint Makes CPP Defensible
A defensible cost-per-passenger metric isn't a report you build once a year — it's a by-product of logging maintenance properly all year. Here's what turns the headline figure into a number your CFO trusts. Sign up free to build it on your own assets.
Cost Captured at the Source
Labor hours, parts and contractor spend log against the work order and asset as work happens — no year-end reconstruction.
Category & Asset-Class Roll-Up
The same data rolls up into CPP by cost type and asset family, so the headline number opens into its three layers instantly.
PM vs. Reactive Split
See how much of your CPP is planned versus firefighting — the single clearest lever for bringing the number down.
Consistent Scope & Denominator
Define what counts once and apply it every period, so trends and peer comparisons stay honest and repeatable.
Trend Dashboards
Track CPP over months and years, separating operating from capital so a refurb year doesn't distort the story.
CFO-Ready Export
Every figure exports with its drill-down intact — the evidence pack that turns a budget debate into a data conversation.
"
Our cost per passenger was 30% above a peer airport and the board wanted answers I didn't have — the number came off a spreadsheet I couldn't break apart. Once we ran maintenance through OxMaint, I could show them exactly what the gap was: we were carrying two aging baggage systems on reactive repairs while the peer had replaced theirs. The high CPP wasn't waste, it was deferred capital, and now I had the asset-level data to prove it and justify the replacement. The budget meeting went from me defending a number to us deciding on an investment.
Head of Facilities & Maintenance · International Airport
Frequently Asked Questions
What is a good maintenance cost per passenger for an airport?
There's no universal target — it varies with terminal age, climate, traffic mix and what's included in scope. The useful benchmark is your own CPP trend over time, plus fairly-normalized peer comparison. Direction beats a single number.
Should CPP include capital projects?
Report them separately. A major refurbishment spikes CPP and distorts the trend, so keep operating CPP and capital CPP on distinct lines — that keeps the operating number readable and the capital case clear.
Why do peer CPP comparisons often mislead?
Because the definitions rarely match — different cost scope, different denominator, different terminal age and climate. Normalize scope and denominator first; otherwise you're comparing definitions, not performance.
How do I lower cost per passenger without cutting corners?
Shift spend from reactive to planned maintenance and target the asset classes driving the most cost. Both require asset-level data — which is exactly what a CMMS captures and a spreadsheet can't.
How does OxMaint make CPP defensible?
It captures every cost against an asset and work order, then rolls it up by category, asset class and individual unit — so the headline figure drills all the way down to a business reason.
Sign up free to build it.
Turn the Budget Debate Into a Data Conversation.
Use this guide plus OxMaint to build a maintenance budget your CFO trusts — every rupee, dollar or euro traceable to an asset, a work order and a reason, and a cost-per-passenger metric you can defend line by line. Start free — no credit card, unlimited users, forever.