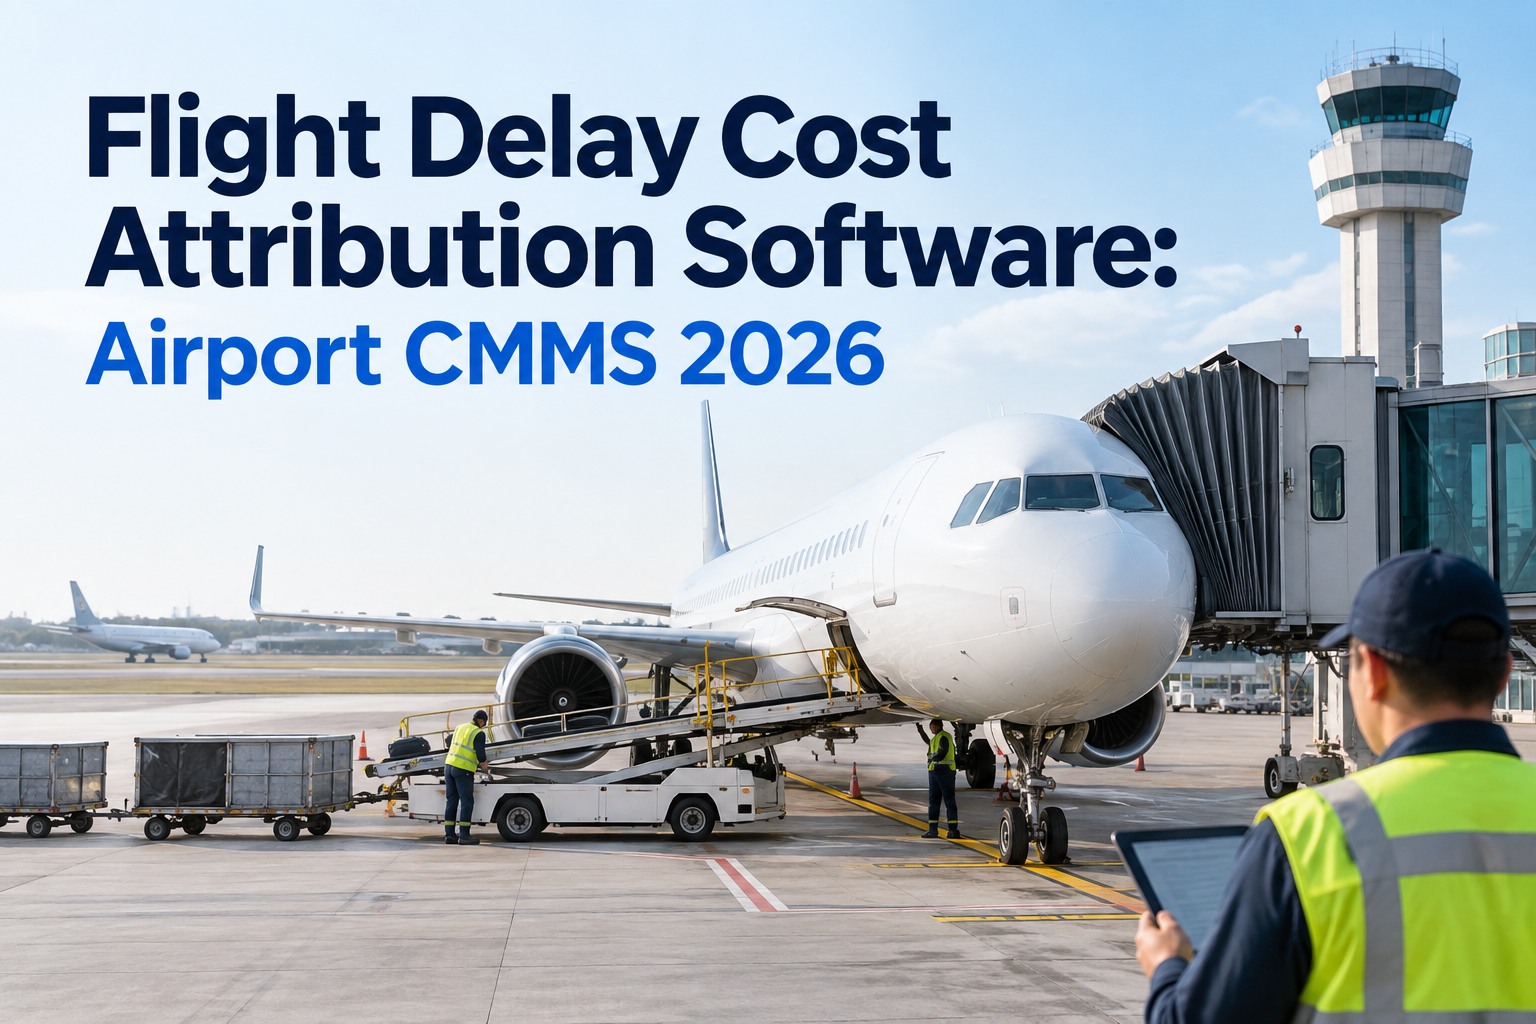
A jet bridge fails, the flight sits 40 minutes past pushback, and by Monday morning three different numbers are floating around for what that delay actually cost — one from ops, one from finance, one from the airline's invoice. None of them agree, because none of them were built from the same data. When a regulator, airline partner, or your own board asks "what did maintenance-driven delays cost us this quarter," a guess isn't an answer — it's a liability. Delay cost attribution means tying every maintenance-caused delay minute back to a specific asset, failure mode, and dollar figure that finance, ops, and airlines can all agree on. This guide covers what actually drives delay cost, the attribution model a defensible number is built from, and what the best 2026 airport CMMS platforms do to make the math automatic. Book a free delay-cost attribution review against your last quarter's incidents.
Every Delay Has a Cost. Most Airports Can't Name It.
Without asset-level attribution, delay cost is a guess dressed up as a number.
3 Ledgers
Ops, finance, and the airline invoice — rarely agreeing on the same delay figure
Per Minute
The unit real attribution runs on — not per incident, not per quarter
Asset-Level
Where the cost has to attach for a budget request to be defensible
Who Actually Pays for a Maintenance Delay?
A single delayed jet bridge doesn't produce one cost — it produces several, landing on different ledgers, which is exactly why the number gets disputed instead of trusted.
The Airport
Labor, parts, and emergency contractor spend to fix the asset — plus gate-hold and rebooking coordination costs.
The Airline
Crew overtime, downstream schedule disruption, and passenger compensation triggered by the same 40 minutes.
The Passenger
Missed connections and satisfaction scores — the cost that doesn't show on an invoice but shows up in ASQ data.
The Five Inputs a Real Attribution Model Needs
An attribution number is only as defensible as the data behind it. Skip any of these five, and the figure becomes a negotiation instead of a fact.
01
Failure Timestamp to Resolution
The exact minute the asset failed and the exact minute it returned to service — the raw duration everything else is calculated from.
02
Linked Flight Impact
Which specific flights sat idle because of this asset, not an estimate of "delays that day" across the terminal.
03
Labor & Parts Cost
Actual technician hours and part cost logged against the work order — not an average repair cost applied after the fact.
04
Failure Mode Classification
Was it wear, a missed PM, a parts failure, or vendor error? The mode decides who's accountable for the cost, not just what it was.
05
Per-Minute Delay Rate
A standardized cost-per-minute figure — applied consistently, so every incident rolls up on the same basis finance can audit.
Run Your Last Quarter Through the Model
Bring your delay incidents from the last quarter — we'll show what a full asset-level attribution report would have looked like.
From Failure to Defensible Number
Attribution isn't a spreadsheet exercise done at quarter-end — it's a calculation that should start the second an asset goes down.
1
Asset Fails. The work order captures the exact failure timestamp and links it to the affected gate or system automatically.
2
Flights Linked. Affected flights are matched against the failure window, tying real schedule impact to the incident.
3
Cost Calculated. Labor, parts, and delay-minute rate roll up into one attributed cost, tagged to the asset and failure mode.
4
Reported Out. The figure rolls into a standard report finance, ops, and airline partners can all reference from the same source.
Estimated vs. Attributed Delay Cost
Most airports already have a delay cost number. The question is whether it was calculated or assumed.
Estimated (Spreadsheet)
One average cost-per-delay applied to every incident
No link between the asset and the specific flights affected
Labor and parts cost approximated after the fact
Different teams cite different totals for the same event
Attributed (CMMS-Calculated)
Cost calculated per incident from real timestamps
Affected flights matched directly to the failure window
Actual labor and parts cost pulled from the work order
One report every team references — no dispute over the number
How Oxmaint Builds Delay Cost Attribution
Oxmaint captures the data delay attribution depends on automatically — at the moment of failure, not reconstructed weeks later for a board meeting.
Automatic Downtime Capture
Failure and resolution timestamps logged the instant a work order opens and closes — no manual entry, no rounding.
Real Labor & Parts Cost
Actual technician hours and parts used roll up against the asset, not an averaged repair estimate.
Failure Mode Tagging
Every incident classified by cause, so cost rolls up by failure mode as well as by asset.
Standardized Cost Reports
Cost-per-asset, cost-per-failure-mode, and delay-attribution reports built on one consistent basis every team can cite.
Stop Defending Guesses. Start Defending Numbers.
See how Oxmaint turns every maintenance-driven delay into an asset-level cost figure finance, ops, and airline partners can all trust. Free forever plan available.
Frequently Asked Questions
What is flight delay cost attribution?
Delay cost attribution is the practice of tying every maintenance-caused delay minute back to a specific asset, failure mode, and dollar figure, rather than reporting a single averaged delay cost across the airport. It matches the exact failure and resolution timestamps of an asset to the flights affected during that window, then calculates the real labor, parts, and downtime cost tied to that specific incident. The result is a number that ops, finance, and airline partners can all reference from the same source instead of disputing separate estimates.
Book a review to see it against your own incidents.
Why do airports, airlines, and finance disagree on delay costs?
Because each side is usually working from a different data source — ops tracks operational impact, finance tracks invoiced spend, and airlines calculate their own downstream disruption cost. Without a shared, asset-level attribution model built on the same timestamps and cost inputs, there's no common number to reconcile against, so every conversation starts as a negotiation instead of a review of agreed facts.
What data does a defensible delay cost model require?
Five things at minimum: the precise failure-to-resolution timestamp, the specific flights linked to that failure window, actual labor and parts cost from the work order, a failure mode classification explaining the cause, and a standardized per-minute delay rate applied consistently across every incident. Missing any of these turns the final figure into an estimate rather than an auditable number.
How is attributed cost different from an average delay estimate?
An average estimate applies one flat cost-per-delay figure to every incident regardless of what actually happened, which is quick but indefensible under scrutiny. Attributed cost is calculated per incident from real data — the specific asset, the specific flights affected, and the actual labor and parts spent — so the total for any period is a sum of verifiable events rather than a multiplication of an assumption.
Does Oxmaint support delay cost attribution for airports?
Yes. Oxmaint automatically captures failure and resolution timestamps, logs real labor and parts cost against each work order, classifies failure modes, and rolls the data into standardized cost-per-asset and cost-per-failure-mode reports that finance and operations teams can use directly in budget and board conversations. A free forever plan is available to trial the full workflow.
Sign up free and run your first attribution report.