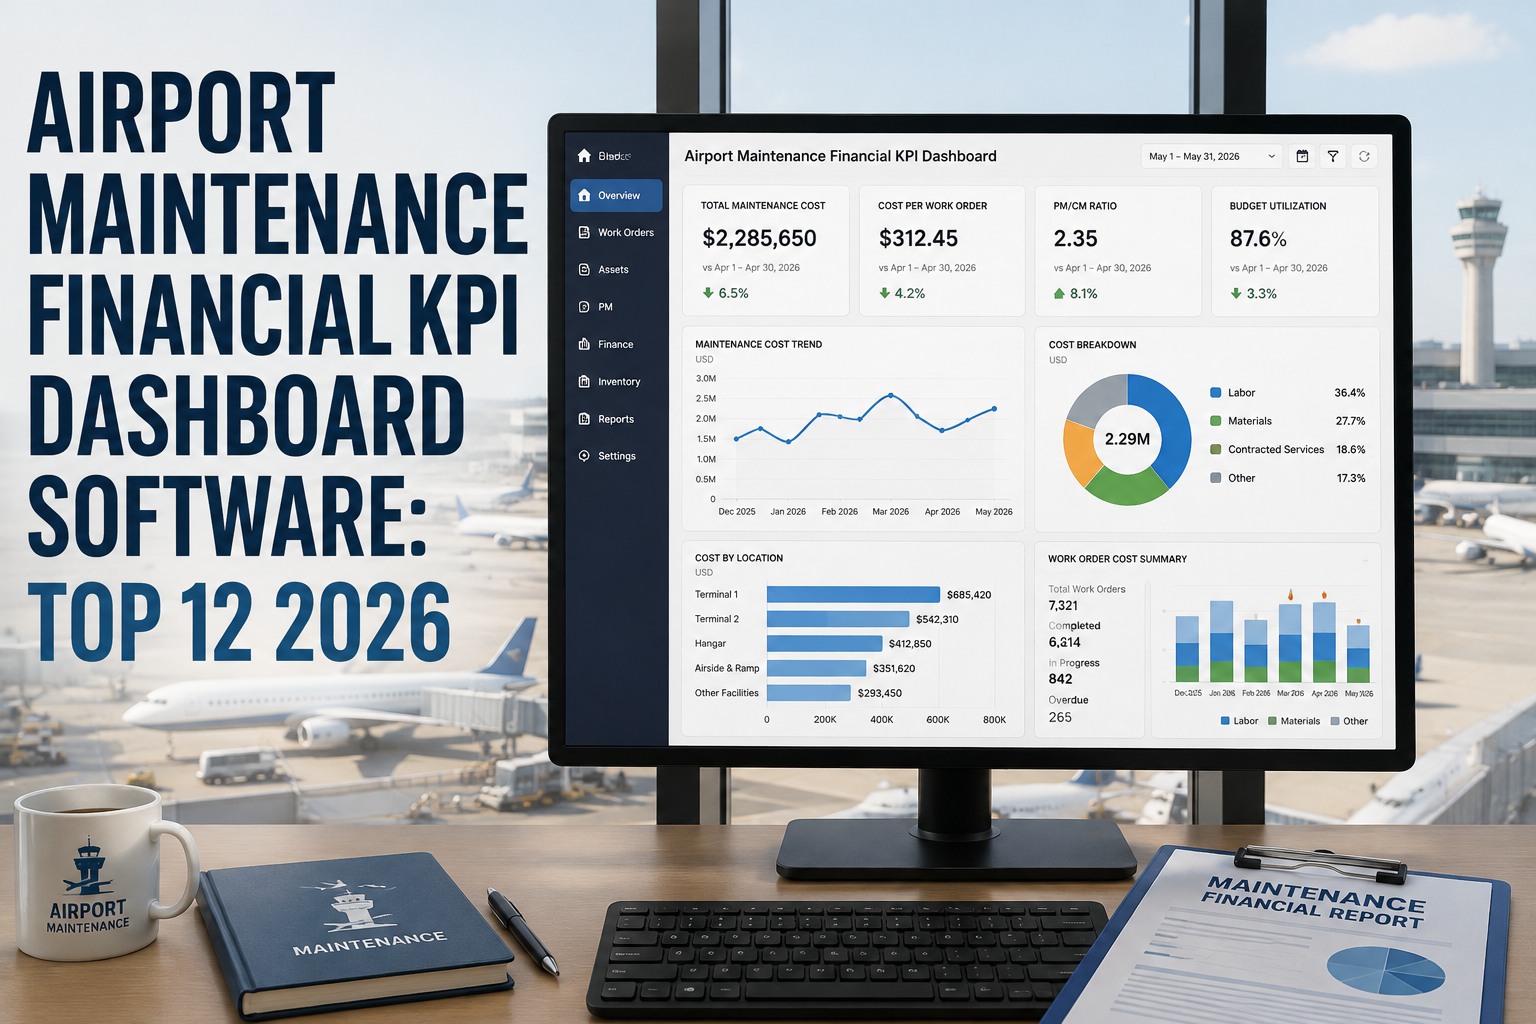
Airport maintenance budgets are where finance and engineering usually stop agreeing — finance sees a $37,377-per-violation-per-day FAA regulatory ceiling and a $3.1B annual aging-fleet cost overhang, engineering sees deferred PMs cascading into emergency work carrying 15-30% cost premiums. The financial KPI dashboard is where the two sides meet on the same numbers. The world-class benchmark is Maintenance Cost as Percent of RAV at 2-3% (reactive/firefighting operations run 4-6%), PM compliance above 80% (below is a red flag), PM-to-CM ratio at 80/20 planned-versus-unplanned, wrench time above the 25-35% industry average, and parts spend below 35% of total (above signals poor PM scheduling driving reactive purchases at emergency premium). The problem is not the KPI definitions — it is the data. Labour, parts, contractor, and downtime cost captured against every asset, rolled into cost-per-asset, cost-per-failure-mode, and cost-per-passenger reports live enough for budget season. Below is the working guide — the six financial KPIs airport engineering and finance align on, the RAV benchmark bands, the PM/CM ratio target evolution, and the cost-capture architecture Oxmaint uses to build the numbers automatically. Start free or book a demo.
Aviation · Airport Ops · Finance-Engineering Alignment · 2026
Airport Maintenance Financial KPI Dashboard Software: Top 12 in 2026
The six financial KPIs airport engineering and finance align on, RAV benchmark bands, PM/CM ratio targets, and the cost-capture architecture that turns every work order into asset-level cost data — live enough for budget season and defensible enough for the CFO.
-
2-3%
world-class Maintenance Cost / RAV target
-
80/20
target PM-to-CM planned-vs-reactive ratio
-
$37,377
FAA penalty ceiling per violation per day
-
3.3x
more downtime at reactive-heavy airports
The Six KPIs
The Financial Metrics Finance and Engineering Both Sign Off On
Below are the six financial KPIs that turn airport maintenance from a spending line into a performance-managed function. Each with the target band, what it actually measures, and why finance cares.
Maintenance Cost / RAV
Total annual maintenance spend divided by Replacement Asset Value. The single cleanest cross-airport benchmark. Above 4% signals reactive spend eating the budget; below 2% often signals deferred maintenance accumulating silently.
PM / CM Ratio
Planned maintenance hours as share of total. 80/20 planned-to-reactive is the industry target — reactive-heavy operations pay 15-30% emergency premium on every parts order and produce 3.3x more downtime than proactive operations.
PM Compliance Rate
Completed on-time PMs divided by scheduled. Below 80% is a red flag — every skipped PM increases FAA regulatory exposure ($37,377/violation/day) and seeds emergency repairs 8-12 weeks out.
Wrench Time
Hands-on repair hours divided by paid hours. Industry average 25-35% — every point above lifts effective capacity without new headcount. Below 25% signals parts-hunting, travel, or wait-for-equipment losses.
Parts Spend Share
Parts cost divided by total maintenance spend. Above 35% signals reactive purchases at emergency premium and poor PM scheduling. Below 35% with high PM compliance is the healthy pattern.
Cost per WO
Total maintenance cost divided by completed work orders. The unit-economic view finance uses to compare terminals, crews, and asset classes. Trend matters more than absolute — direction over 6-12 months is the signal.
RAV Benchmark Bands
Where Your Airport Sits — 2-3% or 5%?
Maintenance Cost as Percent of Replacement Asset Value is the primary cross-airport benchmark. Below is the working band structure — what each range signals about the underlying maintenance culture.
| Band | MC / RAV | Operational Reality | What Finance Sees |
|---|---|---|---|
| Deferred / Underspend | < 2% | PMs skipped, backlog accumulating silently, failures forming | False savings — reactive spike coming |
| World-Class | 2 – 3% | Reliability engineered, PM compliance high, spare parts optimised | Predictable · budget-defensible |
| Average | 3 – 5% | Mixed PM/reactive, backlog trending up, deferred capex on assets | Room to improve · 24-36 mo programme |
| Firefighting | 4 – 6%+ | Emergency premium on every part, wrench time low, morale worse | Budget stress · repair-vs-replace calls |
The Cost-Capture Architecture
Labour + Parts + Contractor + Downtime to Every Asset, Every WO, Automatically
The KPIs only work if the underlying cost data is captured cleanly. Oxmaint attaches four cost dimensions to every work order — labour hours × rate, parts issued at unit cost, contractor invoice, and downtime hours × cost-per-hour for the asset — and rolls them into cost-per-asset, cost-per-failure-mode, cost-per-passenger, and MC/RAV reports live. Budget season stops running on year-old spreadsheets.
PM / CM Evolution
The Ratio Curve — Firefighting to Engineered Reliability
The PM/CM ratio is the operational metric that most directly moves the financial ones. Below is the working three-stage evolution — where most airports actually start, the middle band, and the world-class target.
Firefighting
Reactive-dominant. Every day is triage. Parts ordered at 15-30% emergency premium. PM compliance below 60%. MC/RAV at 4-6%. Wrench time low, backlog high, morale bleeding out.
Improving
CMMS in place, PMs scheduled and mostly completed, backlog stabilising. PM compliance 70-80%. MC/RAV at 3-5%. Cost data starting to trend defensibly. Room to compound.
World-Class
Reliability engineered. RCM strategy per critical asset. PM compliance 90%+. MC/RAV at 2-3%. Wrench time above 40%. Finance and engineering aligned on the same numbers, same cadence.
Built for Airport Finance & Engineering
How Oxmaint Runs the Financial KPI Programme End to End
-
Four-Cost Capture
Labour, Parts, Contractor, Downtime per WO
Every work order captures labour hours × rate, parts at unit cost, contractor invoice, and downtime cost. Rolls into cost-per-asset, cost-per-failure-mode, and cost-per-passenger reports automatically.
-
Live MC/RAV
Percent-of-RAV Trended, Not Snapshot
Maintenance Cost as Percent of RAV computed live from actual work order spend with quarterly RAV audit adjustment for inflation and capex. Trend line finance can present at board level without spreadsheet reconciliation.
-
PM/CM Ratio Dashboard
Planned vs Reactive by Terminal & Crew
Planned-versus-reactive ratio computed per terminal zone, per crew, per asset class. Drill-down surfaces which units are pulling the ratio down and which reliability programmes are moving it up.
-
Warranty Capture
Under-Warranty Repairs Flagged Automatically
Every asset tagged with warranty coverage and expiry. Repair work orders on under-warranty assets auto-flag for warranty claim submission rather than internal cost absorption — direct budget recovery.
-
Executive Reporting
One-Click PDF/Excel to Board or Regulator
Board-ready financial KPI summaries, quarterly finance-engineering alignment packs, FAA readiness scores, and cost-per-passenger reports — all exportable to PDF/Excel with full source-data traceability.
-
Free Forever Plan
Pilot One Terminal Before Airport-Wide
Cloud-based, mobile-first. Load one terminal's assets, run four-cost capture on live work orders, and produce the first MC/RAV and PM/CM dashboards before scaling airport-wide.
Frequently Asked
Airport Financial KPI Questions
Why is MC/RAV the primary benchmark and not raw dollars?
Raw maintenance dollars are meaningless without the asset base they support. A larger airport spends more absolutely and should. Maintenance Cost as Percent of Replacement Asset Value normalises for asset base — a 2.5% MC/RAV airport is running efficiently regardless of whether the absolute number is $10M or $100M. It is also the number that maps cleanly to industry benchmark bands (2-3% world-class, 4-6% firefighting) that CFOs recognise. Start free and configure MC/RAV tracking today.
Why does below-2% MC/RAV signal a problem, not a win?
Under-spend on maintenance does not eliminate the underlying need — it defers it. Below 2% almost always means PMs are being skipped, minor findings are not being closed, and asset condition is degrading silently. The failures those PMs were preventing accumulate in the backlog and erupt as emergency repairs 8-12 weeks later, at 15-30% cost premium. Finance sees a temporary underspend and thinks efficiency — engineering sees the reactive spike forming and cannot get budget approval to prevent it. Live cost data breaks the pattern.
How is warranty capture actually measured?
Warranty capture = value of warranty-covered repairs actually claimed divided by value that could have been claimed. Airport operations regularly leave 30-50% of eligible warranty value uncaptured because the technician performing the repair does not know the asset is under warranty, submits the repair as an internal cost, and misses the claim window. Auto-flagging under-warranty assets at work-order-creation is the mechanical fix — the CMMS tells the technician before the repair runs. Book a demo to see the warranty flag workflow.
What cadence should finance and engineering review these KPIs?
Daily dashboard visibility, weekly team reviews on operational KPIs (PM compliance, backlog, wrench time), monthly management reviews on financial roll-up (MC/RAV, PM/CM ratio, cost per WO), and quarterly board-level packs with trend lines. Annual RAV audit to adjust the denominator for inflation and major capex. This cadence gives every stakeholder the horizon they need — technicians act on daily data, engineering managers on weekly, and finance on monthly and quarterly.
Is there a free plan to pilot one terminal?
Yes. Oxmaint offers a free forever plan — enough to load one terminal's asset register, run the four-cost capture on live work orders, and produce the first live MC/RAV and PM/CM dashboards for a finance-engineering review. Cloud-based, mobile-first — no server procurement to start. Sign up and pilot on one terminal today.
Six KPIs · Four-Cost Capture · Live MC/RAV · Warranty Capture
Budget Season on Live Data, Not Year-Old Spreadsheets.
Maintenance Cost as Percent of RAV trended live. PM/CM ratio computed per terminal and crew. Cost captured across labour, parts, contractor, and downtime on every work order. Warranty flagged before the repair runs. Oxmaint runs the full financial KPI programme as the data layer that finance and engineering can both defend.