Running maintenance across four airport terminals is not a coordination challenge — it is an information architecture challenge. When each terminal operates as its own data silo, the operations center is always working from a delayed, incomplete picture. Issues escalate before they are visible at the management level. KPIs are assembled from spreadsheets the day after decisions needed to be made. This case study examines how one international airport operations center transformed its approach to multi-terminal visibility by centralizing maintenance, asset, and performance data into one Oxmaint dashboard — and what changed when leadership could finally see everything in real time. Want to see this in your own environment? Start a free trial or book a demo with our airport operations team.
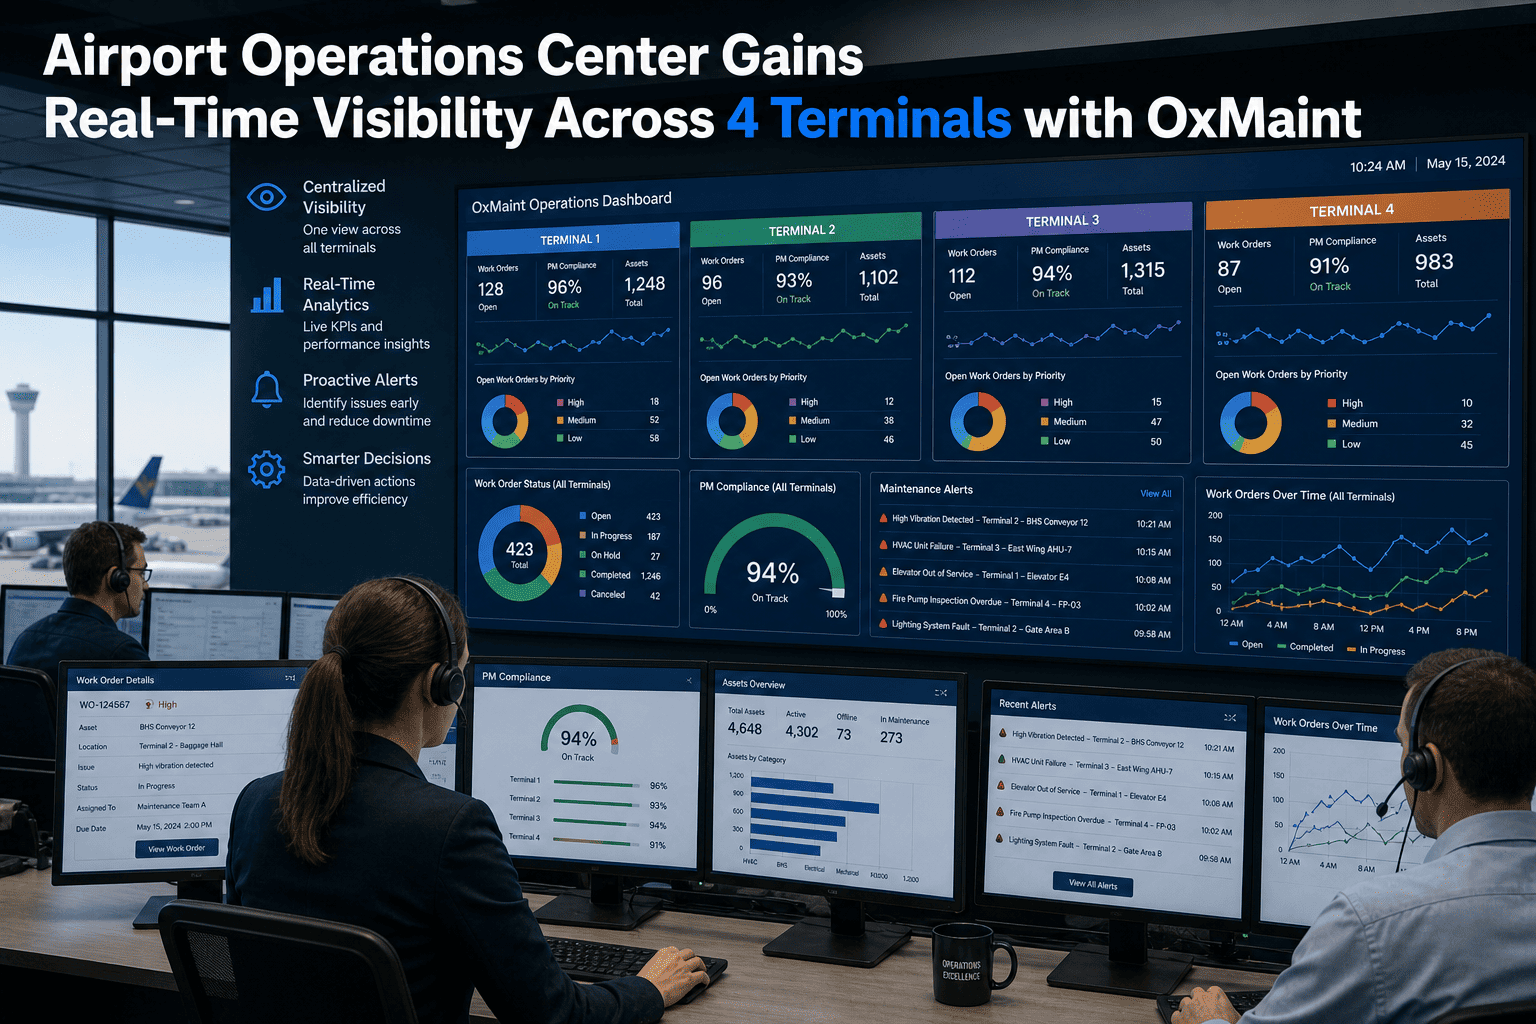
Airport Gains Real-Time Visibility Across 4 Terminals with CMMS
When four terminals operate as four separate data silos, the operations center is flying blind. This case study shows how one airport unified its maintenance, asset, and performance data into one live dashboard — and what became possible when the full picture was finally visible in real time.
Can You See All Four Terminals Right Now?
If the answer requires a phone call, a report request, or a spreadsheet — that is the problem Oxmaint solves. A centralized CMMS gives your operations center live visibility into asset status, open work orders, PM compliance, and KPI trends across every terminal, simultaneously. Start a free trial for 30 days or book a demo to see the live operations dashboard.
What Four Data Silos Actually Cost an Operations Center
The airport operated four terminals with separate maintenance teams, separate CMMS instances (or no CMMS at all in two terminals), and separate reporting cycles. The operations center director had no consolidated view of asset status, open defects, or PM compliance without requesting reports from each terminal manager — a process that took 48 hours minimum. By the time data reached the center, it was already outdated. Decisions were made on assumption, not information.
How All Four Terminals Were Unified in 90 Days
All four terminals' asset inventories were consolidated into Oxmaint's asset registry. 14,200 assets were catalogued under the Portfolio > Terminal > System > Asset hierarchy. Each asset received a condition score and maintenance history record — many for the first time.
Terminal-specific PM schedules were harmonized and loaded into Oxmaint. Where schedules differed for the same asset type across terminals, a single standard was established — eliminating the inconsistency that had made cross-terminal compliance comparisons meaningless.
All four maintenance teams were using Oxmaint for work order creation, assignment, and completion. The operations center had real-time visibility into open, in-progress, and completed work orders across all terminals simultaneously — from one dashboard screen.
Oxmaint's analytics module was configured with the airport's KPIs — PM compliance rate, mean time to repair, work order backlog, asset availability, and vendor SLA performance. The operations director could pull any KPI for any terminal, any date range, in seconds — not days.
Operations Center: Then vs Now
The 8 KPIs the Operations Center Tracks in Real Time
Percentage of scheduled preventive maintenance tasks completed on time, broken down by terminal and asset category. Target: 90%+. Current portfolio average: 92%.
Average time from fault identification to equipment returned to service. Tracked separately for reactive and planned work. Cross-terminal comparison identifies underperforming teams or systems.
Total open work orders by priority and age, across all four terminals. Aging P1 and P2 work orders trigger automatic escalation alerts to the operations center director.
Percentage of critical assets — escalators, gate equipment, HVAC, power systems — in operational status at any given time. Passenger-facing asset availability is tracked at 15-minute intervals.
The ratio of reactive work orders to planned PM work orders. Industry target for airports is 80% planned, 20% reactive. Tracking this ratio per terminal reveals where PM programs are breaking down.
Response time and completion compliance percentage for all active maintenance contractors across all terminals — updated in real time as work orders are closed and SLA timestamps are recorded.
Labor, parts, and contractor spend tracked per terminal and per asset category — enabling accurate cost allocation and identifying terminals with above-average spend that warrant investigation.
Count of assets with condition scores below the replacement threshold, aggregated across all terminals. This feeds directly into the 5-year CapEx forecast for infrastructure budget planning.
What Powers Multi-Terminal Visibility
Oxmaint's asset hierarchy — Portfolio to Terminal to System to Asset — provides a single structured registry for every asset across every terminal, with condition scores and full maintenance history per record.
The operations center dashboard updates in real time as work orders are created, assigned, and closed. No report requests, no data exports — the current operational picture is always live.
When a P1 work order ages beyond its SLA threshold, Oxmaint automatically escalates to the operations center director — removing the dependency on terminal managers to self-report problems upward.
Asset condition data from all four terminals feeds a rolling CapEx forecast — giving finance and leadership a unified view of infrastructure investment needs across the full portfolio, not terminal by terminal.
What Changed After 12 Months of Centralized Visibility
Common Questions on Airport Multi-Terminal CMMS
Can terminals retain some level of autonomy while feeding into a central dashboard?
How are different terminal PM standards handled in one system?
What reporting formats does the Oxmaint dashboard support for airport stakeholders?
How does Oxmaint handle the scale of 14,000+ assets across multiple terminals?
Your Operations Center Deserves a Real Picture — Not a 48-Hour Old Report
Oxmaint centralizes maintenance data from every terminal into one live operations dashboard — so leadership can see PM compliance, open faults, vendor performance, and asset health across the full portfolio in real time. No silos, no delays, no guesswork.