Airport ground support equipment reliability is not a maintenance metric — it is a turnaround economics problem disguised as one. When a baggage tug, belt loader, or ground power unit fails on the ramp during a peak push, the cost is never just the repair; it is the cascading flight delay, the missed slot, the airline penalty, and the regulatory exposure when an unserviceable GSE unit is discovered by a ramp safety auditor before it is discovered by the maintenance team. This case study examines how a multi-terminal ground operations team operating tow tractors, baggage tugs, belt loaders, GPUs, de-icing rigs, and pushback tractors transformed GSE reliability from a reactive cost centre into a measured, predictable asset programme using Oxmaint — and the operational and financial results that followed. Maintenance directors at airports and ground handlers across the USA, UK, Canada, UAE, Germany, and Australia will recognise every pattern here. start a free trial to deploy the same GSE reliability framework on your ramp, or book a demo to walk through this case in detail with your fleet structure.
Get Your Custom GSE Reliability Plan
See exactly which units in your fleet are driving the most breakdowns, the most overtime, and the most ramp delays — then turn that visibility into a planned maintenance programme that pays for itself in a single quarter.
Used by operations teams managing 10,000+ assets — live in days, not months.
The Starting Point: A Ramp Operation Running on Whiteboards
The operation profiled here manages 187 GSE units across four terminals — baggage tugs, belt loaders, container loaders, ground power units, air-start units, passenger stairs, de-icing rigs, and pushback tractors. Before deploying Oxmaint, the team relied on a hangar whiteboard for active job tracking, a shared spreadsheet for PM scheduling, and shift-end paper logs for completed work. The reliability picture looked stable on paper. The ramp reality told a different story.
Mean time to repair was averaging 6.4 hours on critical units. PM compliance — measured properly, against scheduled dates — sat below 60 percent. Forty-three percent of all GSE work was reactive, generated by failures detected on the ramp during active turnarounds rather than during pre-shift inspections. And every quarterly station audit produced documentation findings that nobody had time to systematically close. start a free trial to see where your ramp operation sits against these benchmarks.
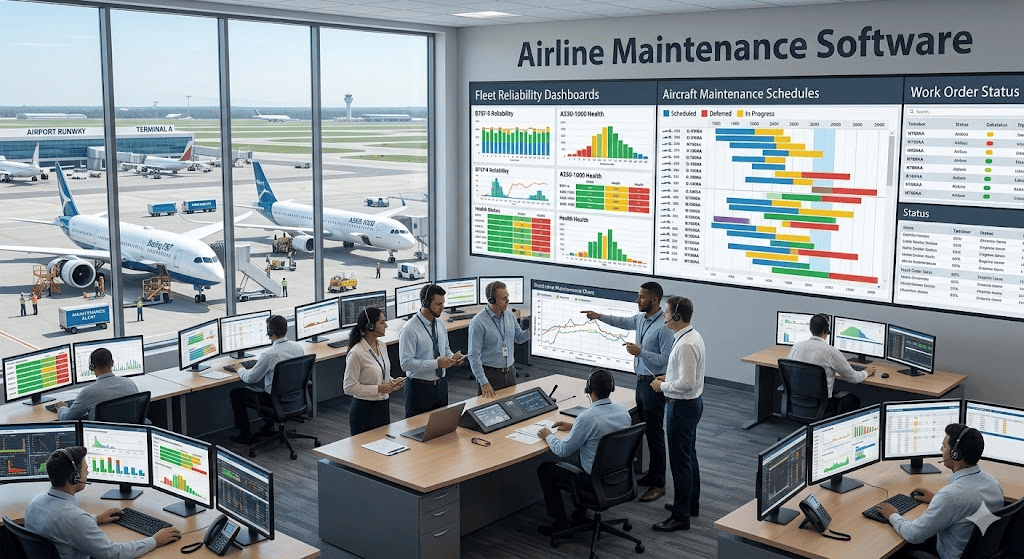
The Six-Layer GSE Reliability Framework Deployed
Complete Asset Registry
Every GSE unit registered with serial, OEM, build date, location, current condition score, and full PM history.
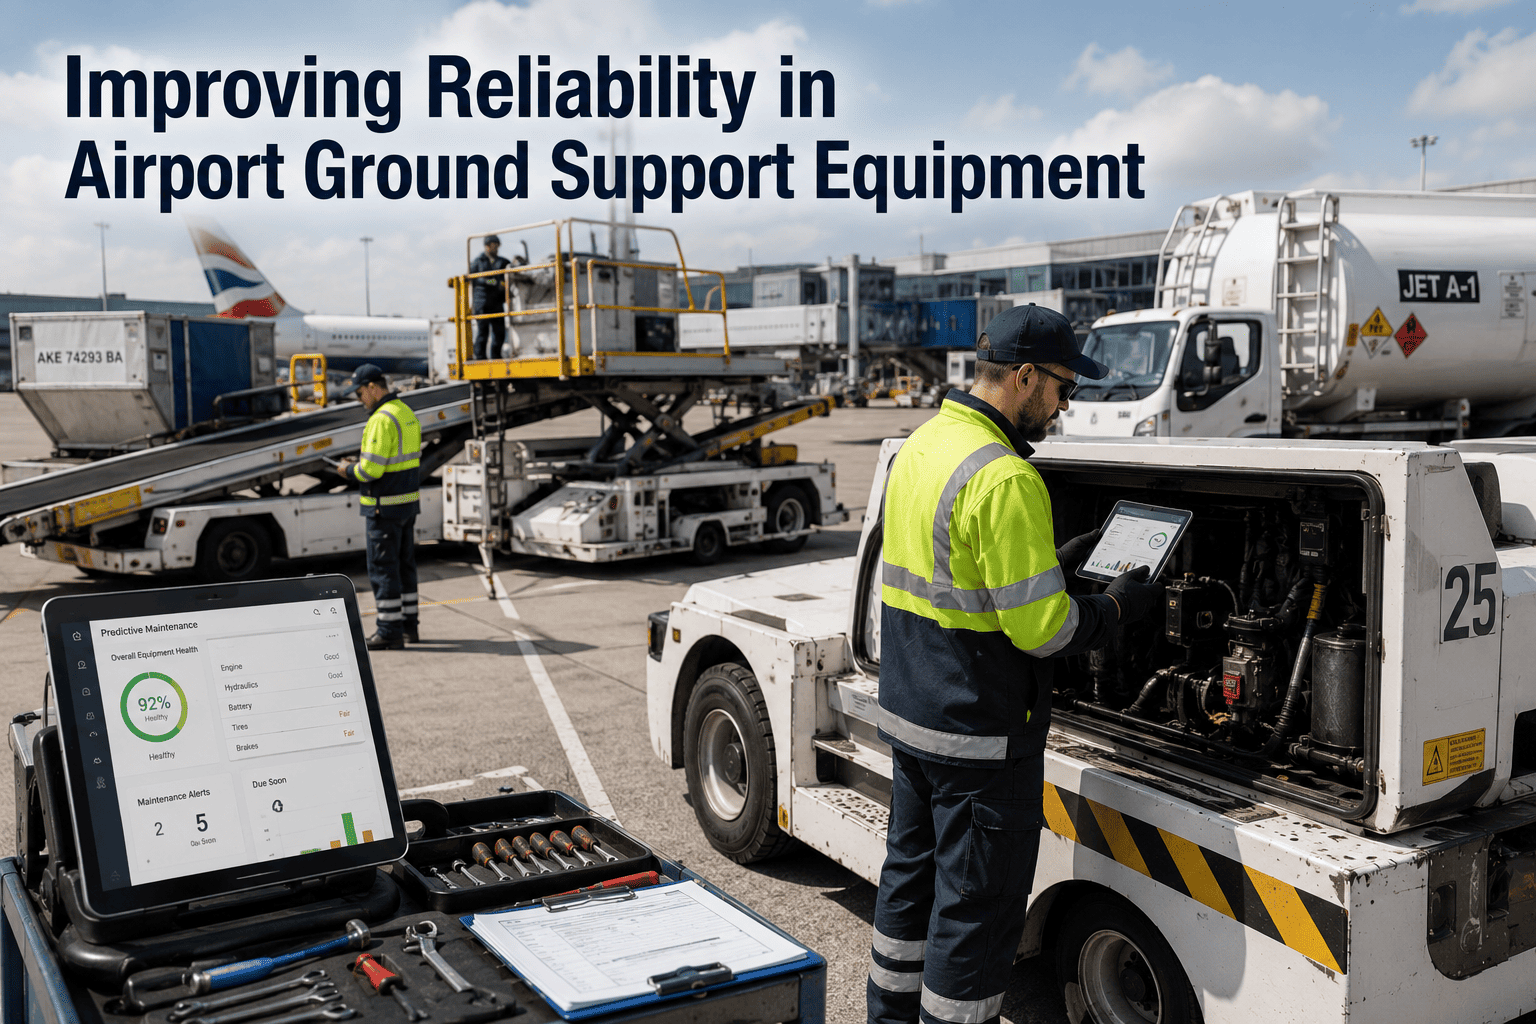
Pre-Use Operator Checklists
Mobile pre-use checks logged by the assigned operator before every shift — issues become work orders instantly.
Duty-Cycle-Based PM
PMs triggered by run hours and duty cycles, not by calendar — over-servicing and under-servicing eliminated.
Condition Scoring per Unit
Every GSE unit carries a live condition score updated at PM and inspection — replacement planning becomes data-driven.
Critical Spare Stock Triggers
Tug hydraulic seals, GPU rectifier units, conveyor bearings tracked with auto-reorder so stock is never zero at repair time.
Portfolio Reliability Dashboard
Live availability, MTBF, MTTR, and PM compliance per unit and per terminal — visible to ops, maintenance, and finance.
62% of GSE breakdowns happen within 30 days of a missed PM — and almost all are recovered into planned maintenance with the right CMMS.
The Operational Pain Points the Programme Eliminated
Ramp-Side Breakdowns During Peak Push
Tugs and belt loaders failing during the morning push, blocking gates and forcing emergency unit swaps under time pressure. Every minute of GSE downtime cascades into airline penalty exposure.
PM Schedules Drifting Out of Sync
Calendar PMs missed during high-traffic weeks then carried over indefinitely — units accumulating service debt that surfaces as a cluster of failures the following quarter.
Paper Pre-Use Checks Lost or Skipped
Operator pre-use inspections completed on clipboards that nobody collated. Defects spotted at 06:00 not reaching the maintenance team until shift handover at 14:00 — or never.
No Visibility Into Repeat-Offender Units
Same five tugs accounting for 35 percent of breakdowns each quarter with nobody systematically flagging the pattern. No fleet-wide data to justify replacement or rebuild capex to finance.
Teams switching from reactive to structured CMMS-driven GSE management routinely cut ramp breakdowns by half within two quarters — start a free trial to experience this shift, or book a demo to see your ramp profile modelled.
How Oxmaint Delivered Each Layer of the Programme
Multi-Terminal GSE Portfolio
All 187 units organised across four terminals with location-level and fleet-level reliability views. Common failure patterns across terminals flagged automatically for fleet-wide action.
Operator Pre-Use Mobile Checks
Every operator completes a pre-use check on a tablet or phone at shift start — defects raise work orders instantly, assignment routes to the right technician without supervisor intervention.
Duty-Cycle PM Triggers
PM schedules driven by run hours, duty cycles, and condition signals — not calendar dates that ignore actual utilisation. High-use tugs serviced more often, low-use units less.
Asset Condition Scoring
Every PM event updates the unit's condition score. Capex planning becomes a portfolio review of objective scores, not a meeting based on which units the team remembers as troublesome.
Critical Spare Auto-Reorder
Tug hydraulic seals, GPU rectifiers, conveyor bearings tracked with consumption-driven reorder triggers — every repair finds the part it needs on the shelf.
Ramp Reliability KPI View
MTBF, MTTR, availability, PM compliance, emergency-to-planned ratio — live per unit, per terminal, per fleet category. Operations directors stop guessing about ramp performance.
See measurable results in the first 30 days — limited onboarding slots available this quarter.
Before vs After: Twelve-Month Reliability Outcomes
| Reliability Metric | Before (Whiteboard + Spreadsheet) | After (Oxmaint, 12 Months) |
|---|---|---|
| GSE fleet availability | 83.4% | 94.7% |
| Mean time to repair (critical units) | 6.4 hours | 2.1 hours |
| PM compliance rate | 58% | 96% |
| Emergency-to-planned ratio | 43% reactive | 14% reactive |
| Ramp incidents linked to GSE failure | 11 per quarter | 2 per quarter |
| Audit findings (annual) | 18 documentation gaps | 1 minor observation |
| Maintenance overtime hours | High and unpredictable | Cut 38% |
| Annual GSE maintenance spend | Baseline | Down 27% |
Twelve-Month Programme ROI
Frequently Asked Questions
What types of ground support equipment does Oxmaint manage?
Oxmaint manages every category of GSE on a typical ramp — baggage tugs, container and pallet loaders, belt loaders, ground power units, air-start units, air-conditioning units, passenger boarding stairs, de-icing rigs, fuel bowsers, pushback tractors, water and lavatory service trucks, and aircraft maintenance stands. Each unit is registered as a serialised asset with OEM, model, build date, current condition score, and complete PM and corrective maintenance history. The asset hierarchy supports multi-terminal and multi-station operations, so ground handlers managing fleets across multiple airports run all GSE on a single platform with both station-level and portfolio-level visibility.
How does Oxmaint reduce GSE breakdowns specifically?
Three mechanisms compound. First, duty-cycle-driven PM scheduling means high-utilisation units receive service when they actually need it rather than on a calendar that ignores load. Second, operator pre-use mobile checks catch developing faults — hydraulic seepage, brake softness, electrical warning indicators — before the unit is dispatched to a gate, turning what would have been a ramp-side breakdown into a workshop work order. Third, condition scoring and repeat-offender analytics surface the small number of units driving a disproportionate share of failures, enabling targeted rebuild or replacement decisions instead of treating the entire fleet as homogeneous. Operations running this framework typically see GSE breakdown rates drop 50–70 percent within two quarters.
How does the platform support ramp safety audits and FAA Part 139 compliance?
Every GSE inspection, PM event, defect record, and corrective action is timestamped, technician-signed, and tied to the specific asset. Pre-use checks, work order completion records, photographic evidence, and certification documents are retained per unit and exportable in seconds by date range or asset. Audit preparation — historically a multi-day exercise of binder hunting and record reconciliation — becomes a filtered report. FAA Part 139 ramp safety inspections, station audits from airlines and handlers, and OSHA compliance reviews all draw on the same continuous evidence base, so the documentation a regulator asks for is the same documentation the operations team uses every day.
Can Oxmaint be deployed at a ground handler managing GSE across multiple airports?
Yes — multi-site portfolio management is a core architectural capability. Ground handlers operating at three, ten, or thirty airports manage all GSE fleets in one platform. Each station maintains its own asset hierarchy, PM schedules, and technician roster, while operations directors see a portfolio dashboard of all-station availability, open work orders, PM compliance rates, and recurring fault patterns. A repeated hydraulic seal fault on a specific tug model, for example, surfaces as a fleet-wide trend even when individual stations would only see isolated incidents — enabling fleet-wide engineering action rather than station-by-station firefighting.
Stop Losing Turnarounds to Predictable GSE Failures
Every ramp operation profiled in this case followed the same arc — reactive breakdowns and documentation gaps replaced with measured reliability and audit-ready records. Oxmaint delivers the same framework to ground operations teams at airports and ground handlers across the USA, UK, Canada, UAE, Germany, and Australia.
- Real-time GSE availability and condition across every terminal
- Predictive failure alerts before peak-push breakdowns occur
- FAA Part 139 and station-audit-grade documentation built-in