Regional airports operate under tighter resource constraints than major hubs, making ground support equipment failure trends a direct threat to on-time performance. When a tug fleet goes down during a busy morning bank, the knock-on effect — delayed pushbacks, missed slots, apron congestion — cascades through the entire departure sequence. Most regional operations lack the digital infrastructure to track failure patterns, correlate them with stand allocation cycles, or benchmark serviceability rates against dispatch demand. Oxmaint's CMMS platform gives ground handling teams a live equipment register, work order history by asset, and failure trend analytics that surface repeat breakdown patterns before they compound into ramp-level delays. Teams can Sign Up Free and begin logging GSE work orders against individual assets from day one — no IT project required. For regional airport operators managing multi-terminal or multi-airline ground handling contracts, Book a Demo to see how fleet-level failure trend reporting works across all equipment classes.
Oxmaint tracks every ground support equipment failure, repair cycle, and dispatch gap — giving regional airport teams the trend data they need to protect ramp readiness and reduce departure delays.
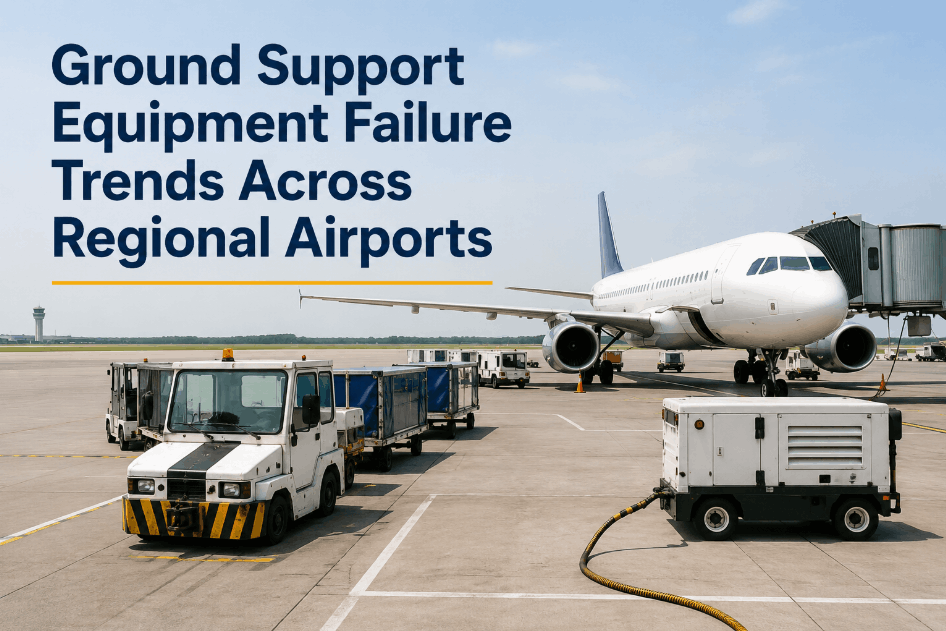
6 Ground Support Equipment Failure Patterns That Disrupt Regional Airport Ramp Operations
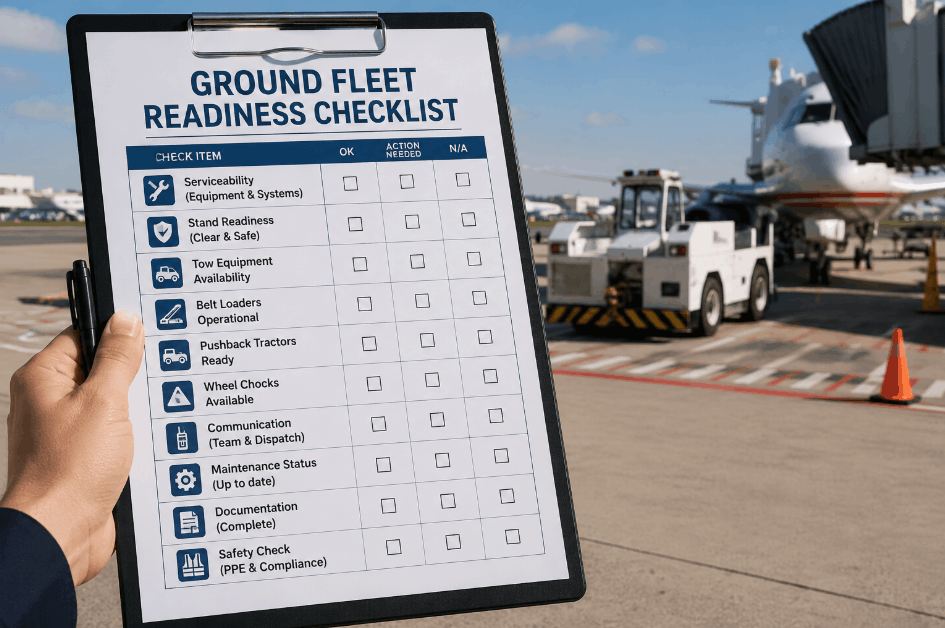
Understanding where failures concentrate — by equipment type, shift, or stand zone — is the foundation of ramp readiness improvement. Oxmaint captures work order data at asset level across the full GSE fleet, enabling regional airport teams to Sign Up Free and run failure frequency analysis without manual log reconciliation.
Towbarless tractors and conventional pushback tugs at regional airports show concentrated hydraulic system failures during high-cycle morning and evening banks — a pattern that proactive PM scheduling can interrupt.
Small ground equipment losses — missing wheel chocks, degraded safety cones, worn FOD barriers — accumulate invisibly until a compliance audit or ramp incident forces an emergency count.
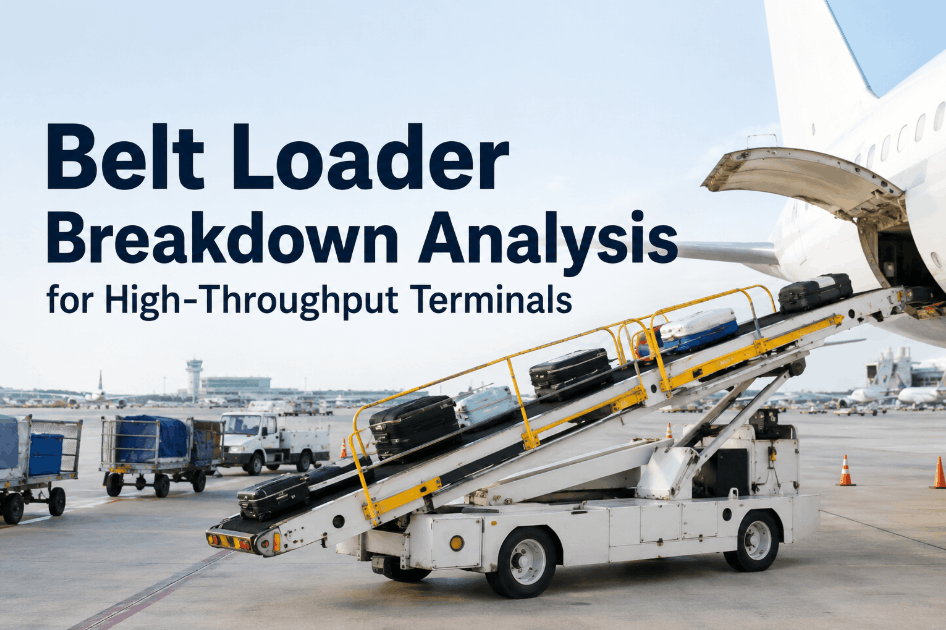
Belt loaders and passenger stairs at high-frequency regional gates accumulate cycle-based wear that isn't visible in calendar-based PM schedules — leading to mid-shift breakdowns during peak baggage windows.
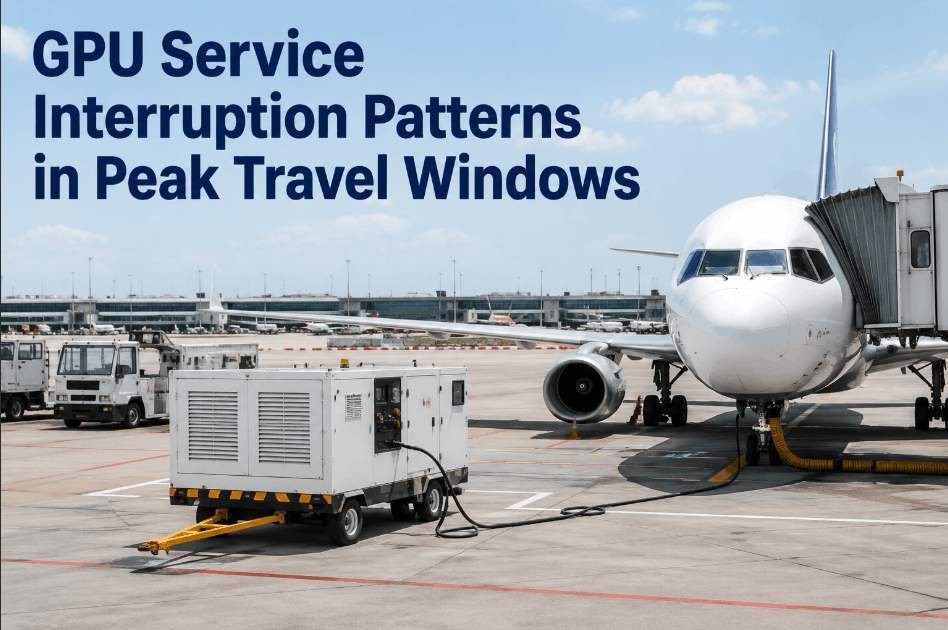
Ground power units at regional stands show voltage regulation degradation over operating cycles — a failure mode that disrupts aircraft systems during turn and triggers unplanned swap delays at the worst moments.
Uneven equipment dispatch — certain assets overused while others sit idle — accelerates failure rates on high-cycle units and creates serviceability gaps when those assets go down simultaneously.
At regional operations with thin maintenance staffing, deferred work orders compound: a minor hydraulic seep becomes a full pump failure within weeks, pulling a critical pushback tractor out of the stand allocation pool.
GSE Reliability KPIs Regional Airport Maintenance Teams Should Track
Most regional airports track flight delays but not the equipment failure metrics that drive them. Oxmaint's asset and work order analytics give ground handling teams the KPI layer that connects GSE serviceability to ramp performance. Operations managers should Book a Demo to see how the full GSE reliability dashboard is configured out of the box.
| KPI | What It Measures | Decision It Supports | Review Frequency | Priority |
|---|---|---|---|---|
| GSE Mean Time Between Failures | Avg operating hours between breakdowns per asset | PM interval calibration | Monthly | Critical |
| Dispatch Serviceability Rate | % of fleet available at stand dispatch windows | Fleet size and rotation planning | Weekly | Critical |
| Repeat Failure Rate by Asset | Work orders closed with same fault code within 30 days | Identify chronic breakdown assets | Monthly | Critical |
| Repair Cycle Time | Hours from breakdown report to return to service | Workshop staffing and parts provisioning | Weekly | Important |
| Deferred Work Order Backlog | Count and age of open maintenance tasks | Risk prioritisation and resource allocation | Weekly | Important |
| Marshalling Coverage Gap Incidents | Stands delayed due to GSE unavailability | Stand allocation contingency planning | Monthly | Important |
| PM Compliance Rate by Fleet Class | % of scheduled PMs completed on time | Maintenance program adherence | Monthly | Routine |
| Fleet Rotation Balance Index | Cycle hours spread across same-class assets | Even dispatch load distribution | Quarterly | Routine |
How Oxmaint Surfaces GSE Failure Trends Without Manual Log Consolidation
Regional airport maintenance teams typically reconstruct failure trends from handwritten shift logs, whiteboard boards, and disconnected spreadsheets. Oxmaint replaces this with a digital work order system where every breakdown, repair, and PM is logged against a specific asset — so trend data accumulates automatically. Ground handling managers can Sign Up Free and start building their GSE failure history from the first shift without any data migration or integration project.
- Each GSE unit registered as a named asset with class, location, and service history
- Mobile work order creation at point of failure — no shift-end log consolidation required
- Fault codes assigned to each work order for failure category trending
- PM schedules linked to asset cycle counters, not just calendar dates
- Repeat failure flags triggered automatically when same fault recurs within 30 days
- Role-based access for technicians, supervisors, and operations controllers
- Paper shift logs? Digital work order capture replaces them from day one
- No asset register? GSE fleet onboarding takes hours, not weeks
- Multi-terminal complexity? Single dashboard across all stand zones and equipment classes
- No analytics team? Out-of-the-box failure trend reports need zero configuration
- Deferred maintenance blind spots? Open work order aging visible to all managers
- Compliance audit risk? Every repair timestamped, attributed, and exportable
GSE Reliability Investment vs Delay Cost Model for Regional Airports
Per-user pricing with no hardware requirement. GSE failure trend analytics go live within the first maintenance cycle, with no BI tooling or integration overhead.
Regional operations relying on shift log reconciliation spend 10–20 hours per week reconstructing failure data that Oxmaint captures automatically at point of breakdown.
Each unplanned pushback tractor failure during a departure bank can trigger slot misses and handling penalties — costs that trend data and proactive PM directly reduce.
Identifying and resolving chronic breakdown assets typically eliminates 20–35% of unplanned work orders within the first two maintenance quarters of structured trend analysis.
Connecting PM schedules to actual cycle data instead of calendar intervals improves fleet serviceability rates — reducing the gap between available assets and dispatch demand.
Structured MTBF and repair cycle data gives regional airport managers the benchmarking foundation to justify fleet renewal, staffing increases, or PM program investment to senior leadership.
Why Regional Airport Ground Handling Teams Choose Oxmaint for GSE Failure Trend Analysis
Oxmaint is purpose-built for asset-intensive operations where equipment reliability directly determines service delivery outcomes. For regional airport ground handling, that means a CMMS that works at shift speed — mobile work order capture, instant asset history lookup, and out-of-the-box failure trend dashboards. Ground operations managers can Book a Demo to see how GSE work order data connects to ramp readiness metrics in one operational view.
Technicians log breakdowns and close work orders from the ramp via mobile — no office return, no shift-end paperwork, no data entry backlog between failure and record.
Every work order is stored against a specific GSE asset — building a searchable failure history that reveals chronic breakdown patterns invisible in aggregate shift reports.
Preventive maintenance triggered by actual operating cycles, not calendar intervals — keeping PM frequency aligned with real wear rates across tug, loader, and GPU fleets.
MTBF, repeat failure rate, repair cycle time, and PM compliance visible without custom configuration — giving operations managers instant access to the KPIs that drive ramp readiness decisions.
Compare GSE failure rates and serviceability across multiple terminal zones or airport locations — enabling ground handling contractors to benchmark operations and allocate resources where risk is highest.
Every repair, inspection, and PM is timestamped and user-attributed — supporting airline ground handling audits, safety compliance reviews, and equipment certification documentation.
Oxmaint gives regional airport ground handling teams mobile work order capture, asset-level failure history, and out-of-the-box trend dashboards — no manual log consolidation, no spreadsheets, no blind spots on ramp reliability.
GSE Failure Trend Tracking — Questions Regional Airport Maintenance Teams Ask
Oxmaint logs every work order against a specific GSE asset — accumulating failure frequency, fault type, and repair duration data that surfaces trend patterns automatically without manual log consolidation.
Yes. Repeat failure flags and MTBF calculations highlight chronic breakdown assets — giving maintenance teams the data to pre-position spares or schedule preventive work before high-traffic departure banks.
Yes. PM triggers can be set against operating cycle counters rather than calendar intervals — keeping maintenance frequency aligned with actual wear rates across towbarless tractors, belt loaders, and GPU units.
Yes. Oxmaint's multi-site hierarchy supports separate terminal or airport views within a single account — enabling portfolio-level GSE benchmarking alongside location-specific failure trend analysis.
Most teams have their GSE fleet registered and first work orders flowing within 24–48 hours. Meaningful trend data typically emerges after 4–6 weeks of consistent work order capture.
Yes. Technicians can create, update, and close work orders from any mobile device on the apron — eliminating the shift-end data entry backlog that delays failure trend visibility.
Oxmaint gives regional airport ground handling teams asset-level work order capture, automatic failure trend analytics, and cycle-based PM scheduling — no manual audits, no spreadsheets, no blind spots on ramp readiness.