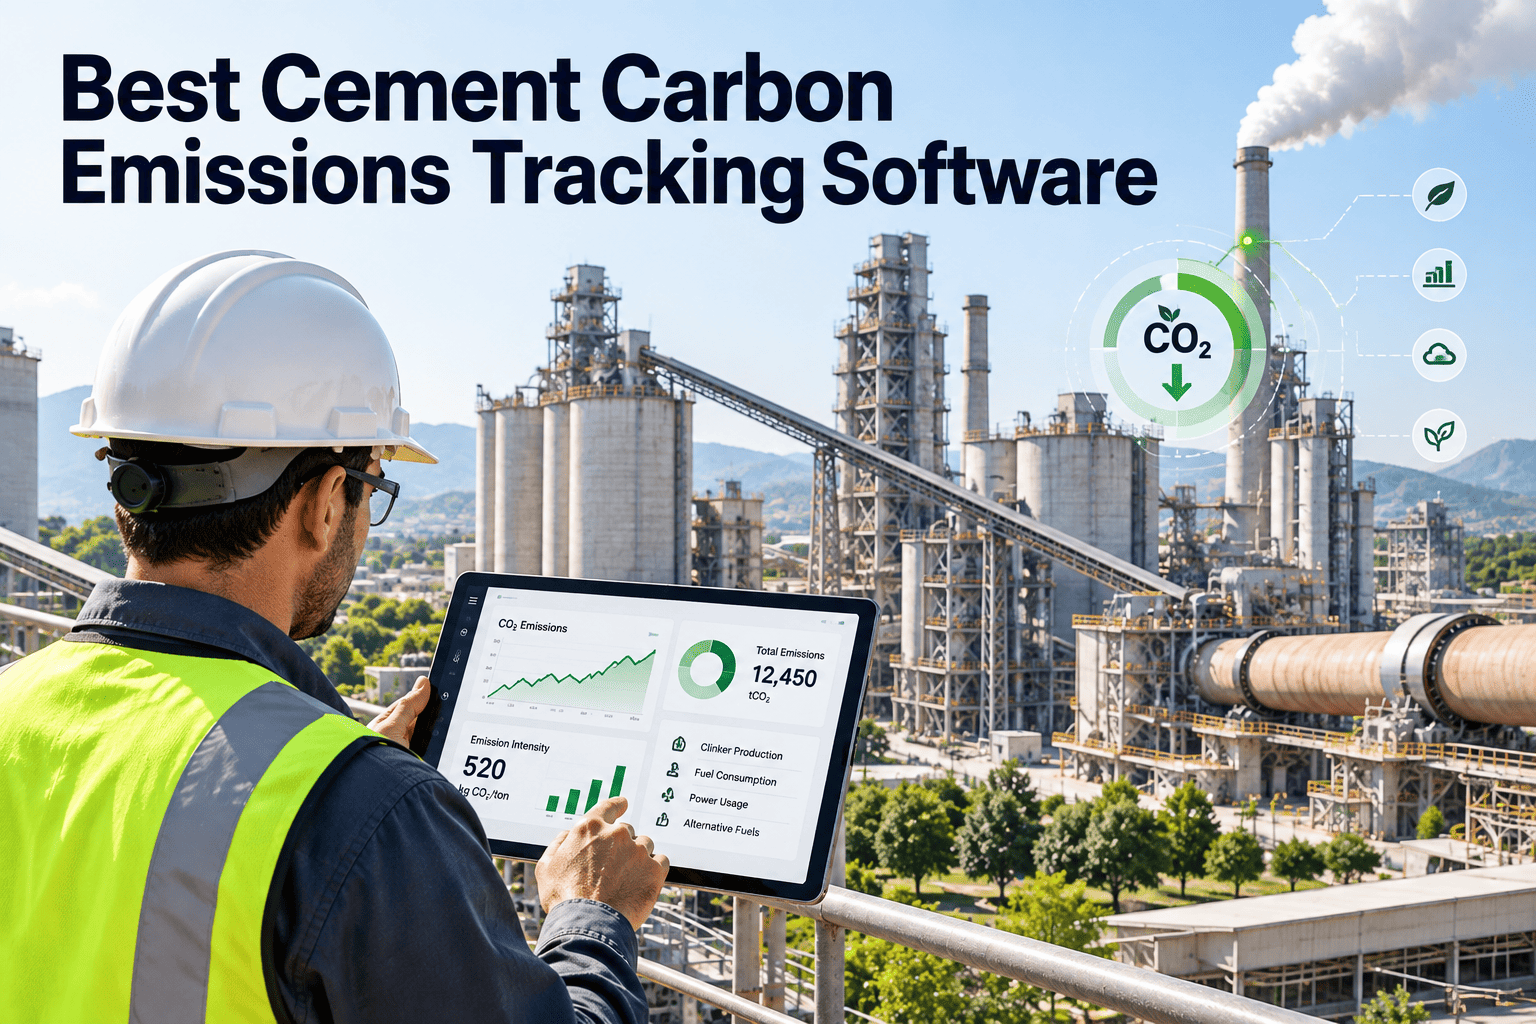
Cement is one of the hardest industries to decarbonize, and in 2026 carbon data is no longer a sustainability-team side project. Regulators, customers and lenders now expect plant-level emissions that can be traced and defended. Choosing carbon management software for a cement plant means asking which tools measure CO2, and which ones help your maintenance team act on what the numbers show. This comparison breaks down the main software categories and where maintenance management software fits in.
Best Cement Plant Carbon Management Software for 2026
Carbon reporting tells you what the kiln emitted. Maintenance execution decides what it emits next month. Compare the software categories, then connect both.
Why Carbon Software Selection Is Harder in Cement
Most industries can cut emissions mainly by buying cleaner power. Cement cannot, because a large share of CO2 is released by the chemistry of calcination itself.
- Process emissions come from limestone decarbonation and cannot be removed by efficiency alone.
- Fuel emissions come from the kiln and calciner, where fuel mix and combustion stability matter.
- Electricity emissions come from raw mills, cement mills, fans and conveying.
- Transport emissions come from internal haulage and outbound logistics.
Because of this split, no single dashboard solves the problem. The plants making steady progress combine accurate measurement with disciplined equipment reliability.
Where Cement Emissions Come From
Relative scale of each source, and what maintenance can influence
Bar lengths are illustrative of the commonly cited ordering, not plant data. Your own inventory will differ.
The 2026 Regulatory Pressure Behind the Purchase
Check which rules apply to your country and export markets. Requirements differ and are still evolving.
Software Categories Compared for Cement Plants
Rather than ranking vendors by marketing claims, compare the categories by the job each one does inside a cement plant.
| Category | Primary Job | Strength | Gap in a Cement Plant |
|---|---|---|---|
| Enterprise carbon accounting | Corporate inventory, Scope 1, 2 and 3 reporting | Group-level consolidation, disclosure frameworks | Limited visibility into why a kiln line drifted |
| CEMS and emissions monitoring | Continuous stack measurement and permit reporting | Regulatory accuracy, audit trail | Measures output, does not schedule corrective work |
| Process optimization and AI control | Stabilize kiln and mill operation in real time | Fuel and power savings through tighter control | Depends on healthy equipment, sensors and actuators |
| Energy management systems | Track power by area and shift | Specific energy trends and peak control | Rarely creates inspection or repair tasks |
| Maintenance management (CMMS/EAM) | Plan, execute and record equipment work | Closes the loop from anomaly to fix to history | Not a regulatory carbon inventory tool |
A realistic 2026 stack uses two or three of these categories, with data flowing between them.
Eight Criteria for Scoring Any Option
The Overlooked Link: Equipment Condition and Carbon
Many carbon intensity problems start as ordinary maintenance problems that nobody connected to emissions.
- Emission spike noticed on a monthly report
- Cause debated between operations and maintenance
- Ad hoc repair with no root-cause record
- Same fault returns the next quarter
- Anomaly flagged against a specific asset
- Inspection work order created and assigned
- Findings, parts and labor logged to asset history
- Recurring failure modes reviewed and removed
Examples of equipment issues that raise energy or fuel use
- False air ingress at kiln seals and preheater ducts, which forces extra fuel and fan power.
- Worn or misaligned burner components that destabilize flame and combustion.
- Degraded refractory lining that increases shell heat loss.
- Fouled or damaged fan impellers and dampers that waste electrical energy.
- Mill internals out of tolerance, lowering grinding efficiency and raising kWh per tonne.
- Inaccurate feeders or weighing systems that distort fuel and raw meal ratios.
Where OXMAINT Fits in a Carbon Program
OXMAINT is maintenance management software, not a regulatory emissions inventory. Its role is to execute the reliability work that supports lower emissions and better data quality.
Condition-based and predictive workflows can trigger work when readings cross thresholds, using data you already collect.
Turn Emission Insights Into Maintenance Action
See how preventive maintenance, asset history and work orders can support your plant carbon goals.
Risk Matrix: Which Gap Hurts Most
| Gap | Likelihood | Impact | Mitigation |
|---|---|---|---|
| Reporting tool with no action workflow | High | High | Link findings to work orders with owners |
| Unreliable fuel or feed measurement | Medium | High | Calibration PMs and inspection records |
| Manual spreadsheet handoffs | High | Medium | Integrate historian and maintenance data |
| Optimization tool on degraded equipment | Medium | Medium | Reliability baseline before tuning |
| No audit trail for repairs | Medium | Medium | Structured completion notes and history |
A Practical 90-Day Rollout
KPIs to Track Across Both Systems
Pair these with your verified CO2 intensity per tonne of cementitious product to see cause and effect.
Buyer Checklist Before You Sign
- Confirm which regulations and customer disclosures you must satisfy.
- Identify the systems that already hold fuel, kiln and power data.
- Ask vendors how findings become assigned, tracked work.
- Request an explanation of emission factors and calculation methods.
- Check mobile performance in low-connectivity plant areas.
- Define who owns data quality, calibration and exceptions.
- Plan how maintenance history will inform root-cause reviews.
- Pilot on one kiln line before a plant-wide rollout.
Data Quality: The Weak Point in Cement Carbon Reporting
Carbon software is only as accurate as the plant data feeding it. In cement, several inputs depend on instruments and equipment that need regular maintenance.
| Data Input | Typical Source | Common Failure | Maintenance Control |
|---|---|---|---|
| Clinker production | Weighbridge, belt scales, kiln feed calculation | Scale drift, buildup on belts, missing calibration | Scheduled calibration and belt inspection |
| Fuel consumption | Feeders, flow meters, weighbelts | Blocked or worn feeders, unverified meters | Feeder inspection routes, meter verification |
| Alternative fuel quantity | Dosing systems, truck scales | Bridging, inconsistent moisture, scale error | Cleaning tasks and calibration records |
| Stack concentration and flow | CEMS analyzers and flow probes | Fouled probes, drift, sample line leaks | Preventive maintenance and quality assurance checks |
| Electricity use | Revenue and sub-meters | Missing sub-meters, faulty current transformers | Meter inspection and replacement plan |
| Raw material carbonate content | Laboratory analysis and online analyzers | Sampling errors, analyzer downtime | Sampler maintenance, analyzer service |
When a verifier asks how a number was produced, calibration records and inspection history become evidence. Missing records can weaken confidence in the result.
Decarbonization Levers and Their Reliability Dependencies
Most cement decarbonization levers need dependable equipment. Software can model a target, but the plant has to run the process to reach it.
Questions to Ask Every Carbon Software Vendor
Use the same questions with each vendor so answers can be compared on equal terms.
- Which cement-specific emission sources and factors does the tool cover?
- How does it handle alternative fuels and biogenic fractions?
- Can it report at kiln line level, not only at company level?
- What does a verifier see when tracing a number to its source?
- How are meter and analyzer data gaps flagged and corrected?
- Which plant systems does it integrate with, and who builds the connections?
- How are findings converted into assigned corrective actions?
- What training do plant teams need, and what is the internal effort?
- How are methodology updates and regulation changes delivered?
- What happens to historical data if you switch tools later?
Warning signs during evaluation
- Demonstrations that use generic manufacturing data instead of cement process data.
- Claims of automatic reduction without explaining which equipment or practice changes.
- No clear answer on who owns data quality at plant level.
- Pricing that excludes integration, sensors and internal engineering time.
Who Should Own What in a Carbon Program
Naming one accountable owner per row prevents the common situation where everyone reads the report and no one owns the fix.
Frequently Asked Questions
Connect Carbon Targets to Daily Maintenance
Measurement matters, but results come from reliable equipment and closed work orders. Start building that discipline for your cement plant today.