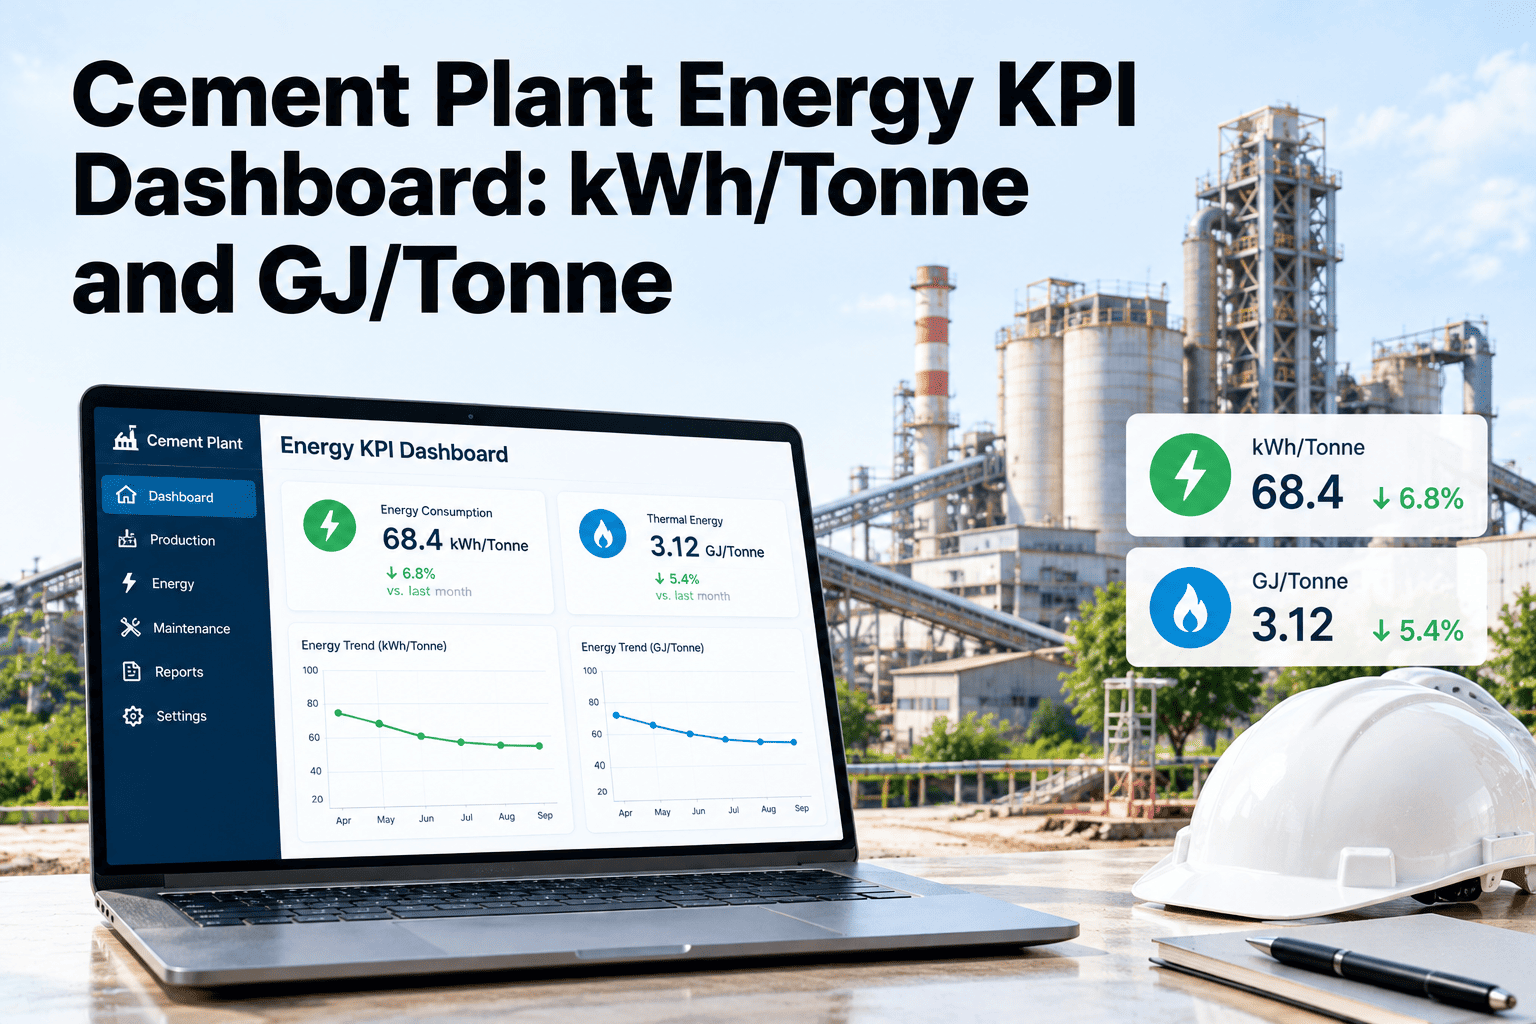
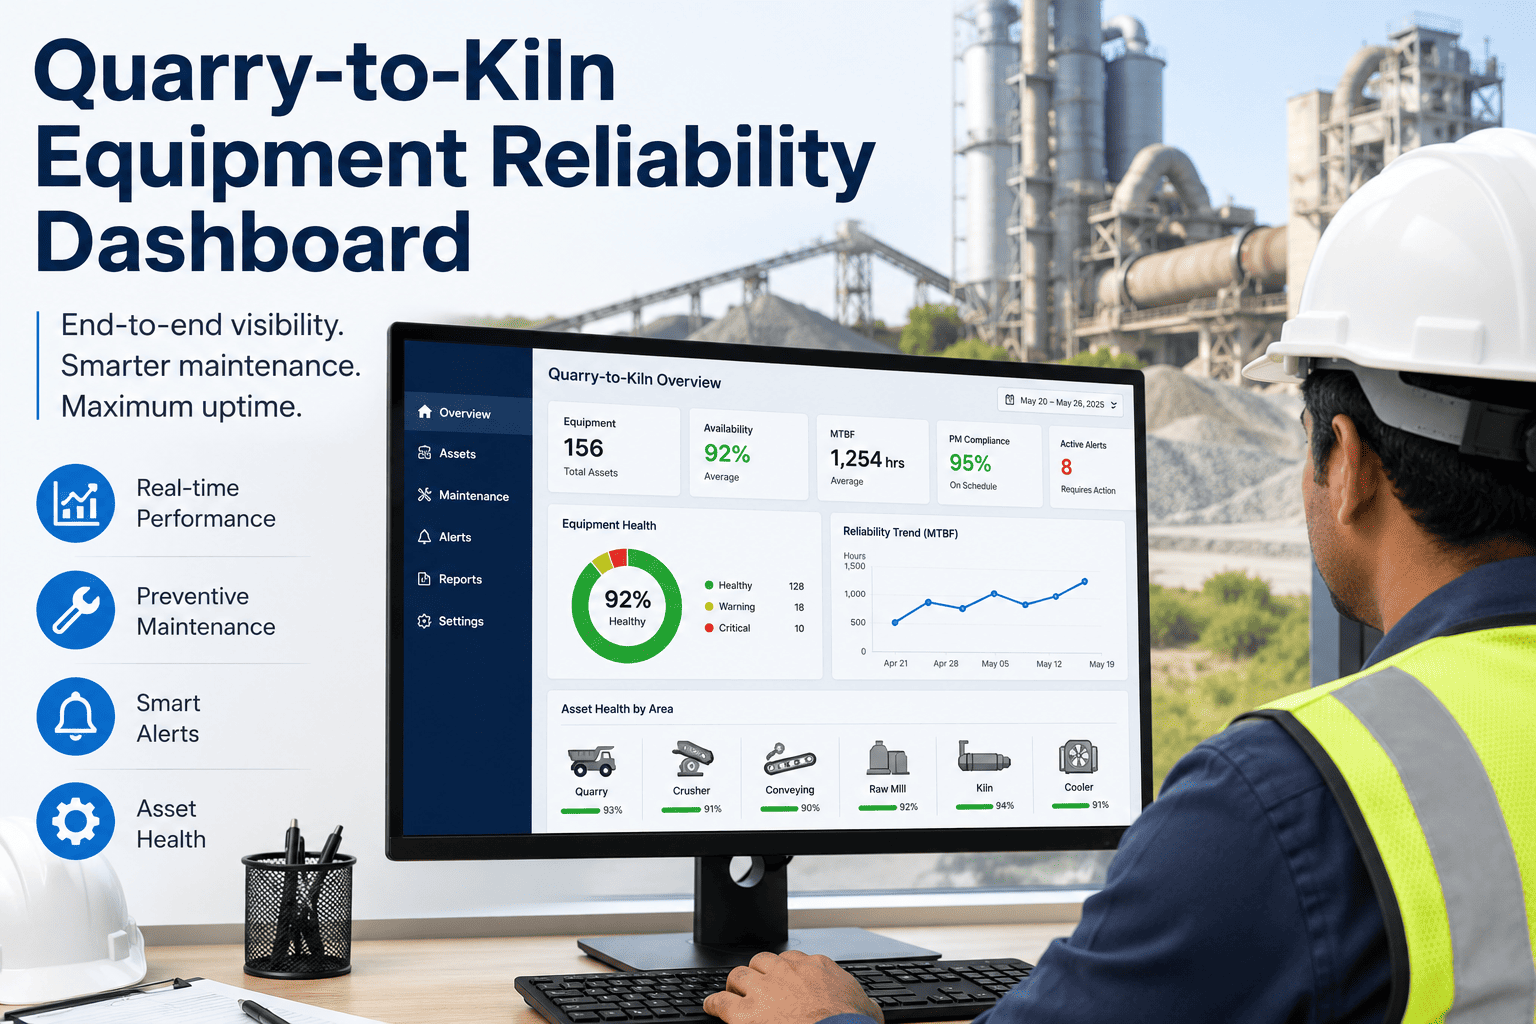
Cement production accounts for roughly 7–8% of global CO₂ emissions, and regulators, investors and buyers are demanding visible, measurable progress. The problem is that most cement plants track energy consumption in one system, maintenance history in another, and emission readings in a third — making it nearly impossible to see the direct link between an overdue mill separator bearing, a 4% rise in specific power consumption and a corresponding bump in scope 1 emissions. OxMaint closes this gap by connecting maintenance reliability data with energy-linked equipment performance in one analytics layer. Explore OxMaint's analytics dashboard — start your free trial today.
Carbon Reduction · Maintenance Analytics · Cement Sustainability
Your Maintenance Records Are a Carbon Reduction Goldmine. Are You Using Them?
Equipment running in degraded condition wastes energy. A misaligned kiln drive, a leaking preheater bypass damper, or a worn raw mill classifier wastes megawatt-hours that translate directly into carbon emissions. OxMaint analytics surface the link between maintenance compliance, equipment health and your plant's specific energy consumption — so sustainability targets become maintenance targets.
15–25%
energy waste
attributable to degraded equipment condition in cement grinding and pyroprocessing
0.82–0.88
tCO₂/t clinker
global average — plants with better reliability analytics consistently sit at the lower end
3–7%
SEC improvement
specific energy consumption gain achievable through maintenance-driven optimization alone
The Missing Connection
How Maintenance Reliability Directly Drives Carbon Emissions
Every major energy-consuming asset in a cement plant has a documented "healthy" specific power consumption baseline. When that asset degrades — due to missed maintenance, wear accumulation or failure drift — its power draw rises. More power consumed means more grid electricity used, and for plants with captive power, more fuel burned. The emissions follow automatically. OxMaint analytics make this chain visible.
PM
Missed or Delayed PM
Overdue lubrication, worn liners, misaligned drive — equipment drifts from optimum
→
kWh
Energy Consumption Rises
Specific power per tonne climbs 3–8% per degraded asset — often unnoticed for weeks
→
CO₂
Emission Figures Rise
Scope 1 and scope 2 emissions increase — PAT targets, BEE ratings and ESG reports are impacted
→
Fix
OxMaint Connects the Dots
Correlates PM compliance rates with energy and emission KPIs — gives maintenance a sustainability metric
Emission-Critical Equipment
The 6 Equipment Groups That Determine Your Carbon Performance
01
Kiln System
High Impact
Shell radiation losses, bypass damper leakage, brick condition — each drives fuel consumption directly. OxMaint tracks kiln-specific PM compliance against heat consumption KPIs.
02
Raw Mill (VRM / Ball)
High Impact
Classifier wear, grinding table condition, separator efficiency — specific power per tonne rises 5–12% in degraded mills. Maintenance records in OxMaint are correlated with SEC trending.
03
Cement Mill
High Impact
Ball charge grading, diaphragm condition, separator efficiency — cement grinding is the largest single power consumer. PM compliance tracking directly links to kWh/t output.
04
Preheater & Calciner
High Impact
Cyclone blockage, refractory condition, false air infiltration — each percentage point of false air raises heat consumption by 8–12 kcal/kg clinker. OxMaint tracks inspection compliance for all preheater stages.
05
Clinker Cooler
Medium Impact
Grate plate condition, cooling fan performance, recuperation efficiency — poor cooler maintenance raises exit temperatures and reduces secondary air heat recovery, increasing kiln fuel need.
06
Compressed Air & Fans
Medium Impact
Fan blade fouling, damper seal leaks, compressor valve wear — auxiliary equipment energy losses are individually small but collectively account for 8–15% of total plant SEC when unmanaged.
Analytics · PAT Compliance · ESG Reporting
Connect Your Maintenance Data to Your Carbon Reduction Goals
OxMaint's analytics dashboard correlates PM completion rates, equipment health scores, and energy-linked performance metrics in one view — giving your sustainability and maintenance teams a shared language for carbon reduction initiatives.
Analytics Capabilities
What OxMaint Analytics Shows Your Plant — That Spreadsheets Cannot
01
PM Compliance vs. Energy Consumption Correlation
OxMaint's reliability dashboard plots maintenance completion rates against equipment-level energy readings over time — showing exactly which assets and which delayed PMs are producing energy waste. This turns maintenance backlog from an operational metric into a carbon reduction lever.
02
Equipment Downtime Impact on Emission Peaks
Unplanned breakdowns force kilns into startup/shutdown cycles — each kiln restart burns 20–40 tonnes of additional fuel with no clinker output. OxMaint tracks unplanned downtime events and their energy cost, giving you an emissions impact figure for every avoidable breakdown.
03
Emission Equipment Uptime Tracking
CEMS, bag filters, ESP systems and continuous monitoring equipment must be operationally available to meet regulatory requirements. OxMaint tracks PM compliance and uptime for all emission-monitoring and abatement equipment — with audit-ready records for CPCB and State PCB submissions.
See the compliance dashboard — book a 30-minute demo.
04
Reliability Trend Reports for ESG Disclosures
Export maintenance reliability metrics — PM completion %, mean time between failures, corrective vs. preventive work ratio, critical asset uptime — formatted for inclusion in sustainability reports, ESG disclosures and BEE PAT cycle documentation.
05
Maintenance Cost vs. Energy Waste Dashboard
Compare the cost of performing a PM on time versus the energy cost of running the asset in a degraded state. For cement mills and kilns, the energy waste from delayed maintenance routinely exceeds PM cost by 5–12× — data that changes how management views maintenance spending.
Start your free trial and access the cost-vs-waste dashboard.
06
AFR and Fuel Substitution Impact Tracking
Track AFR feed system availability and substitution rates alongside kiln heat consumption in OxMaint — making the carbon benefit of your alternative fuel program visible against the maintenance investment required to sustain it. This gives sustainability managers real data for capital justification.
Quick Reference
Maintenance Defect → Energy Impact — Key Cement Plant Data Points
| Equipment |
Maintenance Defect |
Energy Waste Indicator |
Emission Impact |
OxMaint Action |
| Kiln shell |
Hot spot / brick thinning |
+3–6 kcal/kg radiation loss |
~0.003 tCO₂/t clinker |
Shell scanning PM schedule |
| Raw mill |
Worn classifier blades |
+5–10 kWh/t raw meal |
Indirect via power draw |
Classifier inspection WO |
| Preheater |
False air infiltration 5% |
+8–12 kcal/kg clinker |
~0.005 tCO₂/t clinker |
Stage seal inspection PM |
| Cement mill |
Poor ball charge grading |
+3–7 kWh/t cement |
Indirect via power draw |
Ball charge audit checklist |
| Cooler |
Worn grate plates 30% |
+15°C exit temp rise |
Reduced heat recovery |
Grate plate inspection WO |
| CEMS / bag filter |
PM overdue |
Emission reading gap |
Regulatory non-compliance |
Compliance PM auto-schedule |
Frequently Asked Questions
Carbon Analytics & Maintenance Reporting — Common Questions
How does OxMaint link maintenance data to energy and emission metrics?
OxMaint's analytics module tracks PM completion rates, work order closure timelines, and asset downtime events — and displays these alongside energy-linked performance indicators for each major equipment group. Maintenance managers see which delayed PMs correspond with energy consumption increases, enabling root-cause analysis that connects reliability decisions to sustainability outcomes.
Start your free trial and explore the reliability analytics dashboard.
Can OxMaint reports be used for BEE PAT cycle submissions?
OxMaint generates exportable maintenance reliability reports covering PM compliance percentage, corrective vs. preventive work ratio, critical asset uptime, and mean time between failures. These metrics are directly relevant to BEE PAT documentation demonstrating operational efficiency and equipment-level energy management — and can be exported in formats suitable for submission or internal review.
Does OxMaint track uptime of emission monitoring equipment like CEMS?
Yes. Continuous Emission Monitoring Systems, bag filters, ESP units and stack monitoring equipment can all be registered as assets in OxMaint with dedicated PM schedules and compliance tracking. Every inspection and maintenance task generates a timestamped digital record — giving you an audit-ready maintenance history for CPCB and State PCB submissions.
Book a demo to see compliance equipment tracking in action.
How quickly can a cement plant start using OxMaint's analytics?
Analytics populate from the moment work orders are created and closed. A plant that uploads its asset register and begins scheduling PMs in OxMaint starts seeing reliability trend data within the first operational week. Historical data can be imported to build a baseline. The free trial provides full analytics access from day one, with no implementation consultant required.
Maintenance Analytics · Carbon Reduction · ESG Reporting
Make Maintenance Reliability Your Strongest Carbon Reduction Tool
When your kiln runs clean, your mills operate efficiently and your AFR systems stay online, your carbon numbers follow. OxMaint analytics give you visibility into the exact maintenance decisions driving your plant's energy consumption and emission performance — and the data to back every sustainability claim you make.