Every cement plant now has a carbon number attached to every tonne it ships, and by 2026 that number has to hold up under external verification, not just appear in an annual sustainability slide. Most plants still build it from fuel ledgers, electricity invoices, and a raw-mix spreadsheet reconciled by hand once a quarter — a process that produces a different total every time someone re-runs it, and one that regulators and customers are increasingly unwilling to accept without a traceable source. This guide walks through what carbon emissions tracking software actually needs to do for a cement operation, and where a system like Oxmaint fits into that requirement list.
Cement Manufacturing · Carbon & CBAM
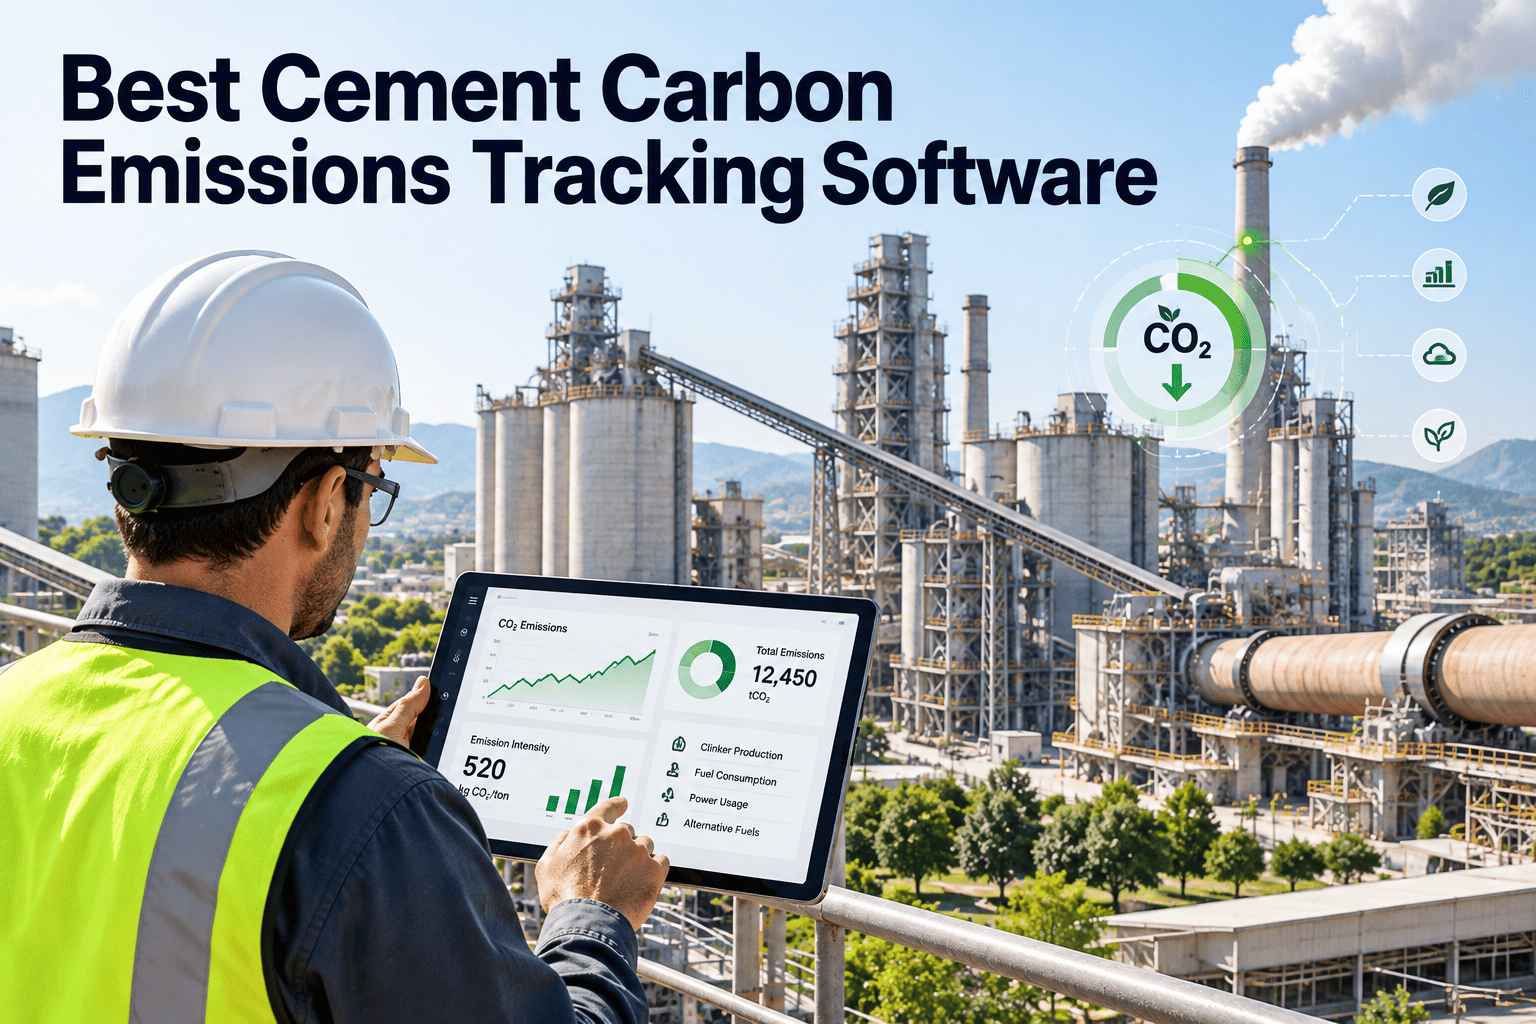
Best Cement Carbon Emissions Tracking Software: What to Look For and Why It Matters Now
CBAM's definitive phase, EU ETS Phase 4's shrinking free allocation, and CSRD's asset-level disclosure rules have moved carbon tracking from an annual report to a live operational number. The right software connects fuel meters, lab data, and production tonnage into one auditable emissions ledger — and ties it to the maintenance work that actually moves the number.
Why Spreadsheet Carbon Tracking Is Running Out of Road
A quarterly spreadsheet reconciliation worked when carbon reporting meant one annual disclosure built from plant-wide averages. That assumption no longer holds for a cement producer with EU exposure or CBAM-covered exports, where the reporting cadence, the required granularity, and the verification standard have all tightened at once.
What changed the reporting cadence
CBAM's definitive phase requires embedded emissions calculated per shipment from actual plant data once a facility has reported through a full cycle — not a default benchmark value averaged across the year.
Reconciliation lag
Fuel, lab, and production data live in three separate systems and get matched by hand weeks after the production period closes.
No shipment-level granularity
A plant-wide monthly average can't answer what CBAM now asks: the embedded emissions of the specific clinker or cement batch in a specific shipment.
Audit trail gaps
A verifier asking "show me the source data behind this number" finds a spreadsheet formula, not a timestamped meter reading or lab result.
Disconnected from maintenance
The equipment condition driving fuel waste — kiln refractory, combustion tuning, mill efficiency — sits in a separate CMMS the carbon spreadsheet never touches.
What "Best" Actually Means for This Category
Carbon tracking software for cement is judged on a narrower set of criteria than general ESG platforms, because the underlying chemistry and regulatory framework are specific to the industry. Five capabilities separate a genuinely usable system from a dashboard bolted onto a generic sustainability tool, and most vendor comparisons skip straight past them to talk about dashboard aesthetics instead.
01
Automated data capture at the source
Fuel meters, weighbridges, and LIMS feed the emissions calculation directly — no manual transcription of coal, petcoke, or alternative fuel tonnages into a spreadsheet cell.
02
Product-level, not plant-level, calculation
Emissions attributed by product type and production line, since CBAM and most modern frameworks require per-product intensity rather than a single plant-wide average.
03
Clinker factor and blend tracking built in
Since clinker chemistry drives the majority of Scope 1 emissions, the software needs to track clinker-to-cement ratio and SCM blending as first-class data, not an afterthought.
04
A defensible audit trail
Every number traces back to a specific meter reading, lab result, or work order — the difference between a verifier accepting a figure and requesting re-verification.
05
A connection to the maintenance data that drives the number
Kiln thermal efficiency, combustion tuning, and mill power draw are maintenance-influenced variables — software that ignores this link can report the number but can't help reduce it.
Your Carbon Data Is Already Sitting in Your Maintenance Records
Oxmaint pulls fuel consumption, kiln readings, and energy meter data directly from the work orders and inspections you already log, and converts them into a live, equipment-indexed emissions ledger — no separate carbon accounting project required.
Three Ways Plants Currently Track Carbon — Compared
Most plants land in one of three approaches, and the gap between them widens every reporting cycle as CBAM and EU ETS requirements tighten.
The Core KPIs the Software Needs to Calculate
Whichever platform a plant chooses, it needs to produce these figures without a manual recalculation step, because they are the numbers regulators, customers, and internal reduction targets are all built around, and inconsistency between them is usually the first thing a verifier questions.
Gross CO₂ per tonne cementitious
All Scope 1 emissions divided by total cementitious output — the master figure most benchmarks and customer disclosures reference.
Clinker factor
Ratio of clinker to finished cement; even small reductions here move the emissions number more than almost any other lever.
Thermal substitution rate
Share of kiln thermal energy supplied by alternative fuels rather than coal or petcoke.
Scope 2 electricity intensity
Purchased electricity emissions, calculated from meter readings against the applicable grid emission factor.
How the Data Actually Flows Into a Verified Number
The mechanics matter more than the dashboard skin, because a verifier is going to ask where each figure came from. The flow below is what a defensible system looks like in practice, from the meter on the kiln to the final reported figure.
1
Source data captured automatically. Fuel meters, weighbridges, LIMS calorific values, and production tonnage feed the system directly at the point of measurement.
2
Emission factors applied by fuel and process. Coal, petcoke, natural gas, and alternative fuels each carry a distinct factor, applied automatically rather than looked up manually.
3
Emissions attributed to product and shipment. Clinker factor and blend data split the total across product types, generating the per-shipment figure CBAM now requires.
4
Every number stays traceable. A verifier can trace any reported figure back to the specific meter reading, lab result, or work order that produced it.
Why Maintenance Belongs Inside the Carbon Ledger
The majority of a cement plant's Scope 1 emissions come from calcination chemistry, which no maintenance action changes directly. But the fuel efficiency of reaching and holding kiln temperature — and the electricity efficiency of grinding — are both maintenance-influenced, and both show up in the same emissions ledger once the two data sets are connected instead of living in separate systems.
Refractory condition
Degraded refractory raises heat loss through the kiln shell, requiring more fuel to hold the same clinkering temperature.
Combustion tuning
A burner running outside its design air-fuel ratio wastes thermal energy that shows up directly in Scope 1 fuel emissions.
Mill grinding efficiency
Liner wear and media condition raise specific power consumption, which raises Scope 2 electricity emissions per tonne of cement.
Fan and pneumatic losses
Worn dampers and duct leakage increase auxiliary electricity draw across the kiln and mill circuits, a smaller but persistent contributor.
Tracking emissions and maintenance in the same system means a rising CO₂-per-tonne trend can be traced back to a specific overdue inspection instead of ending in a vague note about "process variability" in the annual report. Book a demo to see how a maintenance event and an emissions deviation line up on the same dashboard.
Regulatory Frameworks the Software Should Map To
A cement plant rarely reports to just one standard, and re-deriving the same underlying data for each framework separately is exactly the kind of manual work automated tracking is meant to eliminate.
GHG Protocol Scope 1, 2, and 3 categorization for corporate disclosures
EU ETS Phase 4 monitoring, reporting, and verification requirements
CBAM embedded emissions reporting at the shipment and product level
ISO 14064 for third-party verified emissions inventories
CSRD asset-level Scope 1, 2, and 3 disclosure for EU-exposed producers
Buyer's Checklist Before You Sign
Before committing to a platform, walk the vendor through a specific scenario rather than a general product demo — the answers reveal whether the system was built for cement or adapted from a generic ESG tool.
Can it calculate embedded emissions for a single shipment, not just a monthly plant average
Does it ingest fuel meter and LIMS data automatically, or require manual CSV upload
Can every reported figure be traced back to its source record for an auditor
Does it connect emissions trends to maintenance records, or report the number in isolation
Can it produce CBAM, EU ETS, and ISO 14064 outputs from the same underlying dataset
What Implementation Actually Looks Like
The biggest risk in adopting carbon tracking software is treating it as a standalone project that competes with maintenance and production priorities for attention. The plants that get a working system fastest instead build it on top of data they already collect, in phases that each produce something usable on their own.
1
Map existing data sources. Identify every fuel meter, weighbridge, LIMS feed, and electricity meter already in use, and confirm which ones can feed the system automatically versus which still require manual entry.
2
Assign emission factors and build the calculation logic. Fuel types, clinker factor, and grid emission factors are configured once, against the plant's specific fuel mix and electricity supplier.
3
Run parallel with the existing spreadsheet for one reporting cycle. Comparing the automated figure against the manual one for a full quarter builds confidence before the spreadsheet is retired.
4
Connect maintenance records to the emissions dashboard. Once the baseline is trusted, kiln, mill, and combustion maintenance data are linked so drift can be traced to a specific asset and inspection history.
Most cement plants can complete the first two phases within six to eight weeks using data they already collect, which is faster than most teams expect from a carbon reporting initiative — the delay in most failed projects comes from waiting to integrate every possible data source before going live, rather than starting with what already exists and expanding from there. A plant with three fuel types and one electricity meter has a far simpler configuration than one running six alternative fuel streams and multiple grid connections, so the timeline should be scoped against the plant's actual fuel and metering complexity rather than a generic vendor estimate.
Common Mistakes That Slow Down Adoption
A handful of avoidable missteps account for most stalled carbon tracking projects in cement plants, and recognizing them ahead of time saves months of rework and repeated data cleanup.
Treating it as IT-only
A system configured without input from process and maintenance teams rarely captures the right emission factors or asset mapping on the first attempt.
Skipping the parallel-run period
Retiring the spreadsheet before confirming the automated figures match invites disputes with auditors later, when it's harder to reconcile the gap.
Ignoring Scope 2 grid factor updates
Grid emission factors change periodically; a system that hardcodes an old factor understates or overstates electricity emissions until someone notices.
Leaving maintenance data out
A system that reports the number but never links it to kiln or mill condition can describe the problem but never explains a sudden increase.
Frequently Asked Questions
What makes carbon tracking software specific to cement, rather than generic ESG software?
Cement emissions are dominated by clinker chemistry rather than energy use, so the software needs clinker factor, SCM blending, and kiln fuel tracking built in as core data types — capabilities a generic ESG platform typically treats as an afterthought or omits entirely.
Why does CBAM require shipment-level emissions instead of a plant average?
CBAM's definitive phase calculates embedded emissions from actual plant data once a facility has reported for a full cycle, replacing default benchmark values with per-shipment figures that vary with the actual fuel mix and clinker factor used to produce that batch.
Can a spreadsheet still work for a smaller cement plant?
It can for annual, plant-wide reporting, but it breaks down quickly once shipment-level detail or quarterly cadence is required.
Start free to see the automated alternative.
How does maintenance data actually reduce reported emissions?
It doesn't change the number directly, but it explains and corrects the drift — a refractory or combustion issue flagged early avoids weeks of elevated fuel-driven emissions before the next report, and gives the sustainability team a concrete action instead of an unexplained variance.
What should a plant do first if it currently has no digital carbon tracking?
Start by connecting existing fuel meters, LIMS, and production data into one system rather than building a parallel carbon-only project.
Book a demo to map your current data sources.
Stop Reconciling Carbon Numbers by Hand Every Quarter
Connect fuel meters, lab data, and maintenance records into one auditable emissions ledger — built for CBAM, EU ETS, and ISO 14064 reporting from the same underlying dataset.