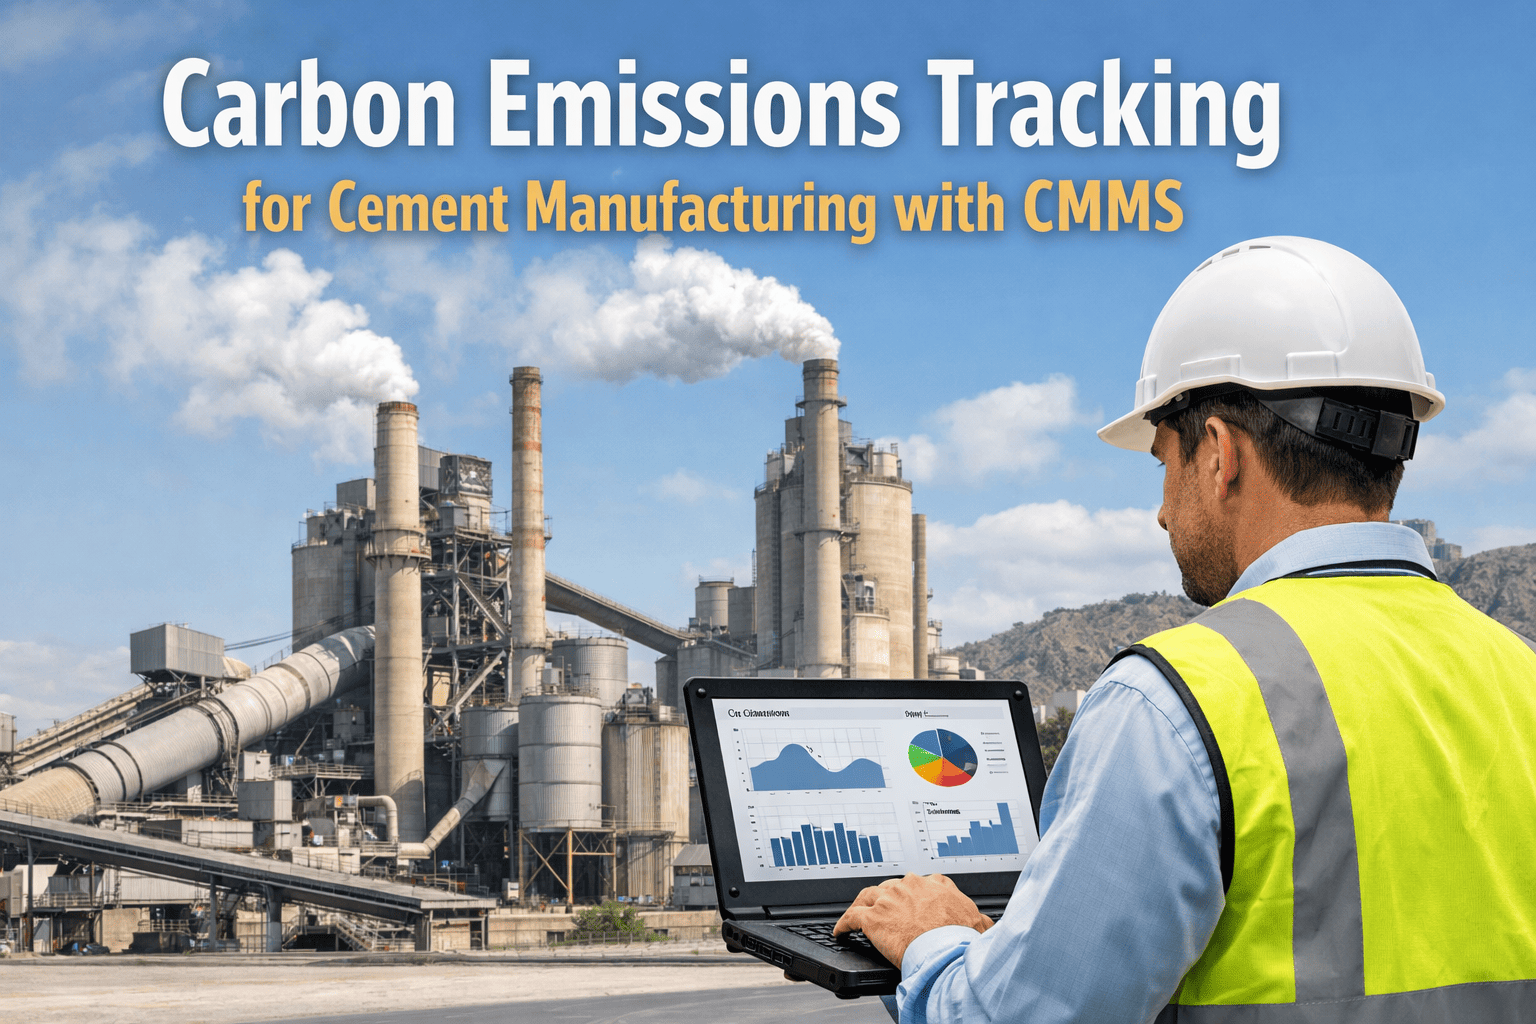
Cement is responsible for roughly 8% of global CO2 emissions, and the regulatory environment around that fact is hardening fast. The EU ETS Phase 4 has free allowances declining year on year, CBAM moved into its definitive phase on 1 January 2026, the US EPA Part 98 reporting programme covers every operating cement plant, ISO 14064 is becoming a procurement prerequisite, and CSRD now requires asset-level Scope 1, 2, and 3 disclosure for any cement producer with EU exposure. Most plants still build their annual carbon report from a patchwork of fuel ledgers, electricity bills, raw mix logs, and emails — a process that produces inconsistent numbers every year and creates audit risk at exactly the moment when regulators are tightening their verification standards. This page gives you a structured Scope 1, 2, and 3 reporting template built for cement plant operations — mapped to GHG Protocol, ISO 14064, EU ETS, EPA Part 98, and CBAM in a single workflow — and you can book a demo to see how OxMaint converts maintenance and operational data directly into carbon reporting evidence.
Sustainability Toolkit · Cement Plant CMMS · Scope 1/2/3 Reporting
Cement Plant Carbon Emissions Reporting Template — Scope 1, 2, and 3 Across GHG Protocol, ISO 14064, EU ETS, EPA Part 98, and CBAM
A complete carbon reporting framework written for cement plant sustainability leads, environmental managers, and plant directors. Maps every emission source in a cement plant to the correct scope, the correct reporting standard, and the correct verification evidence — so your annual carbon disclosure becomes a structured workflow instead of a year-end fire drill.
8%
share of global CO2 emissions attributed to the cement industry alone
~60%
of a cement plant's Scope 1 emissions come from limestone calcination, not fuel
<10%
share of cement plant emissions typically falling under Scope 2 from purchased electricity
15
GHG Protocol categories of Scope 3 — cement producers must screen all of them
The Three Scopes — Cement Plant Edition
What Scope 1, Scope 2, and Scope 3 Actually Mean Inside a Cement Plant Fence Line
Generic GHG Protocol guidance does not tell you which kiln, mill, or silo your emissions belong to. The infographic below maps the three scopes onto the physical reality of a cement plant — from the limestone in the quarry to the bag of cement leaving the dispatch yard.
SCOPE 1
Direct Emissions — Inside Your Fence Line
~85–90% of total cement plant emissions
Process Emissions — Calcination
CaCO3 decomposes to CaO + CO2 in the kiln. Roughly 0.54 tCO2 per tonne of clinker. The single largest source in any cement plant.
Stationary Fuel Combustion
Coal, petcoke, alternative fuels, natural gas, and biomass burned in the kiln main burner, calciner, and dryers.
Mobile Combustion On-Site
Quarry trucks, loaders, dozers, mobile cranes, and forklifts running on diesel or gasoline owned by the plant.
Fugitive Emissions
SF6 from switchgear, refrigerants from chillers, methane from waste-derived fuel storage. Small but mandatory to report.
SCOPE 2
Indirect Energy — Imported Across the Fence Line
Typically under 10% of total emissions
Purchased Grid Electricity
The dominant Scope 2 source. Powers raw mill, cement mill, packing line, ID fans, conveyors, lighting, and offices.
Purchased Heat or Steam
Less common at standalone cement plants but applies to integrated sites or plants drawing district heat or industrial steam.
Location-Based vs Market-Based
GHG Protocol requires both methods. Location uses grid average factors; market uses contractual instruments and PPAs.
Renewable Energy Certificates
PPAs, RECs, GOs, and on-site solar must be documented per market-based reporting rules with retirement evidence.
SCOPE 3
Value Chain Emissions — Upstream and Downstream
15 categories — all must be screened for relevance
Cat 1 — Purchased Goods & Services
Largest Scope 3 category for cement: imported clinker, gypsum, slag, fly ash, raw additives, packaging materials.
Cat 3 — Fuel & Energy-Related
Upstream emissions of the fuels and electricity already counted in Scope 1 and 2 — extraction, refining, transmission losses.
Cat 4 & 9 — Transportation
Inbound raw materials and outbound cement and clinker — rail, road, sea, and barge logistics legs.
Cat 11 — Use of Sold Products
Concrete carbonation over building lifetime — increasingly material for cement Scope 3 inventories per GCCA guidance.
Standards & Frameworks
Five Carbon Reporting Frameworks That Apply to Cement Plants — and What Each One Asks For
Most cement producers report under more than one framework. The same emission data is structured differently for each one, and an audit-ready template has to translate between them. The five cards below summarise the frameworks your sustainability team is most likely facing in 2026.
FW 01
GHG Protocol
Corporate Standard + Scope 3 Standard + Cement Sector Guidance
The global baseline. WBCSD published cement-specific Scope 3 guidance covering all 15 categories. GCCA released an updated Scope 3 document in 2024 for member testing.
Scope coverage: 1, 2, 3
FW 02
ISO 14064
Part 1 quantification — Part 2 projects — Part 3 verification
The international audit standard. Increasingly required by procurement teams, lenders, and investors as the verifiable layer over self-declared GHG Protocol inventories.
Scope coverage: 1, 2, 3 + verification
FW 03
EU ETS Phase 4
Mandatory MRV — Monitoring, Reporting, Verification
Cement installations submit verified annual emissions and surrender allowances. Free allocation declining on a legislated schedule, reaching zero by 2034.
Scope coverage: Scope 1 only
FW 04
EU CBAM
Definitive phase from 1 January 2026
Cement is on the original CBAM list. Importers into the EU need verified embedded emissions per product code. Non-EU producers must supply auditable Scope 1 data.
Scope coverage: Product-level Scope 1
FW 05
US EPA Part 98
Greenhouse Gas Reporting Program — Subpart H
Every US cement plant reports annually. Subpart H covers calcination CO2; combustion emissions reported separately. Verified data feeds national inventory.
Scope coverage: Scope 1, US-specific
FW 06
CSRD & CDP
Corporate Sustainability Reporting Directive + CDP Climate
CSRD demands asset-level Scope 1, 2, and 3 with double-materiality assessment. CDP scores producer transparency annually and feeds investor decision making.
Scope coverage: 1, 2, 3
From Maintenance Data to Carbon Evidence
OxMaint Already Captures the Operational Data Your Carbon Report Has to Cite
Fuel consumption logs, kiln runtime, electricity sub-meter readings, alternative fuel substitution rates, refractory campaign data — the same operational data that drives your CMMS is the verification evidence your carbon report needs. A 30-minute walkthrough shows you exactly how to convert maintenance records into audit-ready Scope 1, 2, and 3 inventories.
The Emission Source Sheet
A Working Source Inventory — What to Measure, How to Quantify It, Where to Get the Data
The table below is the operational backbone of a cement plant carbon report. Each row is an emission source; each column is the answer your verifier will ask for. Scroll horizontally on mobile to see every column. OxMaint maps directly onto this table — every fuel meter, runtime log, and material consumption record is captured at source and ready for export.
The Reporting Workflow
From Operational Data to Verified Carbon Report — A 6-Stage Workflow Cement Plants Can Actually Run
A defensible carbon report is not built in November when the auditor arrives. It is built continuously through the operating year. The six stages below structure that work into a calendar your sustainability team can hand to plant operations without ambiguity.
01
Define Operational & Organisational Boundaries
Equity share or operational control. List every kiln, mill, and asset in scope. Document JV ownership, leases, and decommissioned units. Boundary sign-off by finance and sustainability.
02
Map Emission Sources to Scopes & Frameworks
Run the source sheet above against every asset. Tag each source with its scope, its applicable framework, and the responsible data owner. Identify Scope 3 categories deemed material.
03
Capture Activity Data Continuously
Fuel meters, weighbridges, sub-meters, lab NCV results, refractory campaign data, AF biogenic fractions — all logged in CMMS or DCS with timestamped, named-asset attribution and immutable audit log.
04
Apply Emission Factors & Quantify
Plant-specific factors preferred; default IPCC and national factors as fallback with documented justification. Recalculate quarterly, not annually. Maintain factor change log for re-statement requirements.
05
Internal QA & Source-Specific Quality Checks
Generic checks on data handling and calculation. Source-specific checks on boundaries and assumptions. Cross-checks against material balance, energy balance, and prior-year ratios.
06
External Verification & Disclosure
ISO 14064-3 verification, EU ETS verifier audit, EPA Part 98 third-party verification, CDP submission, CSRD disclosure. Evidence pack exported with documented chain of custody.
Common Reporting Errors
Six Mistakes That Cement Plant Carbon Reports Routinely Make — and How to Avoid Them
Audit findings on cement plant carbon reports cluster around the same six structural issues. Each one is a process problem, not a measurement problem — and each one is preventable if the reporting template forces the right discipline at source.
Error 01
Treating calcination CO2 as a fuel calculation
Process CO2 from limestone is independent of fuel. Both must be calculated separately and added — using clinker production and raw-mix assay, never inferred from fuel consumption.
Error 02
Mixing biogenic and fossil alternative fuels
Biogenic carbon is reported separately and excluded from total Scope 1 in most frameworks. RDF, tyres, and biomass blends need lab-determined biogenic fractions documented per shipment.
Error 03
Reporting Scope 2 with only one method
GHG Protocol Scope 2 Guidance requires both location-based and market-based reporting. Plants reporting only one expose themselves to re-statement and audit qualifications.
Error 04
Skipping Scope 3 category screening
All 15 categories must be screened for relevance even if most are not reported. A documented screening with reasoned exclusions is required for audit and CDP scoring.
Error 05
No documented data hierarchy
EU ETS, CBAM, and ISO 14064 all require a documented preference order: measured, calculated from measured, default. Reports without this hierarchy lose verifier confidence quickly.
Error 06
Year-end reconstruction from invoices
Building the inventory backwards from fuel invoices in Q1 of the next year produces gaps verifiers can immediately identify. Continuous capture during the operating year is the only audit-defensible approach.
Expert Perspective
What Cement Plant Sustainability and Environmental Managers Are Saying
Rated 5 / 5
Before we restructured our reporting, every January was a scramble. Three people would chase weighbridge tickets, AF lab reports, and electricity sub-meter exports across the plant for six weeks. After moving to a continuous-capture workflow mapped to GHG Protocol and EU ETS in parallel, the same report comes together in about a week and the verifier finds far fewer queries to chase. The biggest gain was treating maintenance data as a primary input rather than an afterthought.
AS
Anika Schäfer, Dipl.-Ing.
Sustainability & Environmental Manager, Central European Cement Group · 14 yrs MRV and ISO 14064
Rated 5 / 5
CBAM exposed how thin our Scope 1 evidence was at the product level. EU ETS reporting works at installation level, but CBAM needs embedded emissions per CN code. We rebuilt our source map to track clinker output and fuel mix at kiln-line granularity, with maintenance downtime windows attributed correctly. That single change cleaned up about 11% of unexplained variance in our previous reports and made the CBAM declarations defensible the first time we filed them.
DC
Diego Castillo, MBA, GRI-Certified
Group Carbon Compliance Lead, Latin American Integrated Cement Producer · 17 yrs environmental reporting
Rated 4 / 5
The Scope 3 category screening was where we underestimated work the most. Cement producers tend to assume Cat 1 and Cat 4 are everything, but supplier-specific emission factors for clinker imports and alternative raw materials moved our reported Scope 3 number by close to 9% once we replaced default factors with EPDs. That kind of restatement gets uncomfortable in front of an investor audience if you discover it late. Catching it inside a structured template is much safer.
PN
Priya Narang, IEMA Practitioner
Plant Environmental Manager, South Asian Cement Producer · 19 yrs CDP and CSRD disclosure
Frequently Asked Questions
Cement Plant Carbon Reporting — Common Questions Answered
Can the template be exported as Excel, Word, or PDF for our sustainability disclosure pack?
Yes. The Scope 1, 2, and 3 source sheet, framework mapping, and workflow stages on this page export cleanly into Excel tabs, Word reporting templates, and PDF distribution copies.
Book a demo and we will share the editable working files.
How does OxMaint feed maintenance and operational data directly into the carbon report?
Fuel feed totals, runtime hours, refractory campaign data, sub-meter readings, AF substitution rates, and refrigerant top-ups all live in OxMaint as named-asset records.
Start a free trial to see the evidence-pack export against Scope 1 and 2.
Do we need to report Scope 3 if we are not yet subject to CSRD?
CDP scoring, investor questionnaires, and supplier procurement requests increasingly demand Scope 3. Even without CSRD trigger, screening all 15 categories with documented exclusions is the GHG Protocol standard and a future-proofing investment.
How is CBAM reporting different from our existing EU ETS reporting?
EU ETS reports installation-level totals; CBAM requires product-level embedded emissions per CN code. Cement producers exporting to the EU need verified per-tonne emissions for clinker and finished cement separately — a finer granularity than ETS demands alone.
What is the recommended verification path — internal, second-party, or ISO 14064-3 third-party?
For EU ETS, accredited verifier under MRR is mandatory. For voluntary disclosure, ISO 14064-3 third-party assurance is the highest credibility tier.
Book a demo to align your evidence pack with verifier requirements.
Cement Plant Carbon Reporting Template · OxMaint Sustainability Toolkit
Stop Rebuilding Your Carbon Inventory Every January — Capture the Data Continuously, Report It Defensibly
The Scope 1, 2, and 3 reporting template on this page gives your sustainability team the structure. OxMaint gives you the operational data feed underneath it — fuel meters, runtime logs, alternative fuel rates, sub-meter readings, refractory campaigns, and refrigerant logs — all tagged to named assets with audit-ready chain of custody. Walk the platform first, then build the reporting template around the data you can already prove.