Carbon Emission Tracking in Cement Plants: Digital Solutions
By Samuel Jones on February 27, 2026
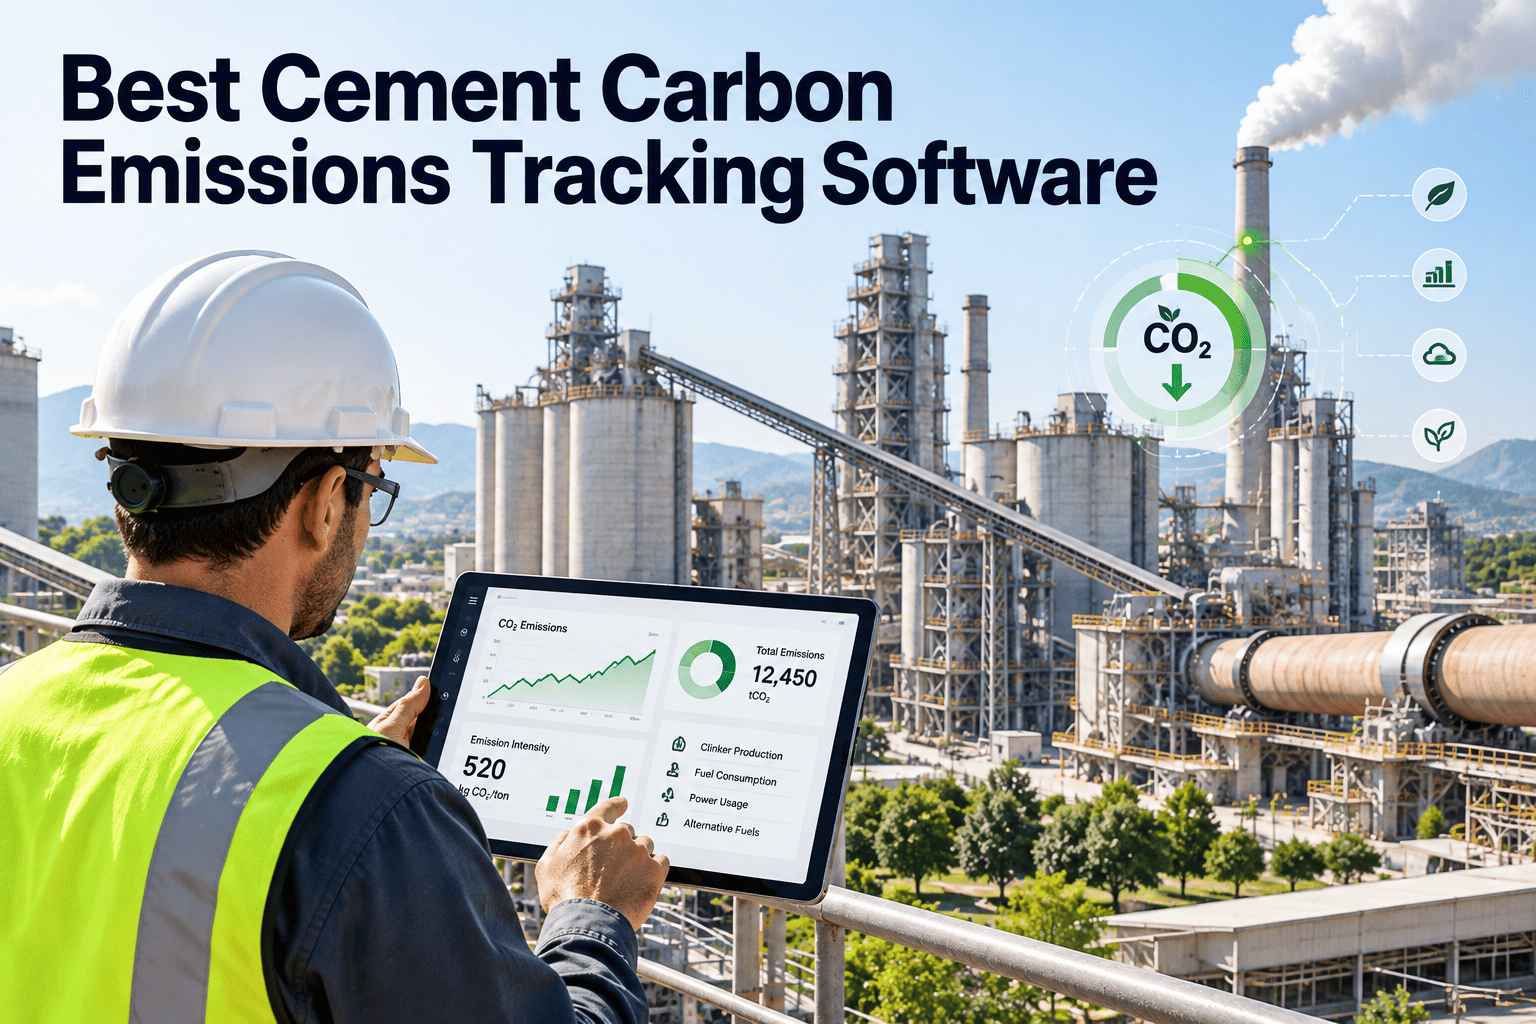
Cement manufacturing is responsible for approximately 8% of global CO₂ emissions — more than aviation and shipping combined. A single cement plant producing 1.5 million tonnes of clinker annually emits roughly 1.2-1.4 million tonnes of CO₂ per year. With carbon pricing now a reality across the EU, UK, Canada, and expanding to new jurisdictions annually, the cost of carbon is no longer theoretical — it's a line item that can exceed $50 million per year per plant under the EU ETS. Yet most cement producers still track emissions using spreadsheets, annual calculations, and backward-looking reports that arrive months after the emissions occurred. By the time you know your carbon intensity spiked in Q2, you've already shipped the product and booked the carbon liability. Digital emission tracking changes this equation entirely — providing real-time CO₂ per tonne visibility that enables operational decisions to reduce carbon alongside cost.
The Carbon Scale of Cement
8%
of global CO₂
Cement
4.1 Gt
CO₂ per year
Industry total
0.6 t
CO₂/t cement
Global avg
More than aviation (2.5%)More than shipping (2.2%)3rd largest industrial emitter
Where Cement CO₂ Comes From: The Emission Source Map
Unlike most industries where emissions come primarily from energy use, cement has a unique challenge: approximately 60% of its CO₂ comes from the chemical process itself (calcination of limestone), not from fuel burning. This means energy efficiency alone can never achieve net-zero — the chemistry must change.
SCOPE 1 — Process
Calcination (CaCO₃ → CaO + CO₂)
The decomposition of limestone releases CO₂ as a fundamental chemical product. At 525 kg CO₂ per tonne of clinker, this is unavoidable with current chemistry. The only ways to reduce it: lower clinker factor, alternative raw materials, or carbon capture.
~525 kg CO₂ / t clinker
SCOPE 1 — Fuel
Kiln Fuel Combustion
Burning coal, petcoke, natural gas, or alternative fuels to heat the kiln to 1,450°C. Fuel-related emissions vary by fuel type: coal ~95 kg CO₂/GJ, natural gas ~56, biomass ~0. This is where energy optimization and AF substitution have the most impact.
~250-330 kg CO₂ / t clinker
SCOPE 2
Purchased Electricity
Grid electricity for mills, fans, conveyors. ~90-120 kWh/t cement. Carbon intensity depends entirely on grid mix.
~30-60 kg CO₂ / t cement
SCOPE 3
Transport & Supply Chain
Upstream transport, mining, and downstream distribution. Increasingly required in full lifecycle assessments and ESG reporting.
~30-50 kg CO₂ / t cement
The 60% problem: Because the majority of cement CO₂ is from chemistry rather than energy, the cement industry cannot follow the same decarbonization playbook as power or transport. Tracking must separate process emissions from fuel emissions to identify which levers actually work.
Track CO₂ Per Tonne in Real Time — Not Quarterly
OXmaint links kiln operating data, fuel consumption, and clinker production to calculate real-time carbon intensity — visible on the same dashboard as your maintenance KPIs.
The Regulatory Landscape: Carbon Rules Tightening Globally
Carbon regulation for cement is accelerating worldwide. Plants that aren't tracking emissions digitally will face compliance gaps, financial penalties, and market access restrictions within 2–5 years.
ACTIVE NOW
EU Emissions Trading System (ETS)
Free allowances for cement phasing down to zero by 2034. Current carbon price: €65-100/tonne CO₂. At 0.8 t CO₂/t cement, a 2 Mt/yr plant faces €50-80M annual carbon cost at full exposure. Requires verified MRV annually.
HIGH IMPACT€50-80M/yr exposure for large plants
ACTIVE NOW
EU CBAM (Carbon Border Adjustment Mechanism)
Importers of cement into the EU must declare embedded carbon and purchase CBAM certificates matching EU ETS price. Transitional reporting started 2023; full financial adjustment from 2026. Forces non-EU producers to track and report carbon intensity.
HIGH IMPACTAffects ALL cement exporters to EU
2025-2028
India PAT Scheme / Carbon Market
Perform, Achieve and Trade scheme mandates energy intensity targets. India's domestic carbon market launching 2025-2026 with cement as a priority sector. Will require plant-level emission tracking and reporting.
HIGH IMPACTWorld's 2nd largest cement producer
2025-2027
UK ETS / UK CBAM
UK carbon market operating independently post-Brexit with similar free allowance phase-down. UK CBAM announced for 2027 implementation. Carbon price tracking close to EU levels at £50-80/tonne CO₂.
MEDIUM IMPACTMirrors EU trajectory
2028-2035
Global CBAM Expansion
Australia, Canada, Japan, South Korea, and Brazil all exploring or implementing carbon pricing with cement included. Within 10 years, most major cement markets will have some form of carbon cost. Plants without digital tracking will struggle to comply.
HIGH IMPACTUniversal carbon pricing by 2035
The 8 Carbon KPIs Every Cement Plant Must Track
You can't reduce what you don't measure. These are the essential emission KPIs that digital tracking systems must calculate in real time, not retrospectively in annual reports.
01
Gross CO₂ per Tonne of Cementitious Product
Target: <550 kg CO₂/t
The master KPI. Includes all Scope 1 emissions divided by total cementitious material produced. Best-in-class: 500-550; industry average: 600-650.
02
Clinker Factor
Target: <0.70
Ratio of clinker to cement. Every 1% reduction in clinker factor reduces CO₂ by ~8 kg/t. Blended cements achieve 0.55-0.70 vs. OPC at 0.92-0.95.
03
Thermal Substitution Rate (TSR)
Target: >30%
% of kiln thermal energy from alternative fuels. Every 10% increase in biomass TSR reduces net CO₂ by ~25 kg/t clinker. Best plants exceed 80%.
04
Specific Energy Consumption (SEC)
Target: <3,100 MJ/t clinker
Thermal energy per tonne of clinker. Every 100 MJ/t reduction saves ~8-10 kg CO₂/t depending on fuel mix.
05
Scope 2 Emission Intensity
Target: <40 kg CO₂/t cement
CO₂ from purchased electricity. Depends on grid carbon intensity. WHR and renewable PPAs can reduce to near-zero.
06
Fuel Mix Carbon Factor
Target: <85 kg CO₂/GJ
Weighted average emission factor. Coal=~95, petcoke=~100, natural gas=~56, biomass=~0. Shows carbon impact of fuel switching in real time.
07
Absolute Emissions (Annual)
Target: YoY reduction
Total tonnes CO₂ per year. Required for EU ETS, GHGRP. Captures production volume effects alongside intensity changes.
08
Carbon Cost Exposure
Target: Minimize & forecast
(Total emissions - Free allowances) × Carbon price. Digital tracking enables daily forecasting of year-end carbon liability.
Calculate Your Carbon Cost Exposure in Real Time
OXmaint's emission dashboard shows daily CO₂ intensity alongside your maintenance and production data.
The Decarbonization Roadmap: From 600 to Near-Zero
Decarbonizing cement is a multi-decade journey with distinct phases. Each phase has specific levers, capital requirements, and emission reduction potential.
PHASE 1: NOW — 2027
550 → 480 kg CO₂/t
-40 kg
Clinker factor reduction (blended cements)
-25 kg
Alternative fuel substitution to 30-50% TSR
-15 kg
Kiln thermal efficiency optimization
-10 kg
Electrical efficiency + waste heat recovery
Capital: $5-15M | Payback: 2-4 years | Prerequisite: Digital tracking system
PHASE 2: 2027 — 2033
480 → 350 kg CO₂/t
-50 kg
LC3 (Limestone Calcined Clay Cement) at scale
-40 kg
AF substitution to 60-80% TSR (biomass dominant)
-20 kg
Renewable electricity + green PPAs
-20 kg
Novel clinker chemistries (belite cements)
Capital: $20-80M | Payback: 4-7 years | Prerequisite: Product standard updates
When Maintenance Failures Increase Carbon Emissions
Every unplanned kiln stop, every efficiency loss from worn equipment, every hour of suboptimal combustion adds CO₂ to your annual total. The link between maintenance performance and carbon performance is direct and quantifiable.
Unplanned Kiln Stop
+150-300 t
CO₂ per event
Cold startup requires 50-150 tonnes of fuel to reheat. None produces clinker — pure waste CO₂. Two extra stops/yr add 300-600 tonnes.
Worn Cooler Grate Plates
+800-2,000 t
CO₂ per year
Poor heat recovery reduces secondary air temp, forcing higher fuel consumption. A 50°C drop = ~5 kcal/kg extra.
Preheater False Air Leaks
+1,500-4,000 t
CO₂ per year
5-8% false air wastes 15-25 kcal/kg clinker. For 1.5 Mt/yr plant: 22,500-37,500 GJ wasted fuel producing zero-value CO₂.
Distorted flame causes incomplete combustion and excess fuel. A simple burner swap cuts 5-8 kcal/kg immediately.
Total Maintenance-Related Carbon Waste
+5,000-12,000 t
CO₂ per year per plant
At €80/tonne CO₂, deferred maintenance costs €400K-€960K/year in carbon liability alone — before fuel cost, production losses, or equipment damage.
Plants that track equipment condition and carbon performance in the same CMMS can quantify the emission impact of every deferred maintenance item. Sign up for free and start linking maintenance data to your carbon footprint.
Make Carbon a Maintenance KPI
Join 2,000+ facilities tracking efficiency and emissions alongside work orders. Free forever for small teams.
What is the average CO₂ emission per tonne of cement?
The global average is approximately 0.6 tonnes of CO₂ per tonne of cement (600 kg CO₂/t), but varies significantly. Best-in-class plants producing blended cements achieve 500-550 kg CO₂/t, while plants producing high-clinker OPC with coal fuel can exceed 800 kg CO₂/t. The GCCA Roadmap targets 520 kg CO₂/t by 2030 as an industry average.
Why can't cement reach zero carbon through energy efficiency alone?
Because approximately 60% of cement CO₂ comes from the calcination reaction (CaCO₃ → CaO + CO₂), not from burning fuel. This process emission is a fundamental chemical product of converting limestone to lime. The only pathways: reducing clinker in cement (lower clinker factor), alternative raw materials requiring less calcination, or capturing CO₂ before it enters the atmosphere (CCS/CCU).
What is CBAM and how does it affect cement producers?
The Carbon Border Adjustment Mechanism (CBAM) is an EU regulation requiring importers of cement to purchase certificates matching the EU carbon price for embedded emissions. This extends EU carbon pricing to imports, preventing "carbon leakage." For producers exporting to the EU, CBAM means accurately tracking plant-level carbon intensity. Lower CO₂/t = lower cost; higher intensity = significant penalty.
How does a CMMS help with carbon emission tracking?
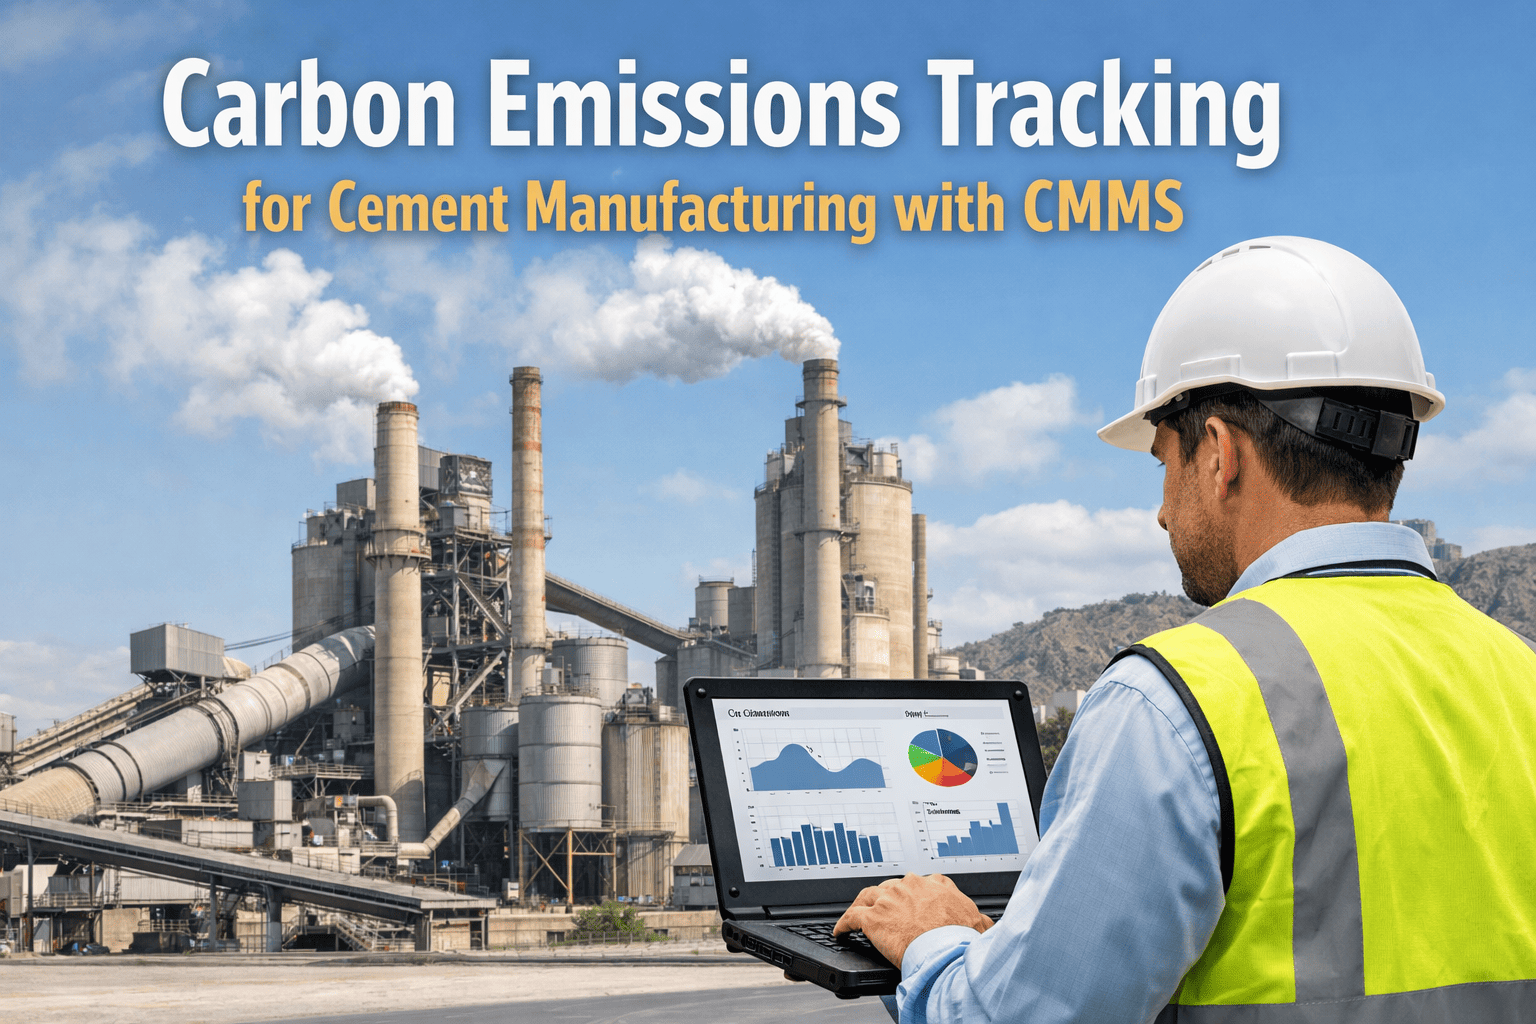
A CMMS connects operational data that drives emissions — fuel consumption, kiln running hours, clinker production, equipment efficiency — with maintenance events. When a preheater seal replacement reduces false air by 3%, the CMMS correlates that event with the resulting decrease in SEC and CO₂ intensity, creating a continuous feedback loop that quantifies maintenance actions in carbon terms.
What is clinker factor and why is it the most important lever?
Clinker factor is the ratio of clinker to total cementitious product. Reducing it from 0.90 to 0.70 reduces process emissions by ~22% — without any changes to kiln operations, fuel type, or capital investment. The remaining 30% comes from supplementary materials (fly ash, slag, calcined clay, limestone). It's the fastest, cheapest, and most impactful decarbonization lever available today.
What does real-time carbon monitoring look like in practice?
Real-time monitoring combines continuous data feeds from kiln operations (fuel flow rates, clinker production, power consumption) with emission factors for each fuel type and process emission calculations based on raw mix chemistry. The system calculates CO₂ per tonne on an hourly or shift basis, displayed on operational dashboards alongside production and quality KPIs — enabling same-day corrective action rather than waiting for quarterly reports.