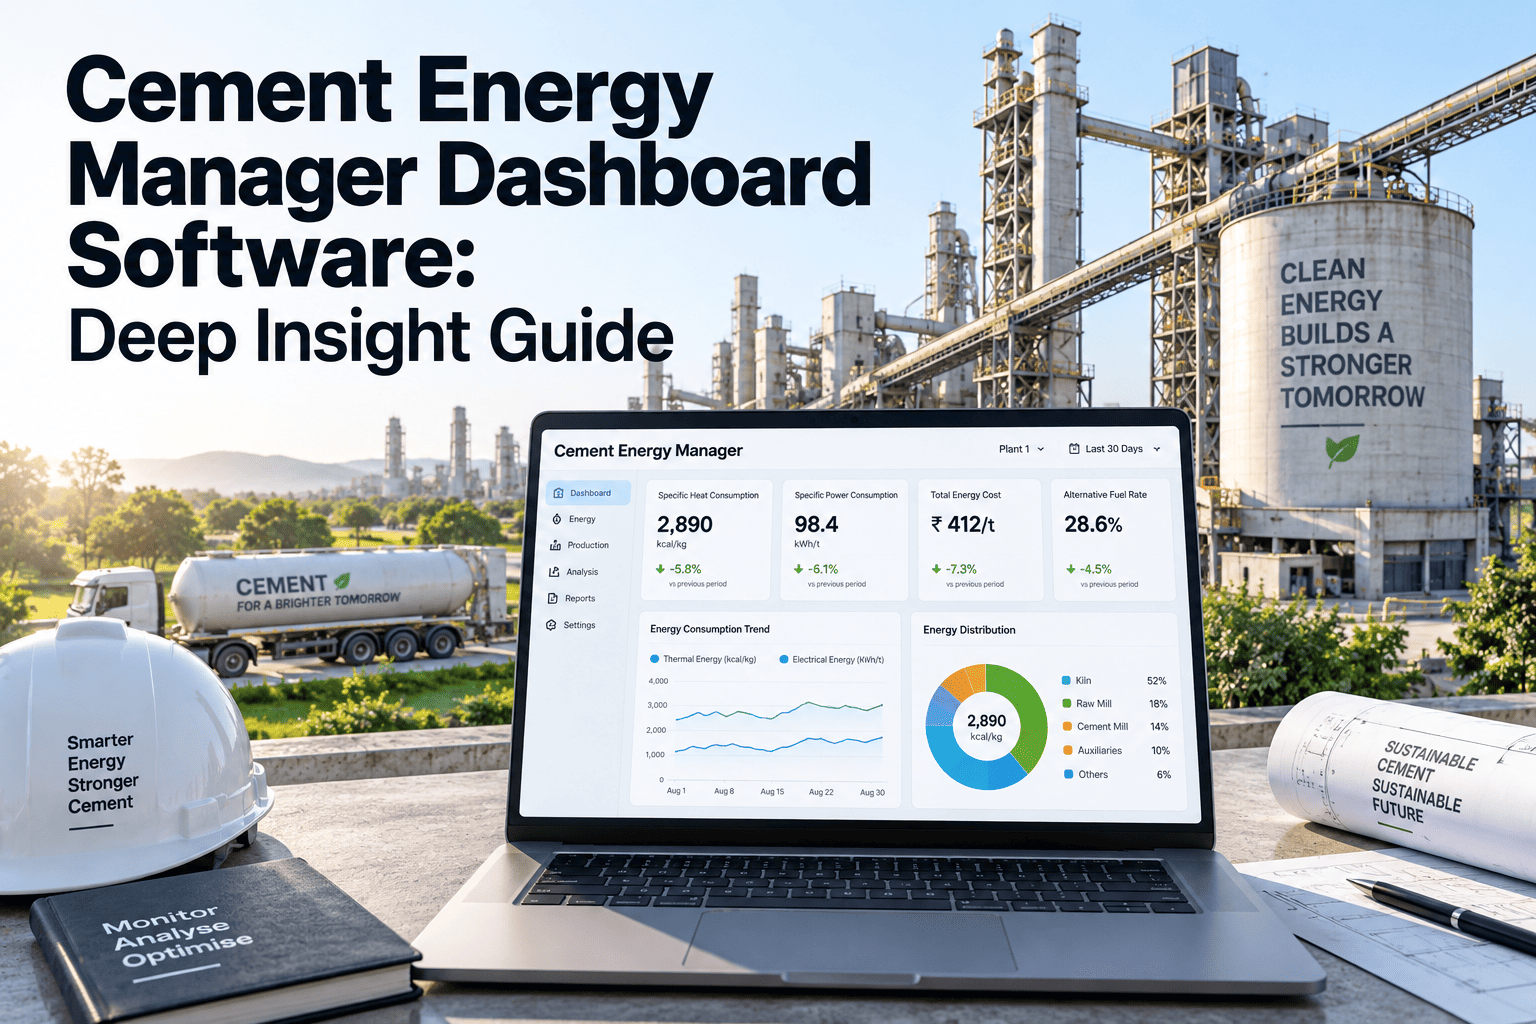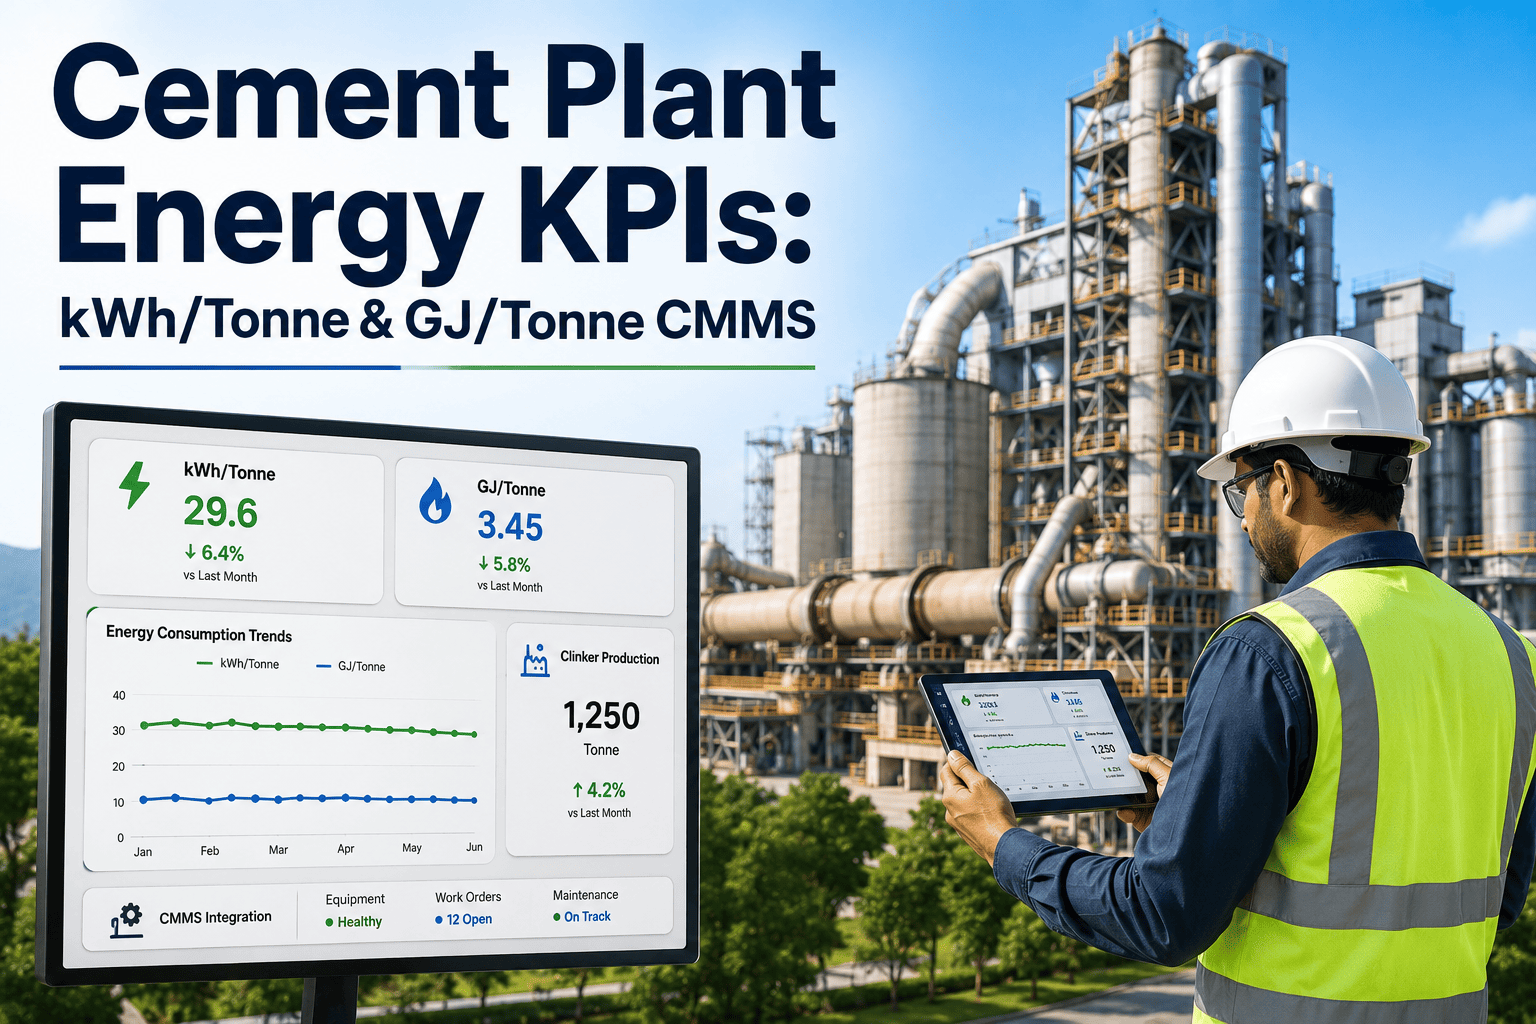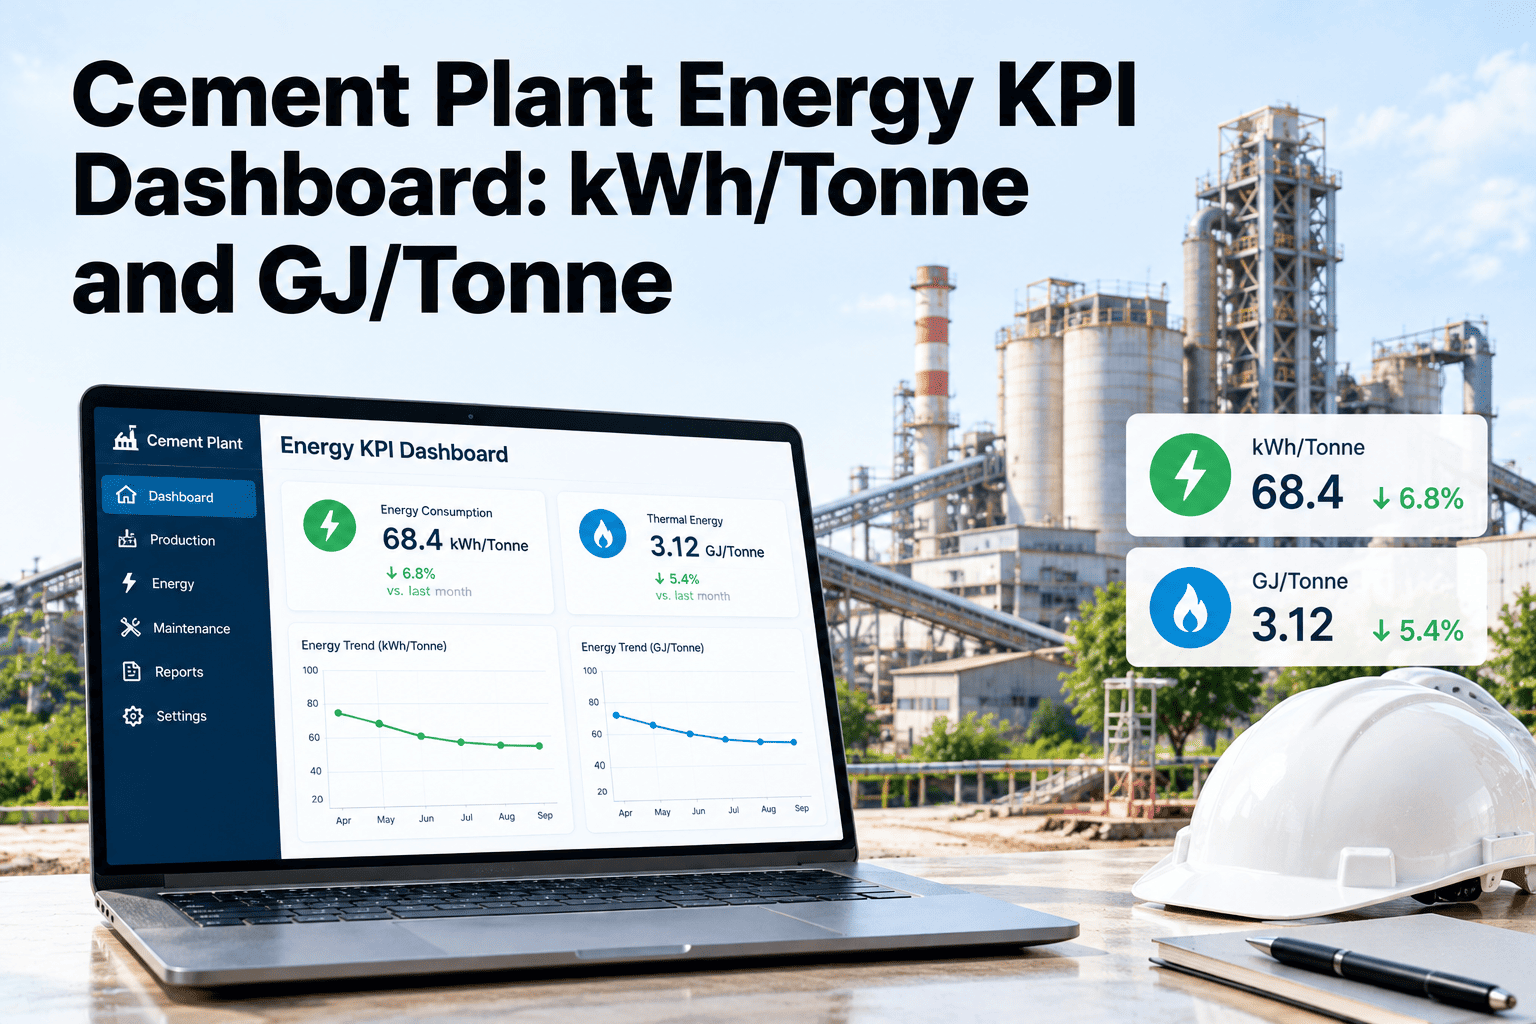
Energy is one of the largest controllable costs in cement, yet many plants still review it as a monthly total that arrives long after the shift that caused a problem. Two numbers do most of the work: electrical energy in kWh per tonne and thermal energy in GJ per tonne of clinker. When those figures sit beside equipment condition and open work orders, a rising trend can be traced to a worn part or a missed task. That connection is what Oxmaint dashboards, work orders and asset history add to an energy KPI view.
Energy Optimization for Cement Plants
Cement plant energy KPI dashboard: kWh per tonne and GJ per tonne tied to maintenance action
See specific electrical and thermal energy by process area, spot drift against your own baseline and route the cause into inspections and work orders.
Define The Numbers
The energy KPIs every cement plant should agree on first
Energy dashboards lose credibility when two departments calculate the same KPI differently. Fix the formula, unit and denominator before building any chart.
| KPI | Formula | Unit | Watch out for |
|---|---|---|---|
| Specific thermal energy | Fuel heat input divided by clinker produced | GJ per tonne of clinker, or MJ per kg | Fuel heating value changes and alternative fuel share |
| Specific electrical energy, cement | Total plant electricity divided by cement produced | kWh per tonne of cement | Product mix, fineness and clinker factor |
| Section electrical energy | Section meter reading divided by section output | kWh per tonne of raw meal, clinker or cement | Meter boundaries and shared consumers |
| Specific power of a machine | Machine power divided by throughput | kWh per tonne | Running versus idling hours in the denominator |
| Energy per stop event | Energy used during start-up and shutdown | GJ or kWh per event | Stops hidden inside daily averages |
A useful unit conversion
One kWh equals 3.6 MJ, so one GJ equals about 278 kWh. Thermal energy in GJ per tonne of clinker is numerically the same as MJ per kg of clinker, which helps when comparing across plants that report in different units.
Dashboard Design
Three layers that take a manager from plant total to failing part
A single plant-wide number cannot tell a maintenance team where to look. Layer the dashboard so each view answers the next question.
Plant view
Specific thermal and electrical energy against target, with production volume and product mix beside them so context is visible.
Process section view
Raw mill, kiln and preheater, clinker cooler, cement mill, coal mill and packing, each with its own kWh or GJ per tonne trend.
Asset view
Major motors, fans, separators and compressors with specific power, condition data, open work orders and recent maintenance history.
Fair Comparison
Normalizing energy KPIs so a bad number really means a bad process
Raw kWh per tonne moves for reasons that have nothing to do with equipment health. Without normalization, the dashboard raises false alarms and hides real ones.
- Compare cement mills at similar product type and fineness, since finer grinding uses more energy
- Track clinker factor separately, because more clinker per tonne of cement changes the totals
- Show alternative fuel share beside GJ per tonne so fuel changes are visible
- Separate stable running hours from start-up, stop and idle periods
- Use the same time period for energy and production so the ratio is not skewed
Check the denominator
Production tonnage often comes from weighfeeders, belt scales or stock changes with different accuracy. A drifting scale can look like an energy problem, so include meter and scale calibration in the maintenance plan.
Where Energy Leaks
Maintenance conditions that show up as higher energy per tonne
Many energy losses are equipment condition problems in disguise. This table links common conditions to the KPI they move and the maintenance response.
| Condition | Where it appears | Effect on KPI | Maintenance response |
|---|---|---|---|
| False air ingress at kiln seals, preheater and ducts | Kiln, preheater and fan circuit | Higher fan power and higher GJ per tonne | Seal inspection, duct and expansion joint repair |
| Coating buildup or blockages in cyclones | Preheater tower | Higher draft demand, unstable kiln feed | Cleaning routines and pressure trend checks |
| Worn mill liners, diaphragms or grinding media | Raw and cement mills | Higher kWh per tonne for the same fineness | Wear measurement and planned replacement |
| Separator wear or poor adjustment | Mill circuit | Excess recirculating load, extra power | Inspect rotor, vanes and seals |
| Fan damper losses or worn impellers | ID fans, cooler fans, mill fans | More power for the same airflow | Vibration, wear and control checks |
| Compressed air leaks | Whole plant | Wasted compressor power | Leak surveys with tracked repairs |
| Damaged refractory and shell hot spots | Kiln and cooler | Heat loss, higher fuel use | Shell scan follow-up and repair planning |
| Bearing friction, misalignment, poor lubrication | Motors, drives, conveyors | Higher specific power on drive trains | Alignment checks and lubrication routes |
Connect KPI To Action
Send every energy drift to the crew that can fix it
Oxmaint turns a rising kWh or GJ per tonne trend into an inspection task or corrective work order with asset history attached.
Section Drivers
What drives energy use in each part of a cement plant
Each process area consumes energy for different reasons. Knowing the drivers helps the team decide which condition data belongs beside each KPI.
Raw material and raw meal grinding
Grinding is a major electrical consumer. Specific power depends on material hardness and moisture, mill wear, separator settings and how consistently the mill is fed.
- Track kWh per tonne of raw meal alongside feed hardness changes
- Watch mill vibration and differential pressure for early signs of unstable operation
- Schedule liner and media inspections around measured wear rather than fixed calendar dates
Kiln, preheater and cooler
The kiln system drives thermal energy. Heat losses through the shell, false air and poorly recovered cooler heat all raise GJ per tonne of clinker, and unstable operation adds further loss.
- Combine GJ per tonne with kiln stops, since restarts consume extra fuel
- Follow shell temperature scans and refractory condition as part of the thermal KPI
- Check cooler grate and fan condition, which affect how much heat returns to the process
Cement grinding and packing
Cement mills often carry a large share of plant electricity. Product type, fineness target and additive use change the energy per tonne, so compare like with like before reacting.
- Report kWh per tonne by cement type, not only as a plant average
- Include separator and fan power in the mill circuit view
- Review idle running of packing and conveying equipment between shipments
Fans, compressors and utilities
Large fans and compressors run continuously, so small efficiency losses accumulate. They are good early candidates for specific power tracking because output and power are easy to measure.
Data Sources
Where the numbers come from and how to keep them trustworthy
A dashboard is only as reliable as its meters, scales and fuel data. Treat measurement equipment as maintained assets with their own schedules.
| Data source | Feeds which KPI | Reliability risk | Maintenance control |
|---|---|---|---|
| Electricity meters by section | kWh per tonne by area | Wrong boundary, missing or duplicated loads | Meter register and periodic verification |
| Fuel flow and heating value | GJ per tonne of clinker | Flow meter drift, uncertain calorific value | Calibration schedule and sampling routine |
| Weighfeeders and belt scales | Denominator for every KPI | Calibration drift, material buildup | Scheduled calibration and cleaning tasks |
| Process and condition sensors | Context and root cause | Faulty or uncalibrated channels | Sensor health checks and replacement records |
| Production and stock records | Tonnage and product mix | Late or manually adjusted entries | Defined reporting cut-off and review |
Alerting Rules
Setting energy alerts that maintenance teams will act on
Alert on sustained deviation from a normalized baseline, not on a single high reading. That keeps the list short enough to be taken seriously.
Information
Small deviation that is inside normal variation. Show it on the dashboard and review at the next planning meeting.
Investigate
Sustained deviation at comparable output. Create an inspection task for the section and check condition data.
Act
Large or growing deviation with supporting condition evidence. Raise a prioritized corrective work order.
Common dashboard mistakes
- Showing plant averages that hide one poorly performing machine
- Comparing months with different product mixes without adjustment
- Setting targets from the best day instead of a realistic baseline
- Reporting energy without linking any owner or work order
- Leaving meter and scale calibration outside the maintenance plan
Drift To Work Order
How an energy alert becomes a completed repair
A dashboard that only displays numbers leaves the next step to memory. Define the route from alert to closeout in advance.
Why It Matters
The operational case for tracking energy per tonne with maintenance data
Energy is both a cost line and a health signal. A machine that needs more power for the same output is usually telling you something about its condition.
- Energy is a large share of cement production cost, so small percentage gains matter at plant scale
- Specific energy trends often move before a failure becomes visible in vibration or temperature
- Carbon reporting and efficiency targets increasingly depend on credible energy data
- Maintenance teams gain a business language for justifying inspections and repairs
Energy as an early condition indicator
A fan drawing more current for the same flow, or a mill needing more power for the same fineness, points to wear, fouling or leakage. Watching specific power gives maintenance an extra signal without adding new sensors.
- Pair specific power with vibration and temperature for stronger evidence
- Look for step changes after maintenance to confirm repairs worked
- Record findings so each investigation improves the next one
Getting Started
A simple first-quarter plan for an energy KPI dashboard
Start with what you can measure reliably and expand once the team trusts the numbers.
Before And After
Monthly energy reports compared with a connected energy dashboard
The difference is timing and ownership. Connected data shows the shift that caused a problem and the task that addresses it.
Monthly report approach
- Totals reviewed weeks after the event
- Energy data held apart from maintenance history
- Causes debated without asset evidence
- Fixes tracked in email or meeting notes
Connected dashboard approach
- Deviation visible within the shift or day
- Energy view linked to asset condition and tasks
- Causes narrowed by section and machine
- Fixes tracked as work orders through closeout
Preventive Foundation
Preventive tasks that protect energy performance
Keeping energy KPIs stable is largely routine maintenance done on time. Schedule these tasks against the sections where they matter most.
Kiln and preheater
- Seal and expansion joint inspection
- Cyclone and duct buildup checks
- Shell scan follow-up actions
- Fuel feed system calibration
Grinding circuits
- Liner and media wear measurement
- Separator inspection and adjustment
- Weighfeeder and scale calibration
- Drive lubrication and alignment
Fans, air and utilities
- Impeller wear and damper checks
- Compressed air leak surveys
- Motor and drive efficiency checks
- Meter and sensor verification
Product Fit
What Oxmaint contributes to an energy KPI program
Oxmaint is the maintenance system behind the KPI view. Where energy and condition data are available to the platform, they sit beside the work that keeps those numbers healthy.
Asset management
A register of mills, fans, kilns and drives with history, so energy drift can be matched to repairs and changes.
Work orders and scheduling
Corrective and preventive tasks with owners, due dates and parts, driven by energy and condition findings.
Mobile inspections
Field checklists for leaks, seals, wear and lubrication, with photos and findings captured at the asset.
Reporting and dashboards
Views of open tasks, overdue preventive work and repeat issues by section, shared with operations and management.
Track The Program
Indicators that show whether energy work is paying off
Pair energy KPIs with maintenance indicators so you can see whether actions caused improvement.
FAQ
Cement energy KPI dashboard: common questions
What is kWh per tonne in cement?
It is electricity used divided by tonnes produced, reported for cement, clinker, raw meal or a specific machine.
What does GJ per tonne measure?
It measures the fuel heat used to make one tonne of clinker, and it is numerically equal to MJ per kg of clinker.
Why does energy per tonne change without any fault?
Product mix, fineness, clinker factor and fuel type all move it. Normalize before treating a change as a maintenance problem.
How does maintenance affect energy KPIs?
Wear, leaks, buildup and friction raise energy use. Oxmaint tracks the inspections and repairs that address them.
Can we start with only a few sections?
Yes. Start with the largest consumers, then expand. Book a demo to choose the first sections.
Make Energy Visible To Maintenance
Link kWh per tonne and GJ per tonne to the work that keeps them low
Bring energy trends, inspections and work orders into one maintenance workflow for your cement plant.