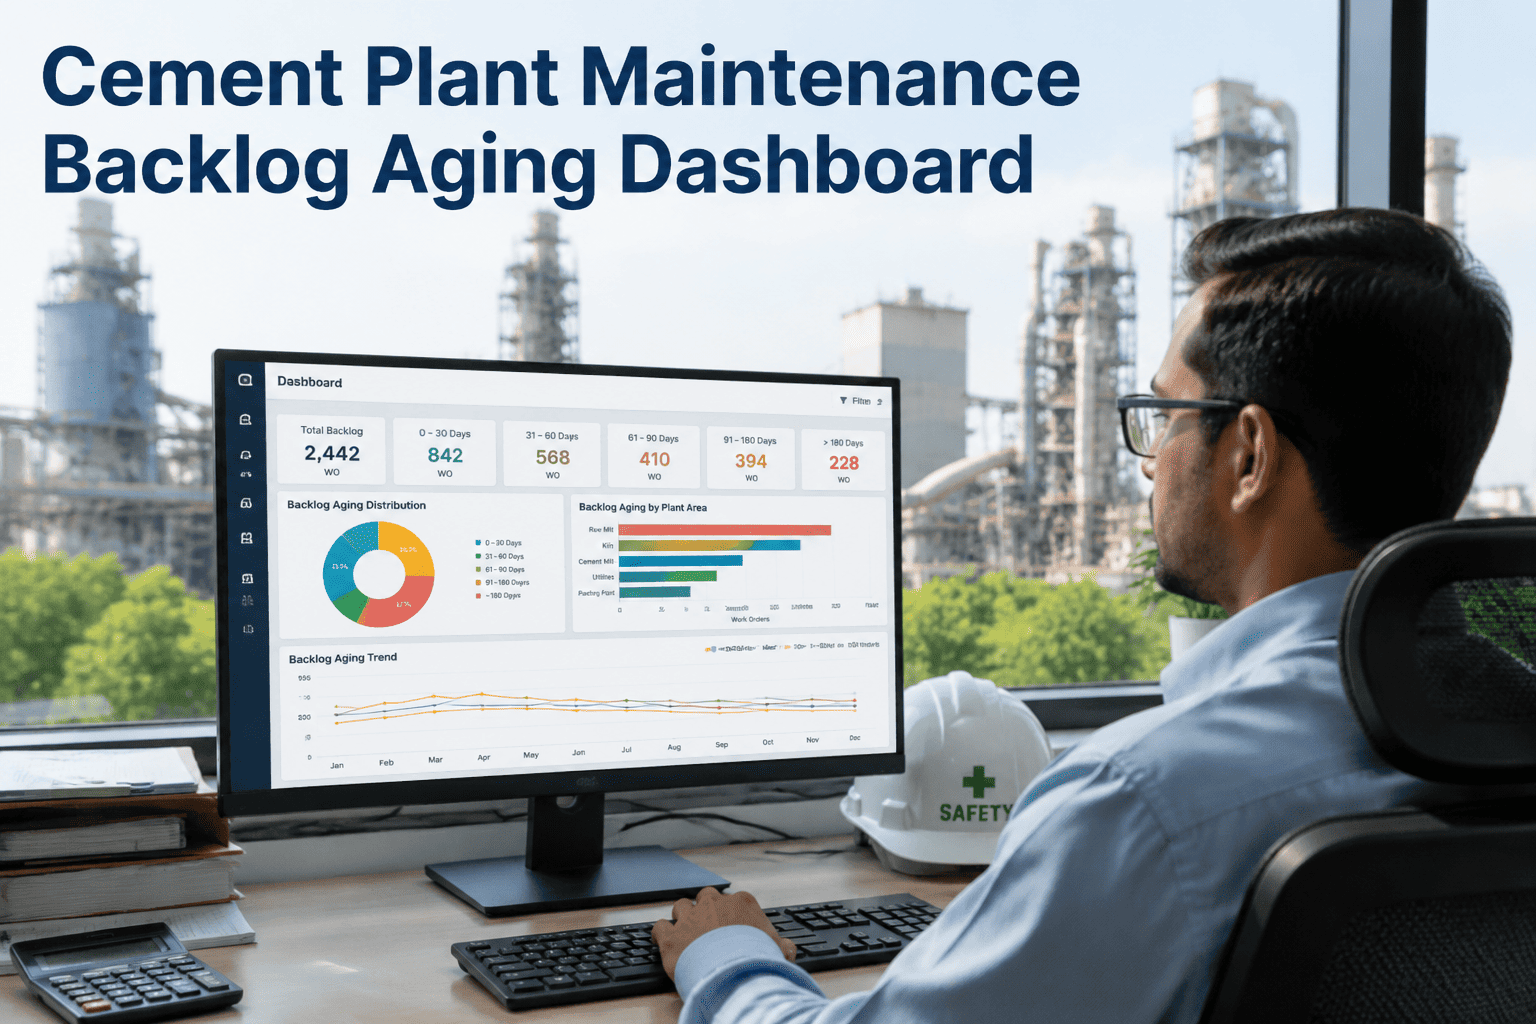
In a cement plant running 4,000 to 8,000 assets across a continuous pyroprocessing line, the maintenance backlog is rarely the problem people think it is. The number on the work order list is not the risk — the age distribution behind that number is. A backlog of 600 open work orders can be perfectly healthy if most sit in the 0–7 day bucket, or it can be a slow-moving production failure if a third of it has aged past 30 days. Industry data shows a growing 30+ day bucket predicts a surge in emergency breakdowns four to eight weeks later, as deferred preventive work converts into failures. A backlog aging dashboard exposes that hidden trajectory before it reaches the kiln. OxMaint's analytics layer turns your raw open work order queue into a live aging view that shows exactly where the risk is concentrating — and who has the capacity to clear it.
Cement Plant Maintenance Backlog Aging Dashboard
How aging buckets, overdue PM exposure, asset risk scoring, and technician capacity come together in one live view — so backlog stops being a number on a list and becomes a managed program.
The Aging Spine — Reading Backlog by Bucket, Not by Count
A single backlog count tells you nothing about risk. The same total can be healthy or dangerous depending on how the work orders are distributed across age. A backlog aging dashboard groups every open work order into time buckets and color-codes the danger zone — the moment the 30+ and 90+ buckets start to swell, the dashboard is warning you about breakdowns that have not happened yet.
The dashboard updates the moment a technician closes a work order on mobile — there is no overnight batch, no export-and-refresh cycle. A planner reviewing the rail on Monday morning sees the same picture the technician created on the plant floor minutes ago.
Backlog vs. Capacity — The Number That Actually Matters
Counting open work orders measures demand. It says nothing about whether your team can clear them. The real metric is Work Order Backlog in weeks — total estimated labor hours in the queue divided by realistic weekly wrench-time capacity. SMRP and IFMA both place the healthy band at two to four weeks. The trap most plants fall into is using a 40-hour week as capacity, ignoring that technicians spend 20–30% of time on meetings, travel, and admin.
OxMaint calculates backlog weeks automatically from work order estimates and your real crew capacity — including a configurable wrench-time multiplier so the number reflects reality, not a 40-hour fiction. Start a free trial and import your first 100 work orders in under an hour, or book a 30-minute demo to see the aging dashboard on cement plant data.
Overdue PM Exposure — Where Aging Backlog Becomes Failure
Not all aged work orders carry the same consequence. A cosmetic corrective job sitting 40 days in queue is low risk. An overdue preventive maintenance task on a kiln drive bearing is a countdown timer. The backlog aging dashboard separates corrective backlog from overdue PM exposure and ranks the PM gaps by the criticality of the asset they protect — because a missed PM on a critical asset is the single clearest predictor of the next unplanned stop.
| Asset Class | Overdue PM Window | Asset Risk Score | Predicted Consequence If Deferred |
|---|---|---|---|
| Rotary kiln drive & gearbox | 11 days overdue | Critical · 94 | Bearing degradation undetected; $200K+ unplanned stop within 3–6 weeks |
| Vertical roller mill | 8 days overdue | Critical · 88 | Vibration trend deviation becomes replacement, not correction |
| Preheater cyclone & fans | 19 days overdue | High · 71 | Buildup-driven throughput loss; out-of-spec clinker risk |
| Clinker cooler grate | 23 days overdue | High · 67 | Performance throttling feeds quality deviation downstream |
| Baghouse filter / packing line | 31 days overdue | Medium · 44 | Emissions compliance exposure; absorbable in scheduled window |
When PM compliance drops below 85% on critical asset classes, the dashboard flags it before the breakdown — not after the morning production meeting reports the loss. Plants holding PM compliance above 85% and reactive work below 35% reliably shrink their backlog over time; below those thresholds the queue grows regardless of overtime spend.
Technician Capacity — Matching Work to the People Who Can Clear It
A backlog dashboard that shows aging but not capacity is only half a picture. The other half is workload balance: is one crew buried under 7 weeks of work while another sits at 1.5 weeks of capacity to spare? The dashboard maps backlog hours against each crew's available wrench-time so planners redirect work before aging accelerates — not after a supervisor complains.
See Your Backlog the Way It Actually Behaves
OxMaint turns your open work order queue into a live aging dashboard — buckets by age, overdue PM exposure ranked by asset risk, and backlog mapped against real technician capacity. Stop reacting to the count. Start managing the trajectory.
The Phantom Backlog — Why Your Real Number Is Smaller Than the Dashboard Shows
Before a plant adds technicians or panics over a 7-week backlog, the aging dashboard does something a spreadsheet cannot: it strips out the work that was never real backlog in the first place. Audits across industrial facilities consistently find that 12–18% of open work orders are duplicates, and within twelve months 20–30% describe problems already fixed during unplanned shutdowns but never closed in the system. A backlog that looks like a crisis often shrinks 20–40% in the first structured review.
This is why OxMaint's onboarding includes a structured backlog audit in the first ten days — the cleanup itself is part of the value, and it works best on messy legacy data. Teams routinely cut their open work order count by half once the phantom items are purged and the real, scored, schedulable queue is left standing.
Frequently Asked Questions
Stop Reading Your Backlog as a Number. Start Reading It as a Forecast.
OxMaint's AI analytics turn your open work order queue into a live aging dashboard — buckets by age, overdue PM exposure ranked by asset risk, phantom backlog stripped out, and every hour mapped against the technicians who can clear it. See the next breakdown coming before it reaches the kiln.