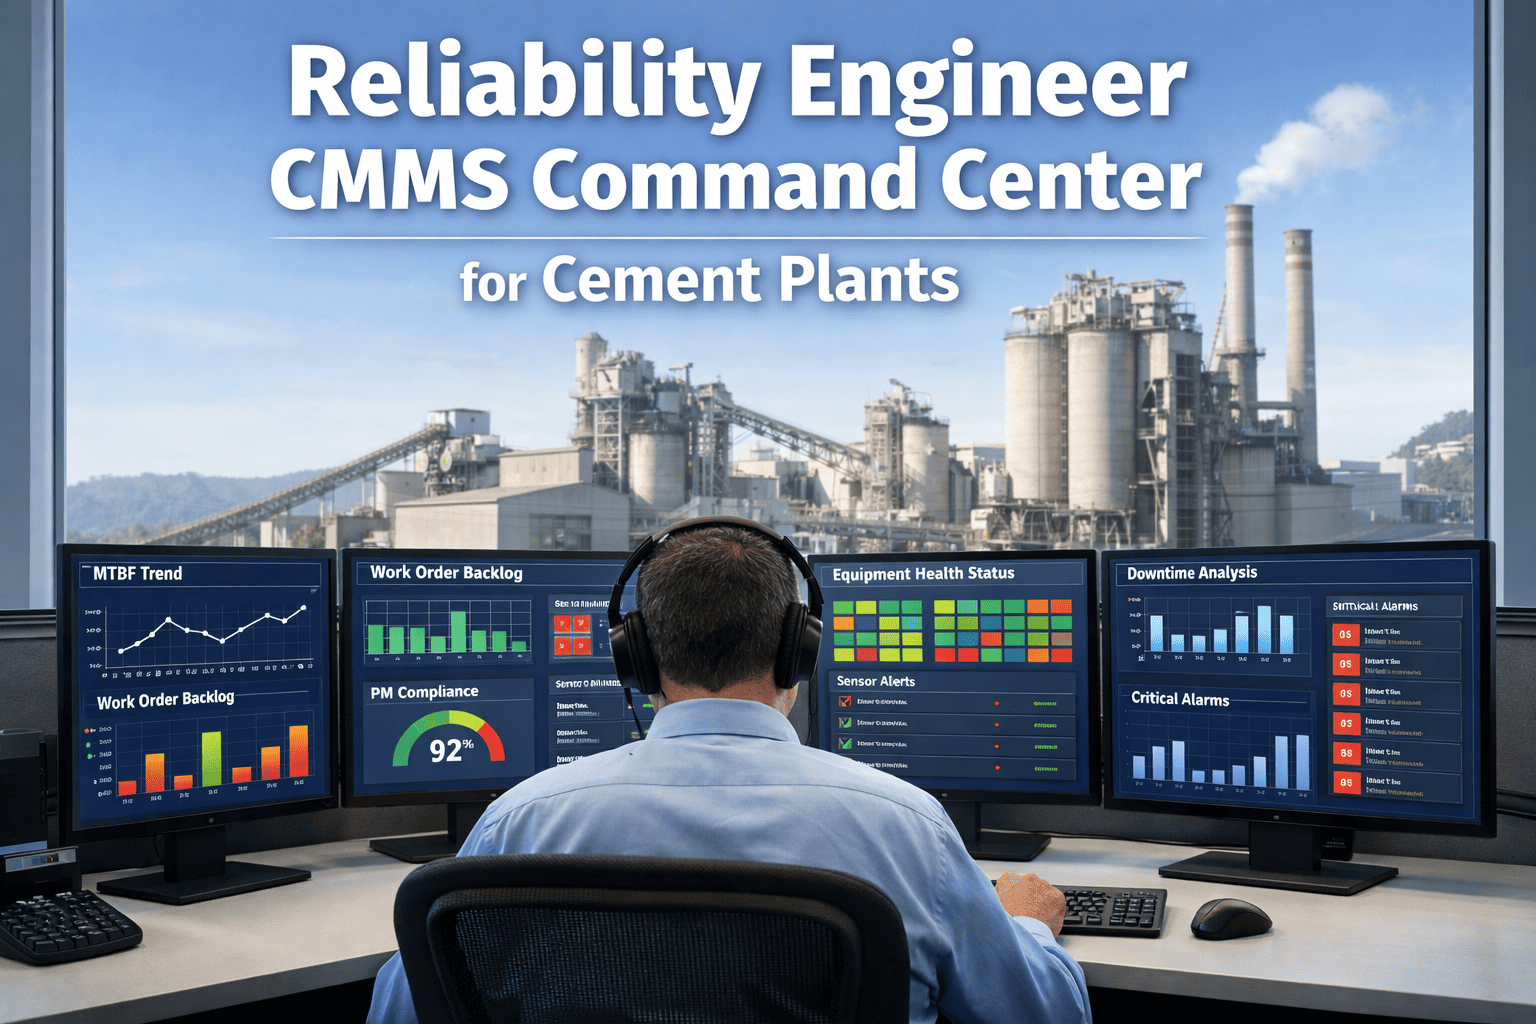
A cement plant reliability engineer opens their laptop on a typical Monday morning and starts stitching together a picture of plant health from seven different places — the CMMS for work order status, a SCADA historian for vibration trends, a shared Excel file for MTBF by asset, a PDF dump of last week's PM compliance rates, a vendor portal for sensor health, an email chain about spare parts lead times, and a whiteboard in the control room for shutdown planning. This is not a workflow problem. This is a visibility problem — and it is the reason why 84% of unplanned cement plant failures had early warning signals that never made it in front of the person who could have acted on them. A reliability engineer's command center is the single screen that replaces those seven tabs with one live view of every asset, every metric, every backlog, and every sensor trend that matters — the way a flight deck replaces a row of disconnected gauges. To see what a reliability command center looks like mapped to a real cement plant hierarchy, book a 30-minute walkthrough.
Reliability Engineer · Command Center · Cement Plant CMMS
The CMMS Command Center Built for the Cement Plant Reliability Engineer
Stop stitching together MTBF trends, work order backlogs, PM compliance, and sensor alerts from seven different tools. One live dashboard. Every asset. Every KPI. Every device.
7+Separate tools reliability engineers check daily before consolidation
84%Of unplanned failures show early warning signals nobody sees in time
44%Avg PM compliance in cement plants using manual scheduling
68%Reduction in unplanned kiln stops within 12 months of live MTBF tracking
The Reliability Engineer's Morning — Before the Command Center
The work of a cement plant reliability engineer is diagnostic. They ask one fundamental question every morning: which asset is most likely to cause my next unplanned stop? Answering that question requires four inputs that live in four different systems. Reliability engineers spend the first hour of every workday gathering those inputs — manually.
Tab 1
Legacy CMMS
Open work orders by asset, backlog age
Export to CSV, pivot in Excel, re-sort weekly
Tab 2
SCADA historian
Vibration, bearing temp, motor current trends
Separate login, no cross-asset view, alerts emailed
Tab 3
Shared Excel file
MTBF and MTTR per asset class
Updated monthly at best, often two versions
Tab 4
PDF reports
PM compliance by crew, by asset category
Week-old data, no drill-down, no filter
Tab 5
Vendor sensor portal
Online/offline status of vibration monitors
Separate contract, separate login, separate alerts
Tab 6
Email chain
Spare parts availability and lead times
Buried in threads, not tied to asset or work order
Tab 7
Control room whiteboard
Planned shutdown slots, outage windows
Physical only, no remote access, photographed by shift
The Four Panels Every Reliability Engineer Actually Needs
A command center is not a dashboard with more widgets. It is a dashboard with the correct four panels, each answering a specific reliability question, each updating in real time, each drillable from plant level to individual bearing. Below is the panel architecture OxMaint deploys for cement plant reliability teams.
Panel 01
Which assets are degrading?
MTBF Trend Map
Live MTBF per asset class — kiln, raw mill, cement mill, clinker cooler, preheater, crusher, main fans — with 3-month, 6-month, and 12-month trend lines. Red flags any asset where MTBF has declined for two consecutive months. Target: 2,000+ hrs for kiln, 1,500+ hrs for mills, 3,000+ hrs for auxiliary.
Fed by: Work order closure data + failure event classification
Panel 02
What work is slipping?
Backlog Aging Board
All open work orders bucketed by age — 0–7 days, 8–14 days, 15–30 days, 30+ days — and by priority. Color-coded by asset criticality. Alerts when PM work orders exceed their scheduled compliance window. Target: 85%+ PM compliance, less than 10% of backlog in 30+ day bucket.
Fed by: Open work order queue + PM schedule + asset criticality
Panel 03
What are the sensors saying?
Sensor Health Wall
Every vibration, temperature, current, and ultrasonic monitor on the asset register — showing online status, last successful reading, and whether the signal is trending toward a threshold. Auto-generates a condition-based work order when any parameter breaches its alarm band.
Fed by: IoT sensors + OPC-UA from SCADA + historian rollups
Panel 04
Where is the spend going?
Planned vs Reactive Ratio
Live split of work order spend and hours between planned PM, condition-based, and reactive emergency work. Shown per crew, per asset class, and plant-wide. Target: 80%+ planned. Every rising reactive percentage flags where reliability is losing ground before MTBF shifts show it.
Fed by: Work order type classification + labour hours + parts cost
CMMS Command Center · OxMaint
Stop Rebuilding Your Reliability View From Seven Tools Every Monday.
OxMaint brings MTBF trends, backlog aging, sensor health, and planned-vs-reactive ratio into one live view — auto-populated from your work orders, SCADA feeds, and PM schedule. The work you used to do in an hour now happens in one glance.
The KPI Table Every Cement Reliability Engineer Should Have on One Screen
These are the six KPIs that determine whether a cement plant reliability programme is improving or quietly drifting backward. The benchmarks below reflect industry data for continuous-process cement operations. The intervention column is what a good command center prompts the reliability engineer to do the moment a number turns.
| KPI |
Industry Average |
World-Class Target |
Dashboard Signal When |
First Intervention |
| MTBF (kiln) |
800–1,400 hrs |
2,000+ hrs |
Declining 2 months in a row |
RCA on last 3 failure events |
| MTTR (critical assets) |
6–8 hrs |
Under 3 hrs |
Rising above 10 hrs |
Audit parts staging + diagnosis SOP |
| PM Compliance |
44% |
85%+ |
Any asset class under 80% |
Review scheduler load + reassign |
| Planned vs Reactive |
55% reactive |
Under 20% reactive |
Reactive trending up weekly |
Check PM backlog + sensor alerts |
| Backlog Age (30+ days) |
25–40% |
Under 10% |
Over 15% aged 30+ days |
Escalate to planning + re-prioritize |
| Maintenance cost / T clinker |
$5–$7 |
$2.50–$4.00 |
Trending up for 2+ months |
Drill into top 5 cost assets |
Benchmarks reflect typical cement plant operations across global data sets. Plant-specific targets should reflect asset age, fuel mix, and production portfolio.
From Signal to Action — The Command Center's Five Reflexes
A command center earns its name by connecting what the reliability engineer sees to what happens next. These five automatic reflexes are what separate a dashboard that reports from a dashboard that operates. For a walkthrough of the reflex chain configured on your actual asset hierarchy, start a free trial.
R1
MTBF drop detected
A declining MTBF trend on a tagged asset auto-creates an RCA task assigned to the reliability engineer, pre-loaded with the last three failure events and repair history.
R2
Sensor threshold breach
When vibration, bearing temperature, or motor current crosses an alarm band, a condition-based work order is drafted with parts, skills, and priority pre-populated.
R3
PM compliance slip
Any asset class dropping below its PM compliance target triggers a planner review task with the list of overdue PMs and their age.
R4
Reactive ratio rising
A rising reactive percentage on any crew or asset class flags a reliability health notification before the MTBF lag indicator catches up.
R5
Backlog aging over threshold
Work orders crossing a defined age trigger escalation notifications to the maintenance planner and reliability lead, with asset criticality weighting applied.
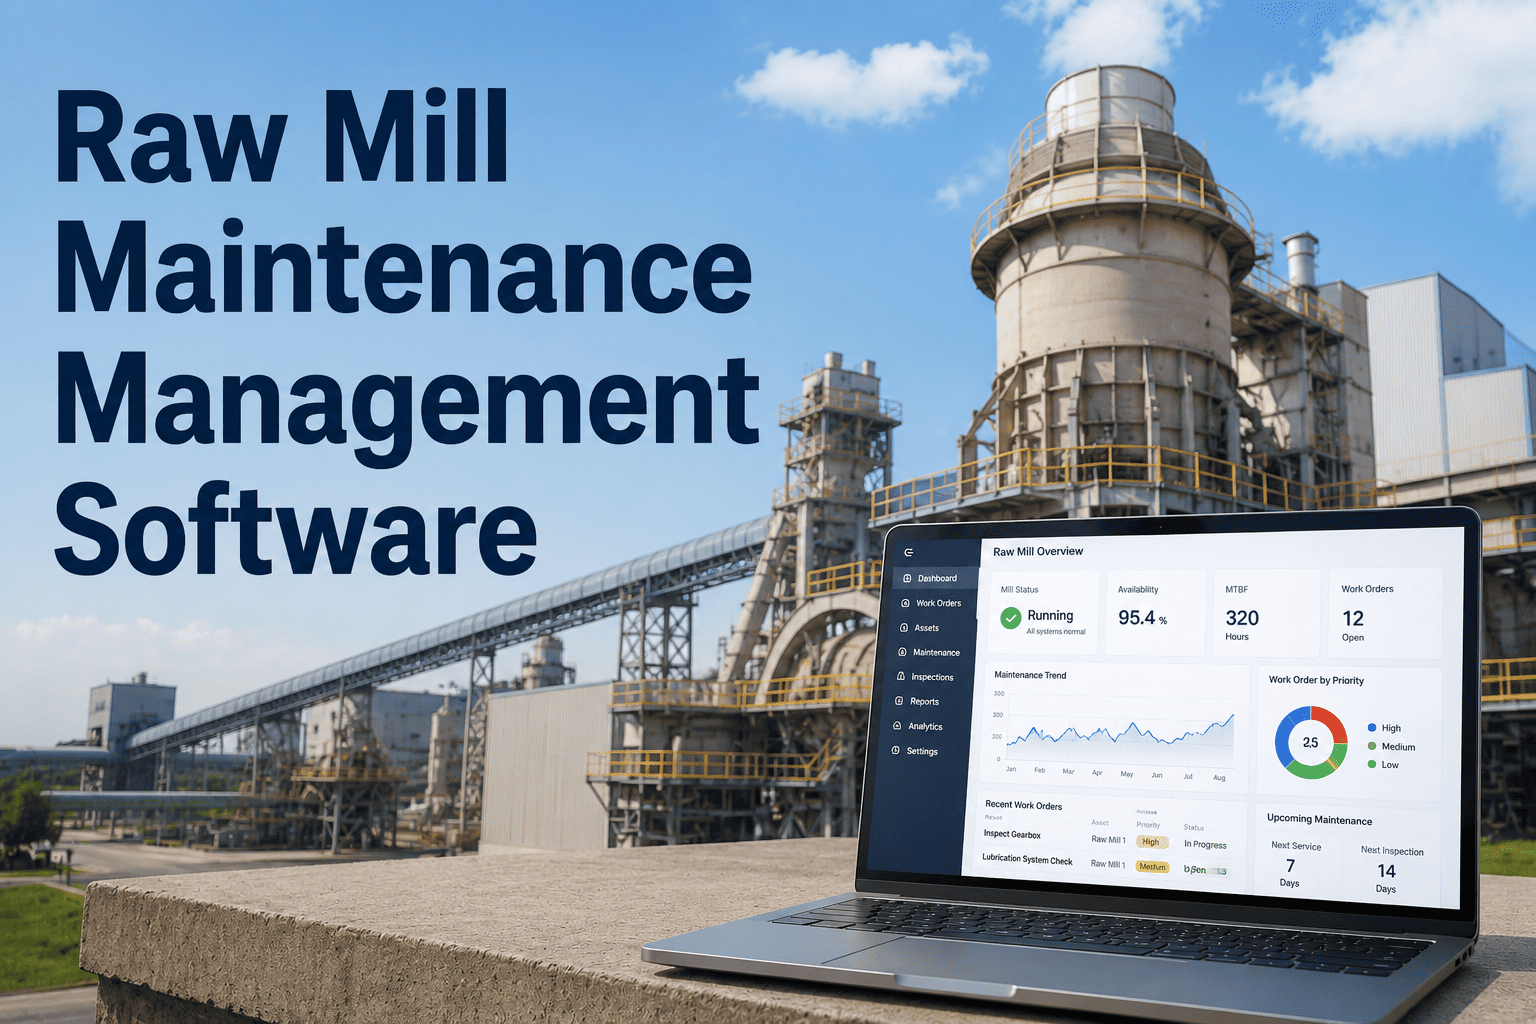
Device Continuity — Same View, Desk to Walkdown
A reliability engineer does not sit at a desk all day. They walk the kiln line, they climb the preheater, they crouch under the girth gear. The command center has to follow them. OxMaint renders the same four-panel view with the same live data on three surfaces — no feature downgrade between them.
Desk
Browser — multi-panel
Four panels side-by-side with drill-down, RCA workflow, KPI trending, and report export. Primary environment for Monday morning reliability review.
Walkdown
Mobile — stacked view
Single asset view when engineer scans a QR code on equipment. MTBF, open work orders, last inspection, and sensor status for that specific asset in one scroll.
Control room
Wall display — live feed
Always-on plant-level rollup shown on the reliability wall board. Colour-coded criticality alerts visible to the whole shift team without needing a login.
"
The defining shift for a reliability engineer in a cement plant is not learning a new technique. It is going from two hours of data assembly every morning to zero. When the MTBF trend, the backlog, the sensor status, and the reactive ratio are all in front of you at the same time, your job changes from investigator to decision-maker. You stop asking "what happened last week" and start asking "what do I intervene on today." That difference is where reliability programmes either improve year over year or plateau at the same three or four percentage points they have hit for a decade.
Marcus Eidenschink, B.Eng, CRL
Certified Reliability Leader (SMRP) · 21 years in cement plant reliability engineering · Specialist in CMMS-integrated condition monitoring and MTBF trend programmes for continuous-process operations
Frequently Asked Questions
How long does it take to configure a reliability command center on an existing cement plant asset register?
Typical deployment runs 3–6 weeks. Weeks 1–2 import the existing asset hierarchy and historical work order data to establish MTBF baselines. Weeks 3–4 connect SCADA and sensor feeds. Weeks 5–6 configure the four-panel dashboard and reflex rules.
Book a demo to see a deployment plan scoped to your plant's asset count.
Can the command center pull from our existing CMMS without replacing it?
Yes. OxMaint integrates with SAP PM, Maximo, and other legacy CMMS platforms via standard APIs. Work orders, asset records, and failure codes flow bi-directionally so the reliability engineer's dashboard stays in sync with the system of record without requiring a migration.
What happens when a sensor drops offline — does the dashboard go blind?
The sensor health panel flags any monitor that has not reported in its expected interval with a clear offline status, and auto-generates a service work order for the sensor itself. The dashboard never silently shows stale data as live.
Start a free trial to see sensor health monitoring in action.
Do we need a dedicated reliability engineer to use the command center, or can a maintenance planner run it?
The command center is built for reliability engineers but is usable by maintenance planners, shift supervisors, and plant managers — each gets a role-filtered view. Plants without a dedicated reliability engineer typically use the command center as the structured reliability function itself until the role is filled.
Does the dashboard work without integrating SCADA or sensor data?
Yes. Even with only CMMS work order data, the command center delivers MTBF trending, backlog aging, PM compliance, and planned vs reactive ratio — the four panels that reliability engineers use most. Sensor integration adds condition-based triggers but is not a prerequisite for core value.
Reliability Command Center · Cement Plant CMMS
Your Reliability View Should Not Live in Seven Tools. It Should Live in One.
OxMaint consolidates MTBF trends, work order backlog aging, PM compliance, sensor health, and planned-vs-reactive ratio into one live command center — built for the way cement reliability engineers actually work, across desk, mobile, and control room.