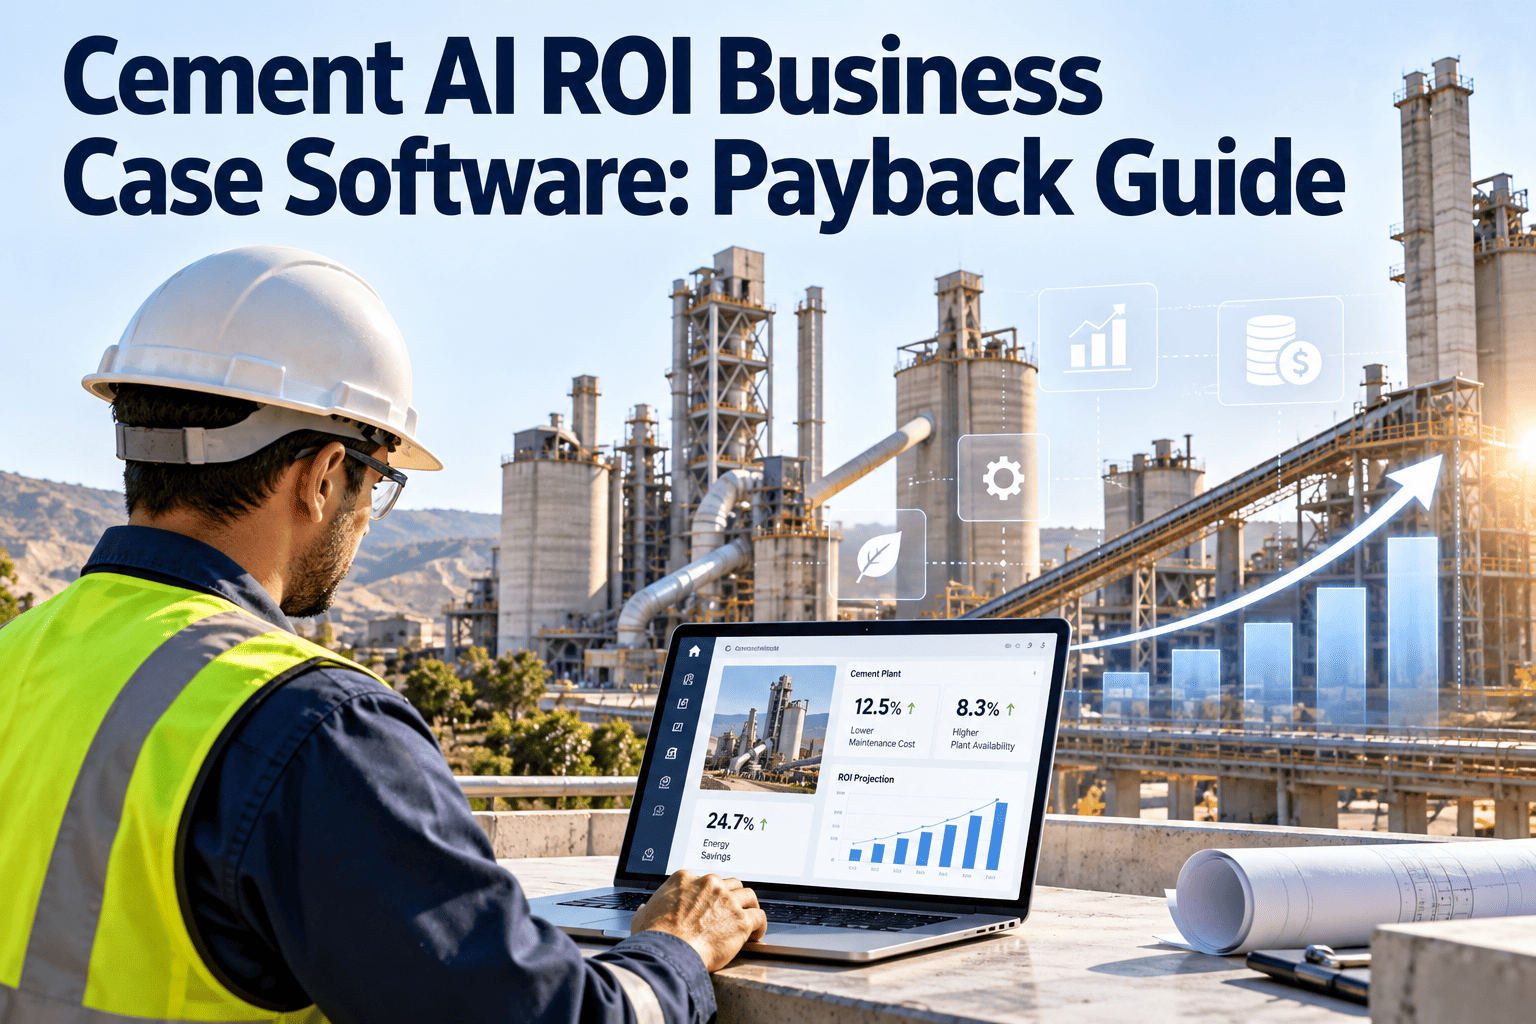
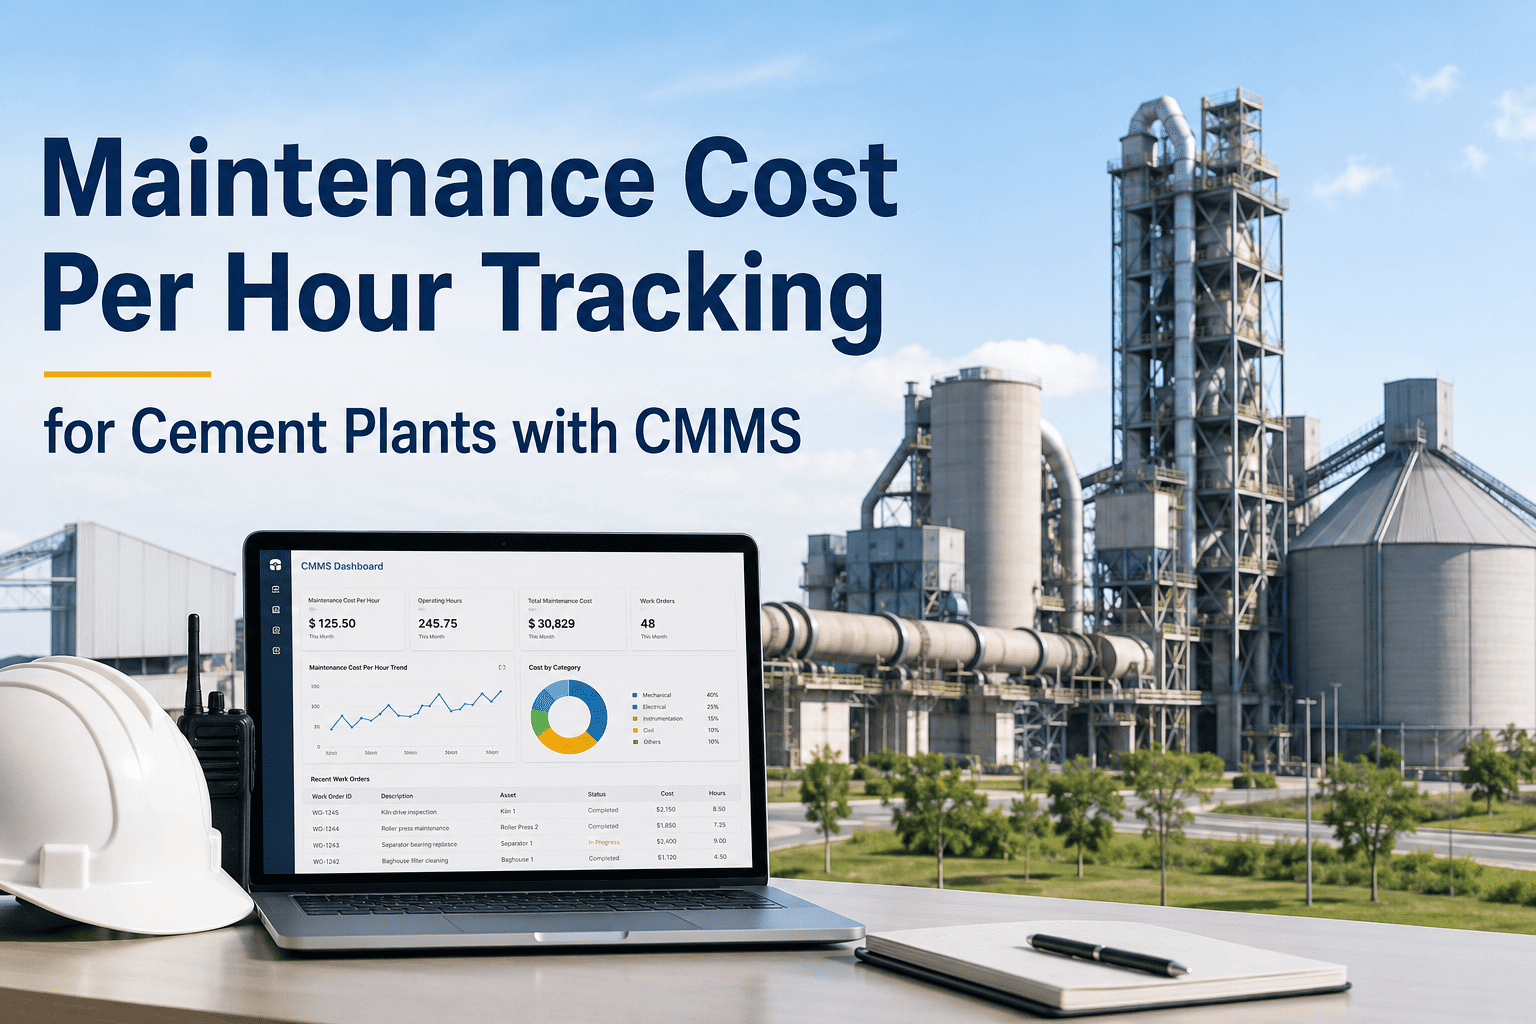
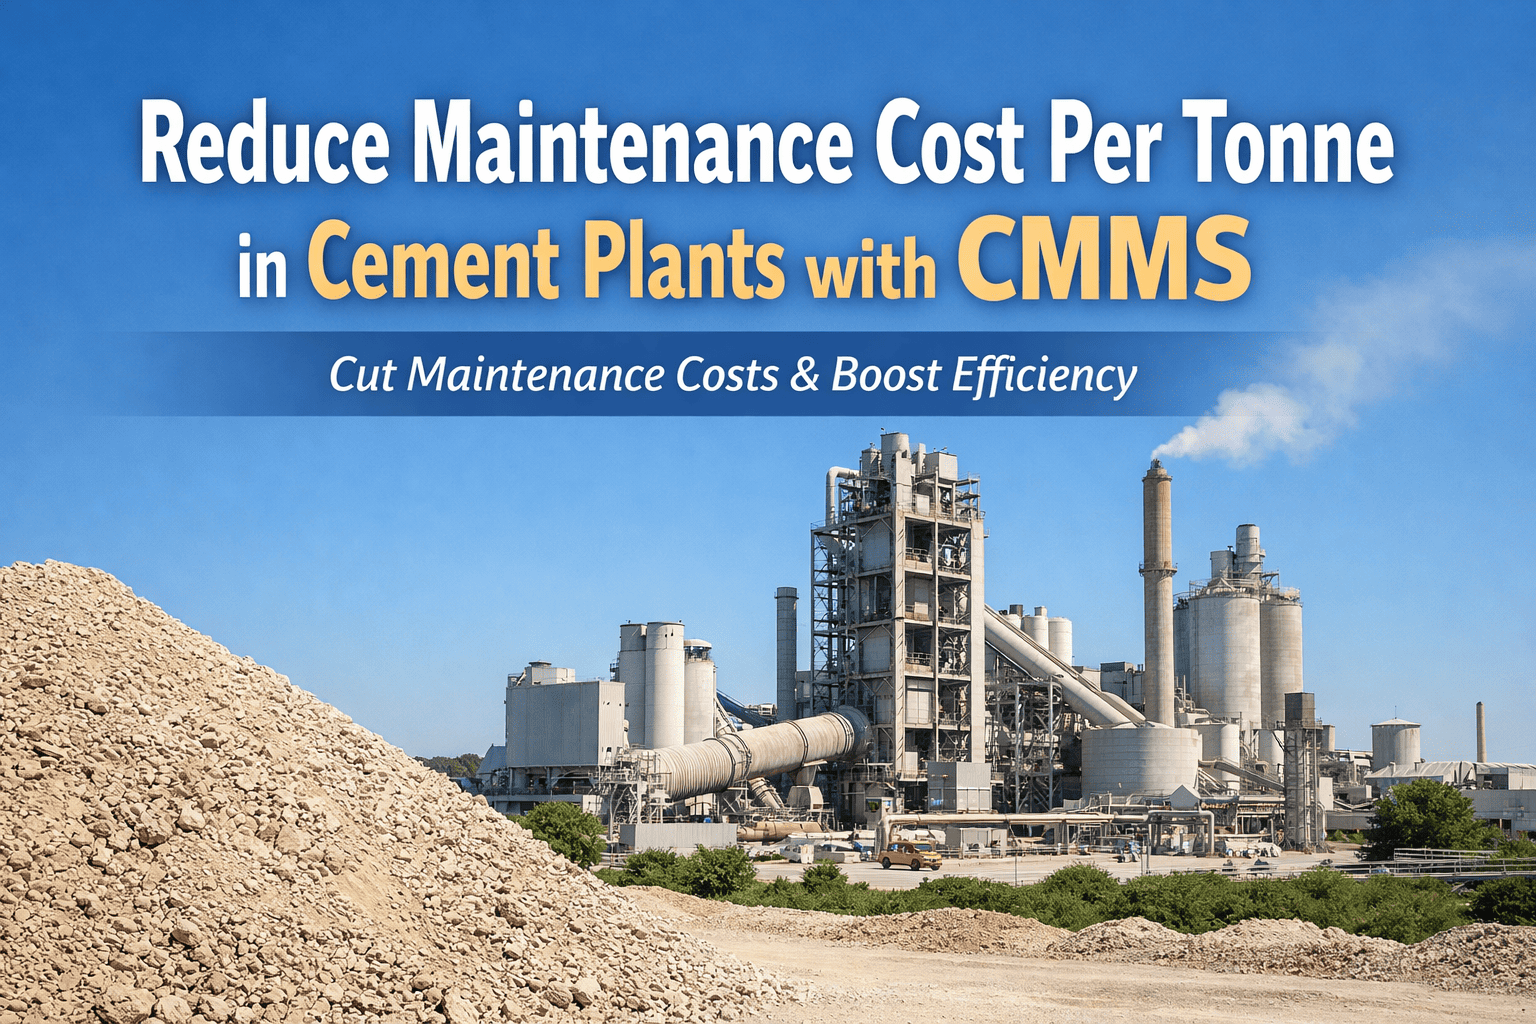
Cement plants that operate without a structured CMMS programme spend 4 to 5 times more per repair event than plants running disciplined preventive maintenance cycles. A single unplanned rotary kiln stop costs between $18,000 and $45,000 per hour in lost clinker production alone, before emergency labour, air-freighted parts, and contractor mobilisation costs are added. The business case for CMMS investment in cement manufacturing is not theoretical. It is built from the measurable gap between what reactive maintenance costs per year and what structured preventive maintenance delivers when PM compliance rates exceed 80%. Book a demo to see how Oxmaint's ROI analytics and cost tracking dashboard calculates projected annual savings against your plant's actual production volume and maintenance spend.
Calculate Your Cement Plant CMMS ROI With Oxmaint
Input your plant's current kiln downtime frequency, emergency repair spend, and maintenance crew size to see projected annual savings from structured CMMS deployment. Book a 30-minute demo with your maintenance and finance teams and receive a custom ROI calculation built from your plant's actual production volume and cost structure.
CMMS ROI Compliance and Reporting Requirements by Region
Cement plant maintenance ROI programmes must be documented in formats that satisfy regional equipment inspection, audit trail, and capital reporting requirements. Oxmaint generates the compliance records, maintenance cost reports, and capital planning documentation that regulators and boards require across every operating region.
| Region | Key Frameworks | Oxmaint ROI Documentation |
|---|---|---|
| USA | OSHA 29 CFR 1910, MSHA 30 CFR Part 56, EPA Title V, NFPA 652 | Maintenance cost tracking, PM compliance reports, equipment health dashboards, audit trail exports for regulatory review |
| UAE | OSHAD-SF equipment inspection, Civil Defence codes, SASO standards, Ministry of Industry | Multi-site cost dashboards, inspection work order records, capital expenditure reports, digital maintenance documentation |
| India | Factories Act 1948 Rule 73, BIS IS 14489, CPCB emission monitoring, DGMS directives | Statutory inspection cost records, maintenance spend registers, compliance certificate tracking, ROI documentation |
| Germany | BetrSichV equipment safety, DIN EN 13306 maintenance, TUV inspection, EU ETS carbon reporting | Inspection cost archiving per asset, maintenance spend documentation, capital planning records, condition cost history |
| UK | PSSR 2000, PUWER 1998, HSE cement plant guidance, Building Safety Act | Maintenance cost exports, inspection compliance records, capital budget documentation, full maintenance cost history |
| Canada | CSA Z1000 maintenance management, Provincial OHS Acts, ACGIH guidelines, CCOHS standards | Multi-site cost dashboards, inspection audit trails, maintenance spend analysis, equipment compliance cost records |
Oxmaint delivers maintenance cost tracking, ROI analytics, and compliance documentation generation for cement plants across every region above. Your finance and maintenance teams have accurate cost records and capital justification reports for every regulatory visit and board review without manual data assembly.
Where Does Cement Plant CMMS ROI Come From?
CMMS return on investment in cement manufacturing does not come from a single source. It accumulates across four distinct cost categories, each of which compounds the others when a structured PM programme raises compliance rates above 80%. Understanding each category is the foundation of a credible business case for CMMS investment at any plant size. Book a demo to see how Oxmaint's cost tracking dashboard captures each ROI category in real time across your plant's asset base.
Emergency Repair Cost Reduction
Emergency repairs in cement plants cost 4 to 5 times more than planned interventions. Air-freighted parts at 3 to 4 times standard cost. Contractor mobilisation at out-of-hours rates. Overtime maintenance labour. A plant spending $3.8 million per year on emergency repairs typically reduces that figure to $1.6 to $1.9 million within 18 months of structured CMMS deployment. This single category alone funds the CMMS investment within the first year of operation.
Kiln and Mill Uptime Improvement
Structured PM programmes raise kiln availability from a typical reactive baseline of 74 to 81% to 89 to 93% within 18 months. At $18,000 to $45,000 per hour of lost production, recovering 8 to 12 percentage points of kiln availability produces $1.2 to $3.6 million per year in additional clinker output value at typical cement plant production volumes. This return dwarfs the CMMS subscription cost in the first year of deployment.
Shutdown Cost and Duration Reduction
Shutdown scope overruns cost 3 to 4 times more than planned work. Without complete equipment history, scope expands by an average of 35 to 60% per major outage. A structured CMMS reduces scope overrun to under 12% by building shutdown plans from accumulated condition records before the kiln cools down. Each avoided scope overrun on a major kiln shutdown saves $180,000 to $620,000 depending on plant size and extent of discovered deterioration.
Capital Planning Accuracy Improvement
Capital budget variance of 40 to 65% versus actual spend is the norm in cement plants without condition-based RUL forecasting. Premature replacement wastes capital. Delayed replacement triggers failure costs 4 to 5 times higher than planned intervention. Reducing CapEx forecast variance from 52% to under 13% frees $400,000 to $1.8 million per year in capital budget that was previously absorbed by unplanned emergency replacements not captured at year-start budget setting.
Four ROI Calculation Mistakes Cement Plants Make When Evaluating CMMS
Calculating ROI Only on Subscription Cost Against Current Maintenance Spend
The CMMS subscription cost is typically 8 to 15% of the total ROI equation. Finance teams that evaluate CMMS investment as a cost comparison against current maintenance spend underestimate the return by a factor of 6 to 8 times. The correct calculation includes emergency repair cost reduction, production loss recovery from uptime improvement, shutdown scope overrun elimination, and capital planning accuracy gains across a 3 to 5 year forecast horizon.
Using Industry-Average ROI Figures Rather Than Plant-Specific Cost Data
Generic industry ROI claims are not credible to cement plant finance teams who manage real kiln downtime costs and actual emergency repair invoices. A CMMS business case built from your plant's own historical maintenance spend, actual kiln stop frequency, real emergency parts cost premiums, and measured shutdown duration overruns is the only version that survives a board-level capital approval process. Book a demo to build a custom ROI calculation from your plant's actual cost data.
Excluding Production Loss Value from the ROI Model
Most CMMS ROI calculations presented to cement plant management teams include only maintenance cost savings. They exclude the production loss value recovered from kiln and mill uptime improvement, which is typically the largest single ROI component. A cement plant producing 3,000 tonnes of clinker per day at $42 per tonne recovers $126,000 in daily production value for every percentage point of kiln availability improvement. Eight percentage points of improvement generates $1.1 million in annual production recovery value.
Presenting a Single-Year ROI Rather Than a 3 to 5 Year Compound Return
Year one CMMS ROI is real but partial. The full compound return accumulates as condition score data improves PM trigger accuracy, RUL calculations become more reliable, and shutdown planning uses increasingly complete equipment histories. A cement plant that achieves 3.2x ROI in year two typically sees 4.8 to 5.6x ROI in year four as the platform matures and every maintenance event adds to the asset history that drives better capital decisions. Single-year ROI presentations systematically understate the investment value to cement plant boards and capital committees.
The Oxmaint ROI Model for Cement Plants
Oxmaint calculates projected and actual ROI across four cost categories simultaneously, updating in real time as work orders are completed, emergency repairs are recorded, and PM compliance rates accumulate. Book a demo to walk through the ROI calculation model with your plant's specific production volume, maintenance headcount, and current emergency repair frequency.
See Your Cement Plant's CMMS ROI Calculated in 30 Minutes
Bring your plant's current maintenance spend breakdown, kiln downtime frequency, and emergency repair invoice data. Oxmaint's team will build a custom ROI projection from your actual cost structure in the demo session. Book a 30-minute demo with your maintenance and finance teams and leave with a documented ROI model ready for board-level capital approval presentation.
Oxmaint Platform: ROI Analytics and Cost Tracking Modules
Each module captures a specific component of the cement plant maintenance ROI equation. Together they produce a complete financial picture that connects maintenance performance directly to production value and capital efficiency. Book a demo to walk through each module with your plant's actual cost data and see the ROI projection update in real time.
Reactive Maintenance Cost vs. Oxmaint CMMS: The Financial Gap
The financial gap between reactive cement plant maintenance and a structured Oxmaint programme is measurable at every cost category from emergency repair invoices to capital budget variance. See how Oxmaint's spare parts inventory management reduces the parts cost component of the emergency repair premium as part of the full ROI programme.
| Cost Category | With Oxmaint CMMS | Reactive Maintenance Baseline |
|---|---|---|
| Emergency Repair Share | Emergency repairs reduced to 14 to 19% of total maintenance budget within 18 months. Planned intervention replaces emergency callout as PM compliance rates improve and condition scores accumulate reliable data across kiln, mill, and crusher equipment classes. | Emergency repairs consume 38 to 52% of total maintenance budget. Parts at 2.8 to 4.2 times standard cost. Contractor mobilisation at out-of-hours rates. Overtime labour. All costs compounding per event with no reduction trend year over year. |
| Kiln Downtime Cost per Year | Kiln availability at 89 to 93%. Unplanned stop frequency reduced by 68% within 18 months. Production loss value recovered from uptime improvement at $18,000 to $45,000 per hour typically generating $1.2 to $3.6 million per year in recovered production value. | Kiln availability at 74 to 81% reactive baseline. Unplanned stops at 3 to 8 per year per kiln averaging 2.8 days each. Production loss of $1.2 million to $4.8 million per year per kiln string at typical cement plant production volumes and clinker values. |
| Shutdown Scope Overrun | Shutdown scope within 12% of initial estimate. Condition history enables scope compilation before kiln cools down. Parts ordered at standard lead time 4 to 6 weeks ahead of outage date with no air freight premium on any planned shutdown component. | Scope overrun of 35 to 60% per major outage. Undetected deterioration discovered after kiln cools down adds $180,000 to $620,000 per event in emergency scope cost. Shutdown duration extended by average 2.4 days per major kiln or mill event. |
| Capital Budget Variance | CapEx forecast variance reduced from 52% baseline to under 13% within 18 months. Replacement cycles planned 3 to 5 years ahead from RUL data. Refurbish versus replace analysis available for every major equipment class at capital budget season. | Capital budget variance of 40 to 65% versus actual annual spend. Unplanned failure-driven replacements not in capital plan absorb $400,000 to $1.8 million per year above budgeted maintenance capital, creating recurring finance team escalations. |
| Parts Procurement Cost | Critical spare parts ordered at standard lead time from planned PM schedules and RUL outputs. Bulk procurement pricing available for high-consumption items like kiln bricks and mill liners. Air freight eliminated on all planned replacement components. | Emergency parts procurement at 2.8 to 4.2 times standard unit cost. Air freight on kiln bearings, girth gear segments, and mill liner sets adds $8,000 to $45,000 per emergency event in freight cost alone. No leverage for bulk pricing agreements with OEM suppliers. |
| Total Maintenance Cost Trend | Total maintenance cost per tonne of clinker declines 18 to 26% within 18 months as emergency premium spend is replaced by planned intervention cost. Cost per tonne continues declining as condition data quality improves PM accuracy in years two and three of programme operation. | Total maintenance cost per tonne of clinker flat or increasing year over year as equipment ages without condition-based PM programme. No mechanism to reduce emergency premium share because root cause of reactive spend is not addressed by budget increase alone. |
CMMS ROI Performance Benchmarks: Cement Plants on Oxmaint
These benchmarks represent average financial results measured across cement plants that transitioned from reactive maintenance to structured Oxmaint programmes. Results measured within 18 months of full platform deployment across kiln-to-packer operations.
Cement Plant CMMS ROI: The Financial Summary
Build Your Cement Plant CMMS Business Case Today
Oxmaint's ROI analytics engine generates a documented return on investment projection from your plant's actual maintenance spend, kiln downtime frequency, and emergency repair data. Finance-ready reports formatted for board-level capital approval. Book a 30-minute demo with your maintenance and finance teams and leave with a complete ROI model built from your actual plant cost structure.
Frequently Asked Questions: CMMS ROI for Cement Plants
QWhat is a realistic payback period for CMMS investment at a cement plant?
QHow does Oxmaint quantify the ROI from kiln uptime improvement?
QWhich compliance frameworks require maintenance cost documentation in cement plant operations globally?
QHow quickly does CMMS ROI become measurable after deployment at a cement plant?
QCan Oxmaint generate ROI reports formatted for board-level capital approval presentations?
QHow does CMMS ROI differ between greenfield and brownfield cement plant deployments?
Continue Reading: Cement Plant CMMS and Maintenance Management Resources
Explore these resources to build a complete picture of cement plant CMMS investment, deployment, and performance measurement across your operations.
Start Measuring Your Cement Plant CMMS ROI Today
Oxmaint deploys across your cement plant's full asset base in 60 to 90 days and begins generating measurable ROI from week eight of programme operation. No heavy implementation fees, no extended onboarding, no production shutdown required. Book a 30-minute demo with your maintenance and finance teams and receive a documented ROI projection built from your plant's actual cost structure from your first session.