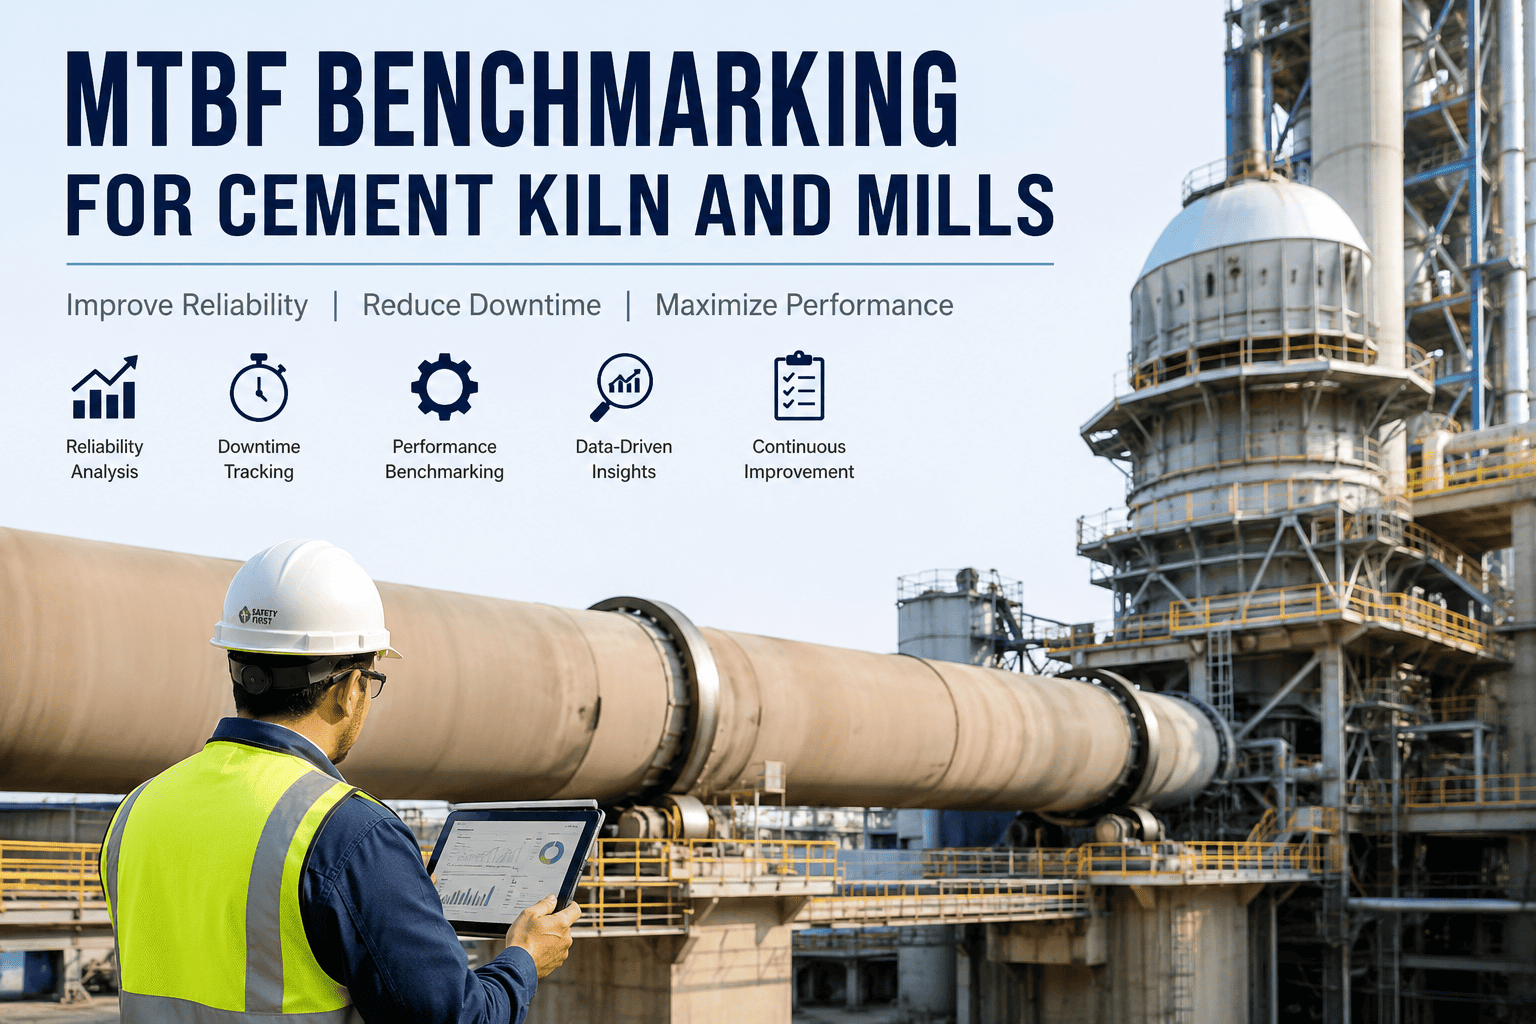
Mean Time Between Failures is the reliability metric that separates cement plants that plan their shutdowns from plants that get shut down by their equipment. When a rotary kiln achieves 2,800 hours MTBF, the plant schedules a 14-day reline on its own terms. When that same kiln sits at 900 hours MTBF, the reline happens after an unplanned shutdown that costs $18,000 to $45,000 per hour in lost production. The gap between these two numbers is not luck — it is the measurable result of structured reliability engineering, condition-based maintenance triggers, and a CMMS that tracks operating hours against failure events accurately. OxMaint calculates and benchmarks MTBF automatically for every kiln, mill, and critical sub-system in your plant.
MAINTENANCE BENCHMARKING · CEMENT RELIABILITY
Your Kiln Ran 1,200 Hours Between Failures Last Year. World-Class Plants Run 3,200.
MTBF benchmarking that compares your kiln, raw mill, cement mill, and critical sub-systems against industry data so you know exactly how far you are from best-in-class reliability and which interventions close the gap fastest.
WHY MTBF MATTERS IN CEMENT
MTBF is the only reliability KPI that directly predicts how many shutdowns you will have next year
Availability tells you what happened. MTBF tells you what will happen. A kiln with 1,200 hours MTBF and 8,760 calendar hours per year will experience approximately 7.3 failure events annually. A kiln at 2,800 hours MTBF will experience 3.1. The difference is four fewer unplanned stoppages, four fewer emergency work order surges, and roughly $1.4 million to $3.6 million in avoided production loss. The math is linear, the impact is enormous, and the levers to move MTBF are entirely within maintenance control.
7.3
failures/year
At 1,200 hrs MTBF
4.8
failures/year
At 1,800 hrs MTBF
3.1
failures/year
At 2,800 hrs MTBF
2.2
failures/year
At 4,000 hrs MTBF
ASSET MTBF SCORECARDS
Benchmark your kiln and mills against four performance tiers
Each scorecard below shows the MTBF range for four reliability tiers across the three highest-impact asset families in a cement plant. The coloured indicator shows where your plant sits. Most plants fall into the Developing or Moderate tier — the gap to Advanced or World-Class is where the ROI lives.
ROTARY KILN SYSTEM
Full pyroprocessing line including drive, tires, and refractory
World-Class
3,000 - 4,500 hrs
Advanced
2,200 - 3,000 hrs
Moderate
1,400 - 2,200 hrs
Developing
600 - 1,400 hrs
BALL MILL (RAW / CEMENT)
Grinding circuit including bearings, liner, and gearbox
World-Class
4,000 - 6,000 hrs
Advanced
2,800 - 4,000 hrs
Moderate
1,600 - 2,800 hrs
Developing
700 - 1,600 hrs
VERTICAL ROLLER MILL
VRM including rollers, table, separator, and hydraulic system
World-Class
5,500 - 8,000 hrs
Advanced
3,500 - 5,500 hrs
Moderate
2,000 - 3,500 hrs
Developing
800 - 2,000 hrs
CALCULATION FRAMEWORK
Three rules that determine whether your MTBF number is accurate or misleading
Most cement plants calculate MTBF incorrectly. The formula is simple — total operating hours divided by number of failures — but the definition of "operating hours" and "failure" makes or breaks the number. The three rules below are the non-negotiable foundation that makes your MTBF comparable to industry benchmarks.
RULE 01
Use Operating Hours, Not Calendar Hours
A kiln that runs 7,000 operating hours in a year has a different MTBF denominator than one that runs 5,200. Calendar-based MTBF inflates the number for plants with long shutdowns and deflates it for plants running at high capacity factors. Always divide by actual running hours from the DCS or production log.
RULE 02
Define the Failure Boundary Before You Count
A "failure" must be defined at the system level you are measuring. For the kiln system, a failure is any unplanned stoppage of the kiln exceeding 30 minutes for a maintenance-related cause. Minor trips that reset in under 30 minutes, process upsets with no maintenance action, and scheduled stops do not count.
RULE 03
Measure Over a Minimum 12-Month Rolling Window
Short-period MTBF is statistically unreliable. A single good or bad quarter can swing the number by 40% or more. The rolling 12-month window smooths seasonal variation, campaign effects, and single-event outliers to give a stable baseline for benchmarking and trend analysis.
SUB-SYSTEM DRILL-DOWN
Five sub-systems that drive 80% of kiln and mill MTBF performance
System-level MTBF tells you the headline number. Sub-system MTBF tells you where to spend your reliability budget. The table below shows the five highest-impact sub-systems with their benchmark MTBF ranges and the failure mode that most commonly pulls the number down.
| Sub-System |
Parent Asset |
Developing (hrs) |
Moderate (hrs) |
World-Class (hrs) |
Primary Failure Mode |
| Trunnion Bearings |
Ball Mill |
4,000 - 7,000 |
7,000 - 12,000 |
12,000 - 20,000 |
Lubrication starvation, contamination |
| Kiln Drive Girth Gear |
Rotary Kiln |
8,000 - 14,000 |
14,000 - 22,000 |
22,000 - 36,000 |
Tooth wear, misalignment, lubrication |
| Mill Gearbox |
Ball Mill / VRM |
6,000 - 10,000 |
10,000 - 18,000 |
18,000 - 30,000 |
Oil degradation, bearing wear, vibration |
| VRM Roller Assembly |
Vertical Roller Mill |
3,000 - 5,500 |
5,500 - 9,000 |
9,000 - 14,000 |
Roller tire wear, hydraulic seal leak |
| Kiln Refractory (Burning Zone) |
Rotary Kiln |
2,000 - 4,000 |
4,000 - 7,000 |
7,000 - 12,000 |
Thermal spalling, coating instability |
GAP ANALYSIS
Current MTBF versus world-class target — see the hours you need to recover
The gap analysis below takes a typical Moderate-tier plant and shows the MTBF distance to World-Class for each major asset. Each gap represents a specific set of reliability interventions that OxMaint tracks as improvement actions with measurable MTBF impact targets.
ROTARY KILN
Gap: +1,850 hrs (112% improvement needed)
BALL MILL
Gap: +2,400 hrs (114% improvement needed)
VERTICAL ROLLER MILL
Gap: +3,700 hrs (148% improvement needed)
RELIABILITY MATURITY LADDER
Four levels of MTBF capability — most cement plants are stuck at Level 2
MTBF improvement is not about working harder. It is about building the data infrastructure, analysis discipline, and maintenance execution capability that each maturity level requires. Plants cannot jump from Level 1 to Level 4 — each level is a prerequisite for the next.
LEVEL 4
Predictive Reliability
3,000+ hrs (Kiln) / 5,500+ hrs (VRM)
MTBF is predicted using condition monitoring models. Failures are anticipated and prevented before they occur. MTBF trend is tracked weekly with automated anomaly detection on vibration, temperature, and oil analysis data.
LEVEL 3
Proactive Analysis
2,200 - 3,000 hrs (Kiln) / 3,500 - 5,500 hrs (VRM)
Root cause analysis is performed on every significant failure. PM frequencies are optimized using actual failure data. MTBF is tracked monthly by asset and sub-system with improvement actions assigned and closed through CMMS.
LEVEL 2
Reactive Measurement
1,400 - 2,200 hrs (Kiln) / 2,000 - 3,500 hrs (VRM)
MTBF is calculated but only reviewed during annual reliability meetings. Failure data exists in the CMMS but is not used to optimize PM programmes. Most maintenance is still time-based or reactive.
LEVEL 1
No Structured Tracking
Below 1,400 hrs (Kiln) / Below 2,000 hrs (VRM)
MTBF is not calculated or exists only in a spreadsheet that no one updates. Failure events are recorded inconsistently. Operating hours are not tracked by asset. There is no baseline for improvement.
MTBF TREND TRACKING
What a 12-month MTBF improvement curve looks like for a cement plant
The visualization below shows a realistic 12-month MTBF improvement trajectory for a plant that moves from Level 2 to Level 3 by implementing structured RCA, PM optimization, and condition-based triggers. The kiln MTBF climbs from 1,450 hours to 2,600 hours — a 79% improvement driven by targeted interventions tracked in the CMMS.
3,000 hrs
2,400 hrs
1,800 hrs
1,200 hrs
600 hrs
Based on a 5,000 TPD plant implementing RCA on top 5 failure modes, PM frequency optimization, and vibration monitoring on kiln trunnion bearings and mill gearbox. Actual results vary by plant condition and baseline MTBF.
HIGH-IMPACT INTERVENTIONS
Six interventions that move MTBF the fastest — ranked by typical impact
01
Vibration Monitoring on Kiln Trunnion Bearings and Mill Gearboxes
MTBF Impact: +400 to +800 hrs
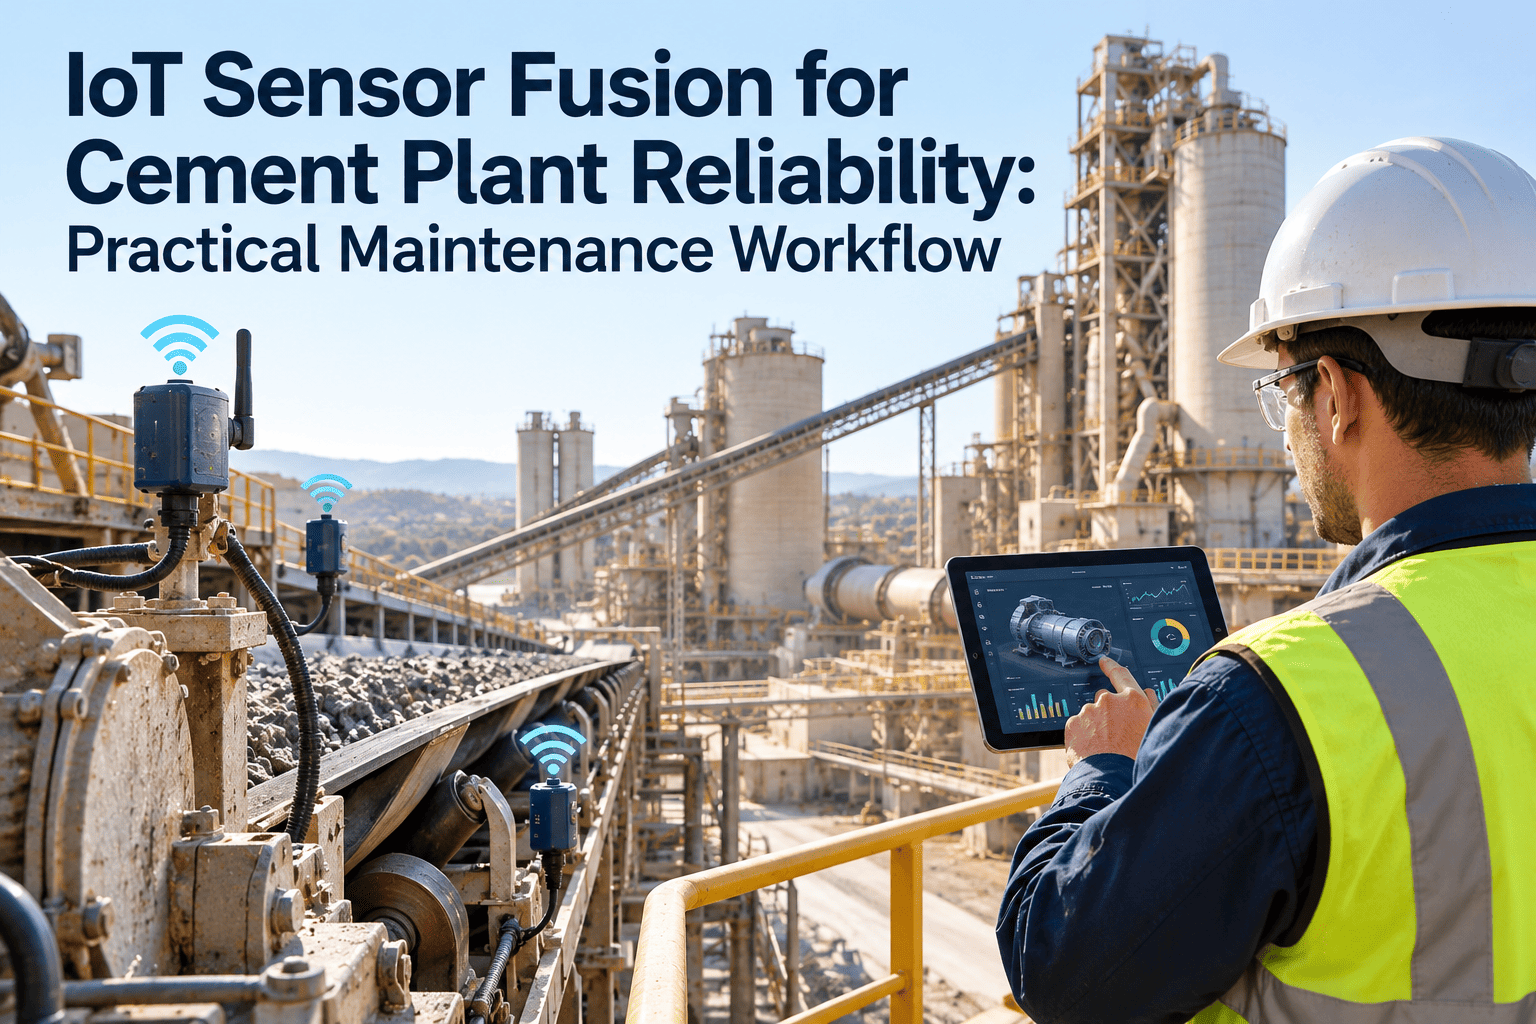
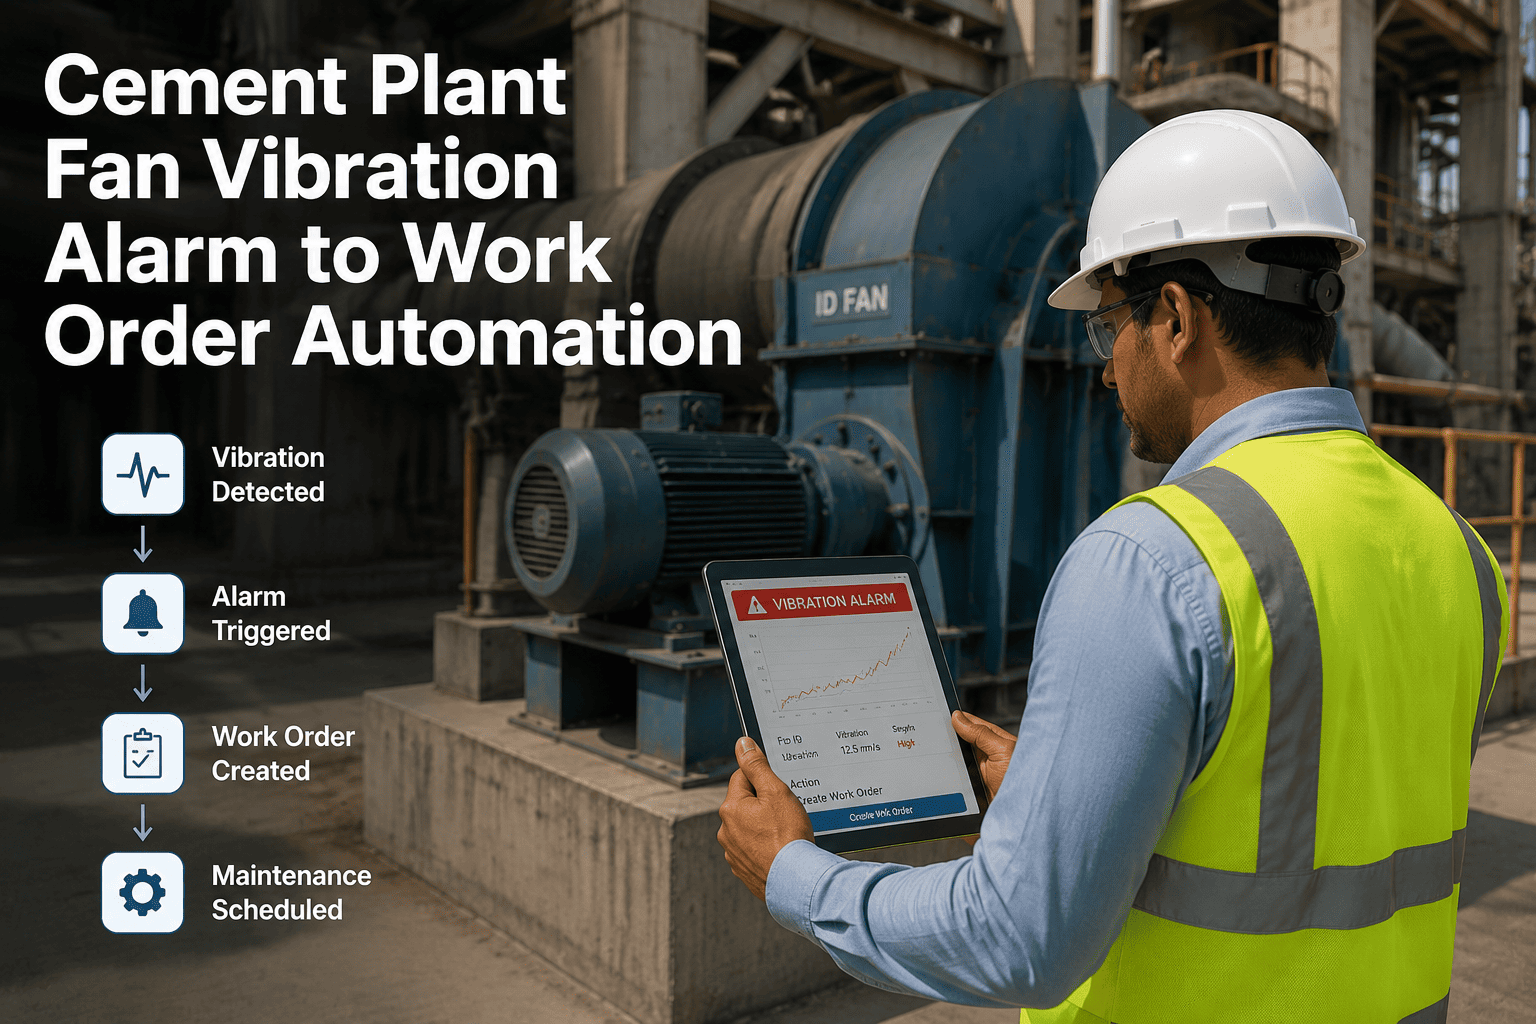
Install or activate vibration sensors on the two highest-consequence bearing systems. Route alerts to CMMS work orders with severity thresholds. Catches 60-70% of bearing degradation before it becomes a failure event.
02
Structured RCA on Top 5 Recurring Failure Modes
MTBF Impact: +300 to +600 hrs
Perform root cause analysis on the five failure modes that account for the most MTBF loss. Document causes, implement corrective actions as CMMS work orders, and verify effectiveness through MTBF re-measurement at 90 and 180 days.
03
PM Frequency Optimization Using Actual Failure Data
MTBF Impact: +200 to +500 hrs
Review PM intervals against the failure frequency data in your CMMS. Assets failing before the PM is due need shorter intervals or condition-based triggers. Assets not failing between PMs can have intervals extended to free labour for higher-priority work.
04
Oil Analysis Programme on All Gearbox and Bearing Systems
MTBF Impact: +200 to +400 hrs
Quarterly oil sampling with ISO 4406 cleanliness, wear metal analysis, and moisture content on mill gearboxes, kiln drive bearings, and roller press hydraulic systems. Results route directly into CMMS as condition-based work order triggers.
05
Lubrication Route Compliance Tracking in CMMS
MTBF Impact: +150 to +350 hrs
Digital lubrication routes with timestamped completion, quantity verification, and grease type confirmation. Non-compliance triggers an alert. Lubrication-related failures typically drop 40-60% within two planning cycles of full compliance.
06
Kiln Shell Thermal Scanning with CMMS-Integrated Trending
MTBF Impact: +150 to +300 hrs
Automated shell scanner data fed into the CMMS with zone-by-zone thermal trending and thickness projection. Refrain from reline based on condition rather than calendar, extending campaigns by 10-20% without increasing refractory failure risk.
BENCHMARK YOUR MTBF AGAINST INDUSTRY DATA
Stop estimating your reliability. Measure it, benchmark it, and improve it with data.
OxMaint calculates MTBF automatically from work order failure data and operating hour logs, benchmarks every asset against industry tiers, tracks your maturity progression, and assigns improvement actions with measurable MTBF impact targets. No spreadsheets. No annual manual compilation.
RELIABILITY BENCHMARKING QUESTIONS
What cement reliability engineers ask before starting their MTBF benchmarking programme
How is MTBF calculated for a cement kiln or mill system?
Divide total operating hours by the number of unplanned failure events exceeding 30 minutes for a maintenance-related cause, measured over a rolling 12-month window. Operating hours must come from the DCS or production log, not calendar hours, to ensure comparability across plants with different capacity factors.
Start a free trial to set up automated MTBF calculation on your cement assets.
What is a good MTBF benchmark for a cement plant rotary kiln?
World-class cement plants achieve 3,000 to 4,500 hours MTBF on the rotary kiln system. The industry median sits between 1,400 and 2,200 hours. Plants below 1,400 hours are in the developing tier and typically have significant gaps in condition monitoring, lubrication management, or PM programme effectiveness.
Book a demo to see how your kiln MTBF compares to these benchmarks.
How long does it take to improve MTBF from Moderate to World-Class in a cement plant?
A realistic timeline is 12 to 24 months for a plant moving from the Moderate tier to the Advanced tier, and 24 to 36 months to reach World-Class. The fastest improvements come from vibration monitoring on critical bearings, structured RCA on recurring failures, and PM frequency optimization — all of which can deliver measurable MTBF gains within the first 90 days of implementation.
What is the difference between MTBF and MTBR for cement plant maintenance?
MTBF (Mean Time Between Failures) counts only unplanned failure events that cause an unplanned stoppage. MTBR (Mean Time Between Repairs) counts all repair events including planned maintenance and scheduled component replacements. MTBF is the better reliability benchmark because it measures how well you prevent failures, while MTBR is influenced by how aggressively you schedule preventive work.
Sign up now to track both metrics with correct failure classification.
How does sub-system MTBF help prioritize reliability investments in a cement plant?
When you break system-level MTBF into sub-system components, you can see exactly which bearing, gearbox, or refractory zone is pulling the overall number down. A kiln at 1,650 hours MTBF might have trunnion bearings at 5,000 hours but refractory at 1,800 hours — the investment priority is immediately clear.
Book a demo to see sub-system MTBF drill-downs on a cement plant hierarchy.
MTBF BENCHMARKING BUILT INTO YOUR CMMS
Your kiln and mill MTBF numbers exist in your work order data. OxMaint makes them visible.
Every failure event, every operating hour log, and every condition monitoring reading in OxMaint feeds an MTBF calculation that benchmarks your assets against industry tiers in real time. No manual data extraction. No spreadsheet formulas that break when someone changes a column. Just accurate, comparable, actionable MTBF data on every kiln, mill, and critical sub-system in your plant.