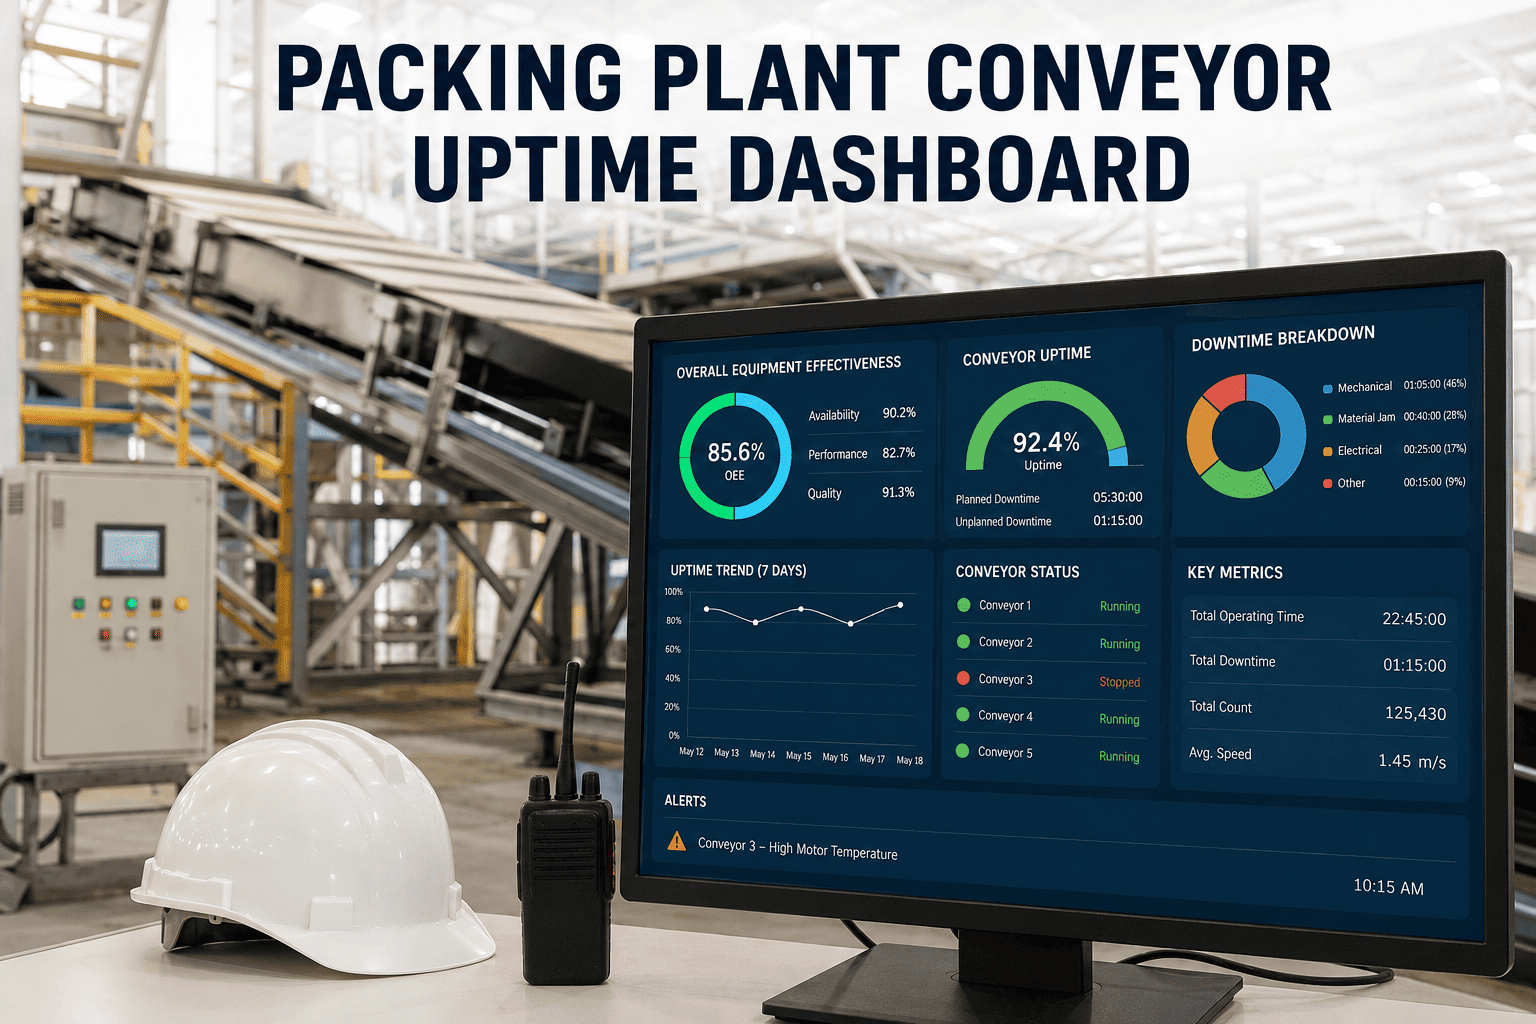
The packing plant is where cement production becomes revenue — and where a stopped conveyor costs not just repair time but delayed dispatch, unhappy customers, and downstream truck scheduling chaos. Most packing plant teams know which conveyors fail most often; few can see their real-time status, cumulative uptime trend, and pending maintenance actions on a single screen before the shift begins. OxMaint's AI analytics and reporting module delivers that visibility as a live operational dashboard: uptime percentage per conveyor, open work orders, overdue inspections, and failure frequency by equipment class — all updated automatically as technicians close work orders from the floor. This article walks through what a high-performance packing plant conveyor uptime dashboard looks like, which metrics matter, and how to configure it to drive decisions rather than just report history. Start free on OxMaint or book a demo to see the dashboard built around your packing plant assets.
Packing Plant Conveyor Uptime Dashboard
The metrics, layout, and data sources that make a packing plant conveyor dashboard actionable — and how OxMaint builds it from your work order history without a separate BI tool.
Why Packing Plant Conveyors Need Their Own Dashboard
Most cement plant CMMS installations track all assets in the same view — kiln, mills, raw material handling, and packing all mixed together. For the packing plant supervisor, that view is nearly useless: the conveyors that directly control dispatch throughput are buried in a list of hundreds. A purpose-focused uptime dashboard surfaces only what matters to packing operations and makes the relevant status immediately readable without drilling through menus.
What the Packing Plant Uptime Dashboard Shows
A useful dashboard answers three questions the moment it loads: what is running, what is at risk, and what needs a decision. The OxMaint packing plant dashboard is structured around those three question groups — not around the data model that generates them.
The live status strip updates automatically from work order status. The open work orders panel shows everything due in the next 24 hours. The failure ranking is generated by OxMaint's AI analytics layer from the closed work order history — no manual tabulation required.
The Six Uptime Metrics That Drive Packing Plant Decisions
See Your Packing Conveyor Uptime in Real Time
OxMaint builds the uptime dashboard from your work order data — no separate BI tool, no spreadsheet, no end-of-shift manual calculation. Every metric updates as technicians close jobs from the floor.
How OxMaint's AI Layer Enhances the Dashboard
Standard reporting tells you what happened. OxMaint's AI analytics layer tells you what is likely to happen next — turning the uptime dashboard from a historical record into a decision-support tool.
Frequently Asked Questions
What is a realistic uptime target for packing plant conveyors?
For conveyors directly in the dispatch path — packers infeed, bag discharge, and truck loading belts — 95% or above is the operational target that avoids systemic dispatch delays. Conveyors running below 92% are generating dispatch disruption measurable in truck waiting time and customer schedule slippage. The specific target should be benchmarked against the plant's throughput target: a line running at 50% capacity can tolerate lower conveyor availability than one running at peak. OxMaint's dashboard lets you set the target threshold per asset and highlights any conveyor trending below it before the monthly review. Start free to set your uptime targets.
How does OxMaint calculate uptime without manual data entry?
Uptime calculation is derived from work order timestamps rather than manual entries. When a technician opens a corrective work order for a conveyor failure, the system records the failure start time. When the work order closes with the conveyor returned to service, the system records the end time. The difference is the downtime event. OxMaint aggregates all downtime events for each asset over the selected period and calculates availability automatically. The accuracy of the calculation depends on work orders being opened promptly when failures occur — something that improves naturally as the team adapts to the mobile work order workflow, because it is faster than writing a paper record. Book a demo to see how timestamps feed the dashboard.
Can the dashboard be shared with dispatch and logistics teams who are not maintenance users?
Yes — OxMaint supports read-only dashboard sharing with non-maintenance stakeholders. Dispatch supervisors and logistics coordinators can see the live conveyor status strip and the current availability percentage without access to the full work order management interface. This is particularly valuable for truck scheduling: when a loading conveyor is in a planned or unplanned stop, the dispatch team sees it immediately and can resequence trucks to available loading points. Setting up the shared view takes under ten minutes and requires no additional user licenses for read-only viewers. Start free to configure shared dashboard access.
How long does it take to build a meaningful uptime trend from a standing start?
The first meaningful trend analysis — enough data to identify failure patterns and calculate a reliable MTBF per conveyor — is typically available after 60 to 90 days of consistent work order capture. Before that window, the dashboard shows real-time status and open work orders accurately, but the AI anomaly detection and failure frequency ranking need a baseline of closed work orders to work from. Plants that migrate historical paper records or spreadsheet data into OxMaint at implementation can compress this ramp-up period significantly — the AI layer uses that imported history to establish baselines from day one. Book a demo to discuss data migration from your existing records.
Which packing plant conveyors should be prioritized in the uptime dashboard?
Priority should follow the production impact of each asset failing: conveyors in series that stop the entire packing line take priority one; redundant systems where a backup exists take a lower priority. In most packing plants, the bag discharge conveyor and the truck loading conveyor are the two single-point-of-failure assets that justify the most intensive monitoring and the shortest preventive maintenance intervals. OxMaint lets you assign a criticality rating to each asset, which determines alert priority, escalation thresholds, and the order in which the dashboard sorts open work orders. The criticality assignment takes under five minutes per asset and transforms how the maintenance team triages competing tasks during busy shifts. Start free to assign criticality ratings to your conveyors.
Know Your Packing Line Status Before the Shift Begins
OxMaint's AI analytics dashboard gives cement packing plant supervisors the live conveyor status, failure trend, and maintenance backlog view they need — built automatically from work order data, with no BI tool and no spreadsheet.