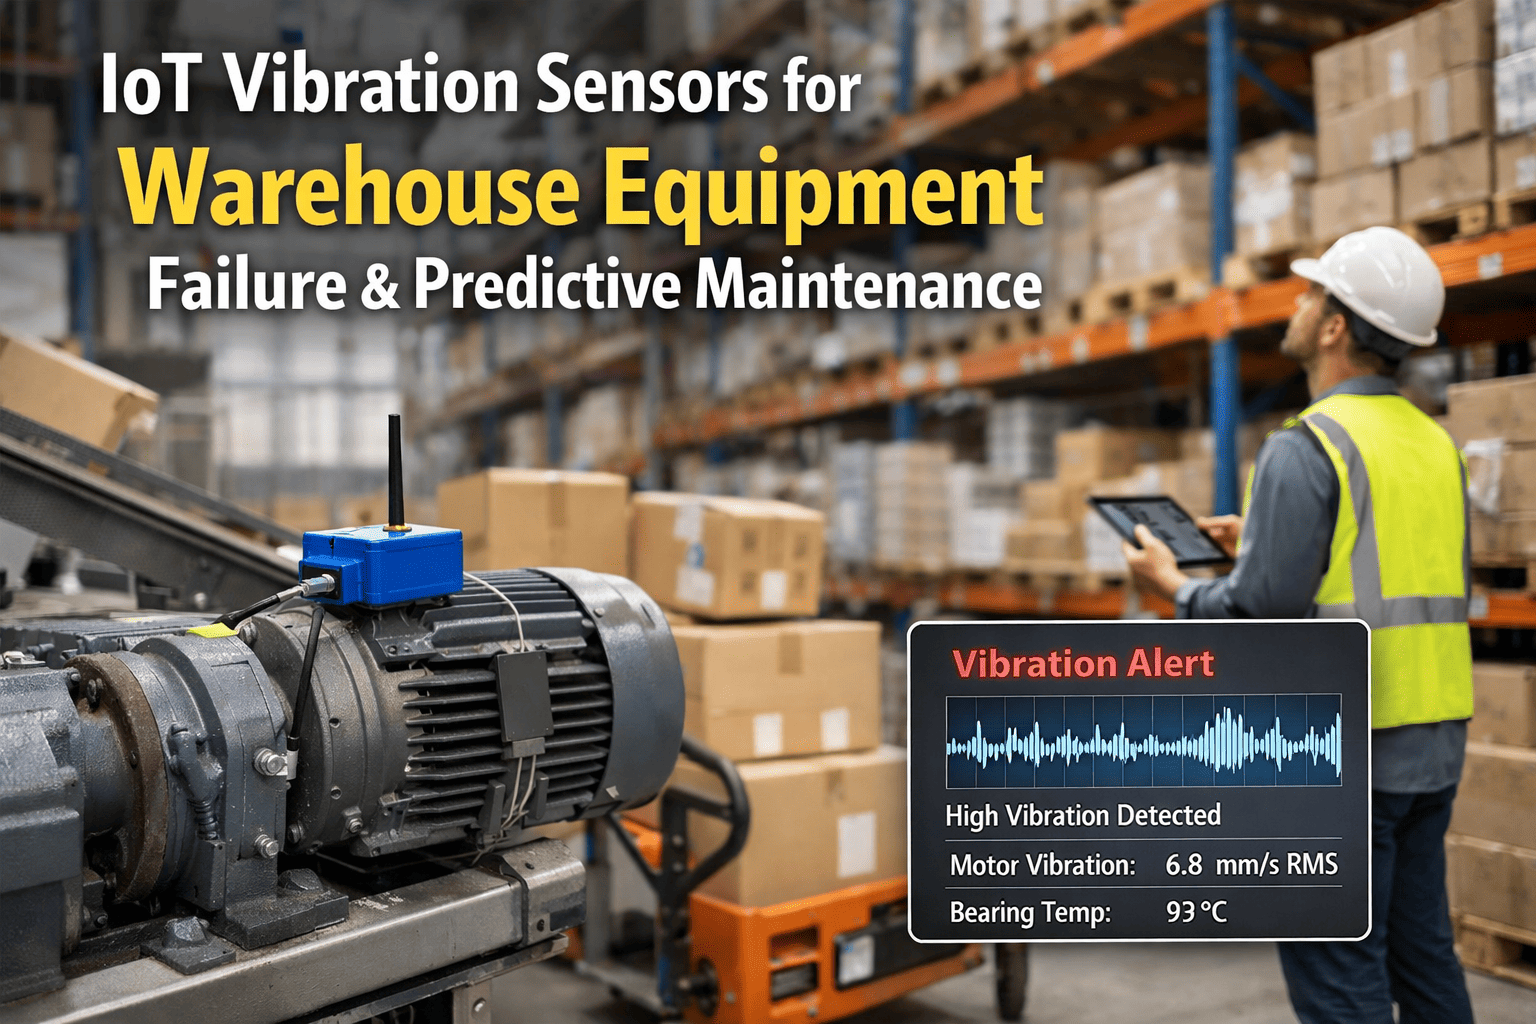
At 2:47 AM on a Wednesday in October, a 1,200-foot sortation conveyor at a distribution center outside of Indianapolis developed a bearing vibration signature that increased by 0.3 mm/s over its baseline reading. Nobody noticed. The vibration sensor was installed but connected to nothing -- its data scrolled past on a local HMI screen that no operator checked during the overnight shift. Over the next 11 days, the bearing degradation progressed through every textbook failure stage: increased radial clearance, cage wear, rolling element pitting, and finally outer race spalling. At 6:14 AM on a Sunday, during peak holiday fulfillment volume, the bearing seized. The conveyor section locked. 340 packages piled up behind the stoppage in under 90 seconds. The emergency shutdown cascade took down three connected sort lanes. The DC lost 6.5 hours of sortation capacity during the single busiest shipping weekend of the year. Emergency bearing replacement cost $4,200. Lost throughput during the outage represented $287,000 in delayed shipments, overtime labor, and carrier re-routing penalties. The irony was that the vibration data predicting this exact failure had been available for 11 days. A sensor was physically present on the bearing housing, generating data every 250 milliseconds, broadcasting a clear warning that got progressively louder every hour. But without an AI fault detection system analyzing that data stream, correlating it against failure models, and triggering a maintenance work order automatically, the sensor was just an expensive thermometer with nobody reading it.
Conveyor systems in distribution centers, manufacturing plants, and material handling facilities generate enormous volumes of sensor data every second: vibration frequencies, motor current draws, belt speed variations, temperature readings, load cell measurements, and acoustic signatures. This data contains early warning signals for every mechanical failure mode that conveyors experience, from bearing degradation and belt misalignment to gearbox wear and roller seizure. AI fault detection transforms this raw sensor data into actionable maintenance intelligence by applying machine learning models that recognize the specific patterns preceding each failure type, distinguishing genuine developing faults from normal operational variation, and generating predictive maintenance work orders days or weeks before catastrophic breakdown occurs. When connected to a CMMS, every AI-detected anomaly becomes a prioritized, scheduled maintenance action rather than an ignored data point on an unmonitored screen. Sign up for Oxmaint free to start connecting sensor intelligence to automated maintenance workflows across your conveyor fleet.
$287K
Average cost of a single critical conveyor failure during peak operations including lost throughput and penalties
11 Days
Average lead time that AI anomaly detection provides before bearing and motor failures reach critical stage
91%
Reduction in unplanned conveyor downtime reported by facilities using AI-driven predictive maintenance analytics
Why Traditional Conveyor Monitoring Fails
Most distribution centers and manufacturing plants have sensors installed on their conveyor systems. The problem is not data collection. The problem is data interpretation. Traditional threshold-based monitoring generates either too many false alarms that operators learn to ignore, or too few alerts that miss developing faults until catastrophic failure. AI fault detection solves this by learning what normal looks like for each individual conveyor section and detecting the subtle deviations that precede specific failure modes.
X Fixed vibration thresholds trigger at the same level regardless of conveyor speed, load, or temperature
X Generates 50-200 false alarms per week that operators learn to dismiss entirely
X Cannot distinguish between a loaded conveyor running normally and an unloaded conveyor developing a fault
X Misses gradual degradation patterns that stay below threshold until sudden catastrophic failure
X No correlation between sensor types -- vibration, current, and temperature analyzed in isolation
✓ Dynamic baselines adapt to conveyor speed, load, ambient temperature, and time-of-day patterns
✓ Reduces false alarms by 85-95% by understanding context, not just comparing to a fixed number
✓ Recognizes that a vibration reading normal at 200 FPM is abnormal at 400 FPM on the same conveyor
✓ Detects degradation trends 7-21 days before failure by modeling rate-of-change, not just absolute values
✓ Cross-correlates vibration + current + temperature to pinpoint specific failure mode developing
Stop ignoring sensor data. Oxmaint connects AI-detected conveyor anomalies directly to automated work orders so your maintenance team acts on predictions, not breakdowns.
How AI Fault Detection Works on Conveyor Systems
AI-driven conveyor health monitoring follows a four-stage pipeline: continuous data ingestion from multiple sensor types, baseline modeling that learns each conveyor section's normal operating signature, real-time anomaly scoring that quantifies deviation from normal, and automated maintenance action through CMMS integration. Each stage builds on the previous one to transform raw sensor noise into precise, actionable maintenance intelligence.
01
Multi-Sensor Data Ingestion
Vibration accelerometers, motor current transducers, infrared temperature sensors, acoustic microphones, and belt speed encoders feed continuous data streams from every monitored conveyor section. Edge processors aggregate readings at 100-1000 Hz sampling rates and transmit compressed feature sets to the analytics platform.
VibrationMotor CurrentTemperatureAcousticsBelt SpeedLoad Cells
02
Adaptive Baseline Modeling
Machine learning models build a unique "fingerprint" for each conveyor section by learning its normal operating patterns across varying loads, speeds, ambient conditions, and time cycles. The baseline is not a fixed number but a dynamic envelope that adjusts contextually, enabling the system to distinguish between a conveyor running harder because it is busy and a conveyor running harder because something is failing.
Speed ContextLoad PatternsTemperature NormsTime Cycles
03
Real-Time Anomaly Scoring
Every incoming sensor reading is scored against the adaptive baseline model. Deviation magnitude, rate of change, cross-sensor correlation, and pattern matching against known failure signatures all contribute to a composite anomaly score (0-100). Scores above configurable thresholds trigger alerts classified by severity: Watch (score 40-60), Warning (60-80), or Critical (80-100).
Deviation ScoringRate AnalysisPattern MatchingSeverity Classification
04
CMMS Work Order Generation
When an anomaly score crosses a threshold, the AI system auto-generates a maintenance work order in the CMMS with the specific conveyor section, detected fault type, severity level, recommended repair action, estimated time to failure, and all supporting sensor data attached. The maintenance team receives a prioritized, actionable task rather than an ambiguous alarm.
Book a demo to see the full sensor-to-work-order pipeline in action.
Auto Work OrdersFault ClassificationPriority RankingSensor Evidence
What AI Detects: Conveyor Failure Modes and Sensor Signatures
Each conveyor failure mode produces a unique combination of sensor signature changes that AI models are trained to recognize. This is where machine learning conveyor diagnostics dramatically outperforms threshold monitoring: the AI does not just see that vibration increased, it recognizes the specific frequency pattern that means "outer race bearing defect" versus "belt misalignment" versus "gearbox gear tooth wear" and generates the correct maintenance response for each.
Primary SensorVibration accelerometer -- high-frequency envelope detection (BPFO, BPFI, BSF, FTF patterns)
Supporting SignalsMotor current increase 3-8%, bearing housing temperature rise 5-15 degrees C above baseline
Detection Lead Time7-21 days before seizure depending on speed and load severity
AI AdvantageIdentifies specific defect location (inner race, outer race, cage, rolling element) from frequency analysis
Primary SensorBelt edge position sensors, lateral vibration patterns, uneven load cell distribution
Supporting SignalsMotor current asymmetry between drive and idler side, audible scraping acoustics
Detection Lead Time3-10 days before belt edge damage or product spillage incidents
AI AdvantageDistinguishes load-induced temporary tracking shift from structural misalignment requiring repair
Primary SensorMotor current signature analysis (MCSA) detecting rotor bar defects, stator winding issues
Supporting SignalsMotor temperature trending, vibration at motor shaft frequency and harmonics
Detection Lead Time14-60 days for winding insulation degradation; 3-14 days for mechanical faults
AI AdvantageSeparates electrical faults from mechanical faults using current + vibration cross-correlation
Primary SensorVibration at gear mesh frequency and sidebands, acoustic emission monitoring
Supporting SignalsGearbox temperature rise, increased motor current draw to maintain same belt speed
Detection Lead Time21-90 days for gradual gear tooth wear; 5-14 days for lubrication failure
AI AdvantageDifferentiates normal gear mesh signature growth from abnormal tooth damage progression
Primary SensorInfrared thermal imaging detecting hot rollers, acoustic signatures of seized bearings
Supporting SignalsBelt speed micro-variations at roller interval, increased drag measured via motor current
Detection Lead Time1-7 days from first thermal signature to full seizure
AI AdvantageThermal scanning identifies the specific failed roller among hundreds on a long conveyor run
Primary SensorBelt thickness measurement, splice tension monitoring, surface condition cameras
Supporting SignalsBelt slip detected via speed differential between drive pulley and belt surface encoder
Detection Lead Time30-120 days for gradual wear trending; 3-7 days for developing splice separation
AI AdvantageProjects remaining belt life based on wear rate trending instead of age-based replacement
ROI of AI-Driven Conveyor Predictive Maintenance
These numbers are based on a mid-size distribution center running 8,000 linear feet of conveyor across sortation, accumulation, and transport systems operating 18-20 hours per day during peak season.
$287,000
Avoided Catastrophic Failure During Peak
1 prevented critical failure per year at average throughput loss + penalty cost
$118,000
Reduced Unplanned Downtime Events
4-6 minor failures detected and repaired during planned windows vs emergency stops
$64,000
Extended Component Life Through Condition-Based Replacement
Bearings, belts, and motors replaced at actual wear limits instead of calendar schedules
$42,000
Eliminated False Alarm Investigation Labor
Maintenance team spends zero hours investigating false threshold alerts per year
$31,000
Reduced Emergency Contractor and Parts Premiums
All repairs planned with standard-rate labor and pre-ordered parts vs rush delivery
At $542,000 in annual savings against a total investment of $35,000-$65,000, the payback period is under 7 weeks for most facilities. Properties with aging conveyor infrastructure or high peak-season throughput requirements see even higher returns. Book a demo and we will model the ROI for your specific conveyor layout and operational profile.
Implementation: From Sensors to Predictive Work Orders
Deploying AI fault detection on an existing conveyor system does not require replacing equipment or rewiring the facility. Most implementations follow a phased approach that delivers measurable results within the first 30 days. Sign up for Oxmaint to begin building your conveyor asset register and maintenance baseline today.
Asset Mapping and Sensor Audit
Map all conveyor sections with motor HP, belt type, bearing specs, and age
Audit existing sensors and identify gaps in vibration, current, and temperature coverage
Register every conveyor asset in CMMS with criticality ranking and failure history
Install additional wireless sensors on highest-criticality sections first
Baseline Learning Period
AI models collect 2-4 weeks of normal operation data across all load conditions
Adaptive baselines build for each conveyor section accounting for speed, load, and ambient factors
Initial anomaly detection runs in shadow mode alongside existing monitoring without triggering alerts
Calibrate alert thresholds based on shadow-mode results to minimize false positives
Live Detection and CMMS Integration
Enable live anomaly alerts with auto-generated CMMS work orders for Warning and Critical scores
Maintenance team validates first AI-generated predictions against actual equipment condition
Refine detection models based on technician feedback from field inspections
Expand sensor coverage to secondary conveyor sections based on Phase 1 criticality ranking
Continuous Learning and Optimization
Models continuously improve accuracy as they learn from confirmed true positives and false positives
Failure prediction lead time extends as historical data accumulates per conveyor section
Capital replacement planning uses condition-based trending instead of age-based budgeting
Quarterly model performance reviews measure detection rate, false alarm rate, and prediction accuracy
Key Metrics for AI Conveyor Monitoring Programs
These KPIs give operations and maintenance leadership the visibility needed to measure the effectiveness of their AI-driven smart conveyor health monitoring program and justify continued investment in sensor coverage expansion.
| Metric | Target | Why It Matters | Red Flag |
|---|
| Prediction Accuracy |
Above 85% |
Confirmed faults detected before failure vs total failures that occurred |
Below 70% indicates sensor gaps or model calibration needed |
| False Alarm Rate |
Below 5% |
Alerts that investigation reveals no actual developing fault |
Above 15% causes alarm fatigue and operator distrust |
| Mean Detection Lead Time |
7+ days |
Average days between first AI alert and projected failure date |
Below 3 days leaves insufficient time for planned repair |
| Unplanned Downtime Reduction |
Above 80% |
Year-over-year decrease in unplanned conveyor stoppage hours |
Below 50% indicates coverage or response workflow gaps |
| Planned vs Emergency Repair Ratio |
90%+ planned |
Higher ratio means lower costs and zero production disruption |
Below 70% means AI detections are not converting to scheduled repairs |
| Sensor Coverage Rate |
100% critical |
Percentage of critical conveyor sections with active AI monitoring |
Below 80% creates blind spots where failures go undetected |
Frequently Asked Questions
What types of conveyor faults can AI detect before failure?
AI fault detection covers the full range of mechanical and electrical failure modes in conveyor systems: bearing degradation (inner race, outer race, cage, and rolling element defects), belt misalignment and tracking drift, motor winding insulation breakdown, gearbox gear tooth wear and lubrication failure, roller seizure and idler bearing failure, belt splice separation and surface wear, and drive chain stretch and sprocket wear. Each fault type produces a distinct sensor signature pattern that machine learning models are trained to recognize, enabling fault-specific work orders rather than generic "check conveyor" alerts.
How much lead time does AI provide before a conveyor failure?
Detection lead time varies by failure type and severity. Bearing degradation is typically detected 7-21 days before seizure. Motor winding faults are caught 14-60 days before failure. Gearbox wear provides 21-90 days of warning. Belt wear trending projects remaining life 30-120 days out. Roller seizure provides 1-7 days, and belt splice separation gives 3-7 days of warning. The key factor is sensor sampling rate and AI model maturity; systems that have been running for 6+ months on a specific conveyor develop significantly more accurate long-range predictions.
How does AI reduce false alarms compared to threshold monitoring?
Traditional threshold monitoring compares each sensor reading against a single fixed value. AI anomaly detection builds a dynamic, context-aware baseline that accounts for conveyor speed, load weight, ambient temperature, time of day, and seasonal patterns. A vibration reading that would trigger a false alarm under threshold logic, because the conveyor is simply running at higher speed during peak volume, is correctly classified as normal by the AI because it understands the operating context. Facilities typically see 85-95% reduction in false alarms after AI deployment.
Sign up for Oxmaint to connect AI detections to automated maintenance workflows with zero false-alarm noise.
Can AI monitoring work on older conveyor systems without modern PLCs?
Yes. AI fault detection relies on external sensors mounted on conveyor components, not on data from the conveyor's own control system. Wireless vibration sensors, clip-on current transducers, and non-contact infrared temperature sensors install directly on bearings, motors, and gearboxes without any integration with the conveyor PLC or controls. This makes AI monitoring deployable on conveyors of any age or manufacturer. The sensor data feeds to an edge gateway that communicates with the AI platform and CMMS independently of the conveyor control system.
What ROI can distribution centers expect from AI conveyor monitoring?
A mid-size distribution center with 8,000 feet of conveyor typically sees $542,000 in annual savings from avoided catastrophic failures ($287K), reduced unplanned downtime ($118K), extended component life ($64K), eliminated false alarm labor ($42K), and reduced emergency premiums ($31K). Against a platform and sensor investment of $35,000-$65,000, first-year ROI is 8-15x. Facilities with older conveyors or high peak-season throughput dependence see even higher returns.
Book a demo to model the ROI for your specific conveyor layout.
Your Sensors Are Already Collecting the Data. Let AI Read It.
That Indianapolis DC had a sensor on the bearing that failed. The data was there for 11 days. Nobody read it. AI fault detection reads every sensor, every second, and generates the work order your team needs before the conveyor tells you the hard way.