Enterprise logistics fleets run on tight margins and tighter schedules. Every unplanned breakdown costs thousands in emergency repairs, delayed deliveries, and damaged contracts — yet most fleet operations still rely on reactive or calendar-based maintenance that was designed for a simpler era. In 2026, AI predictive maintenance has become the defining competitive advantage for logistics companies managing 50 to 5,000+ vehicles. This guide shows enterprise fleet managers exactly how to implement it — stage by stage, asset by asset — and what measurable outcomes to expect at each step.
Why Reactive Fleet Maintenance Is Breaking Enterprise Logistics
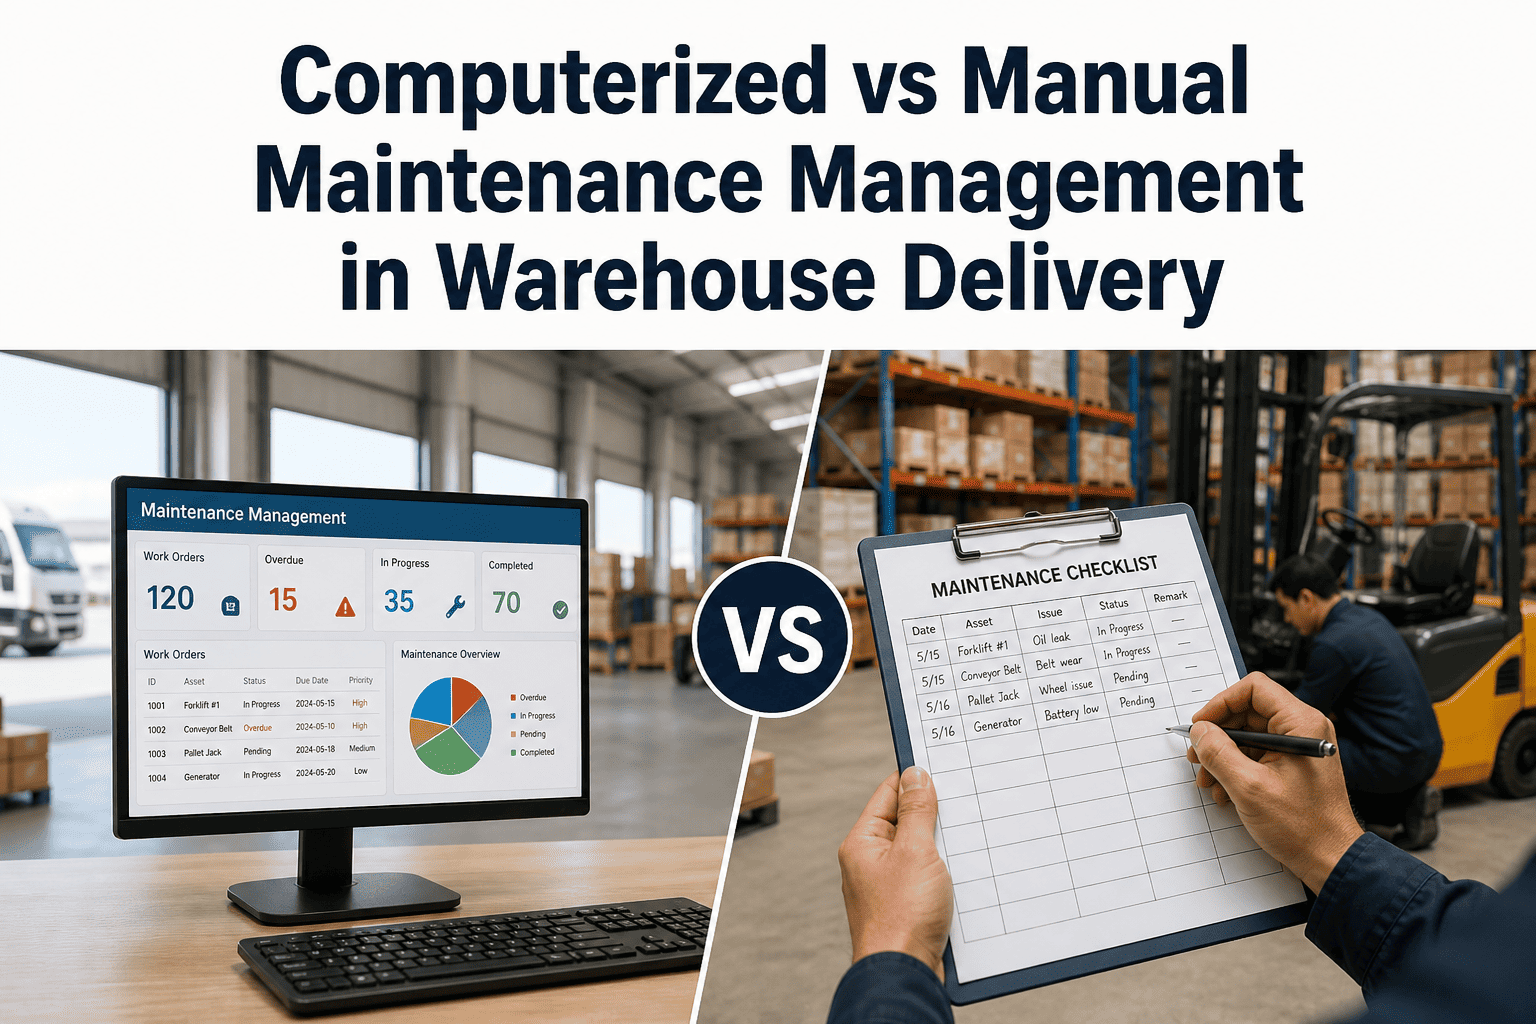
Traditional fleet maintenance — fix it when it breaks, or service it on a calendar schedule — was acceptable when fleets were small and delivery windows were flexible. Neither is true today.
Enterprise logistics operators face same-day delivery commitments, regulatory compliance requirements, and fleet utilization rates that leave zero room for unplanned downtime. A single truck breakdown mid-route can cascade into missed SLAs, driver overtime, and customer churn.
AI predictive maintenance changes the equation by shifting from time-based guessing to condition-based certainty — monitoring every vehicle in real time and flagging failures weeks before they happen.
How AI Predictive Maintenance Works in a Logistics Fleet
Telematics, OBD-II ports, and embedded sensors capture engine temperature, vibration, brake pressure, fuel efficiency, and transmission health — continuously, across every vehicle.
Machine learning models analyze thousands of data points per vehicle to detect anomalies that are invisible to human inspection — identifying failure signatures 2–6 weeks before breakdown.
When a threshold is crossed, the system automatically generates a prioritized work order — not based on a calendar, but on the actual state of that specific vehicle component.
AI recommends the exact repair action, optimal timing (to minimize route disruption), required parts, and the best-fit technician — balancing cost, urgency, and fleet availability.
Every repair outcome feeds back into the model. Over time, the system learns fleet-specific failure patterns — making predictions sharper for every make, model, and route type in your operation.
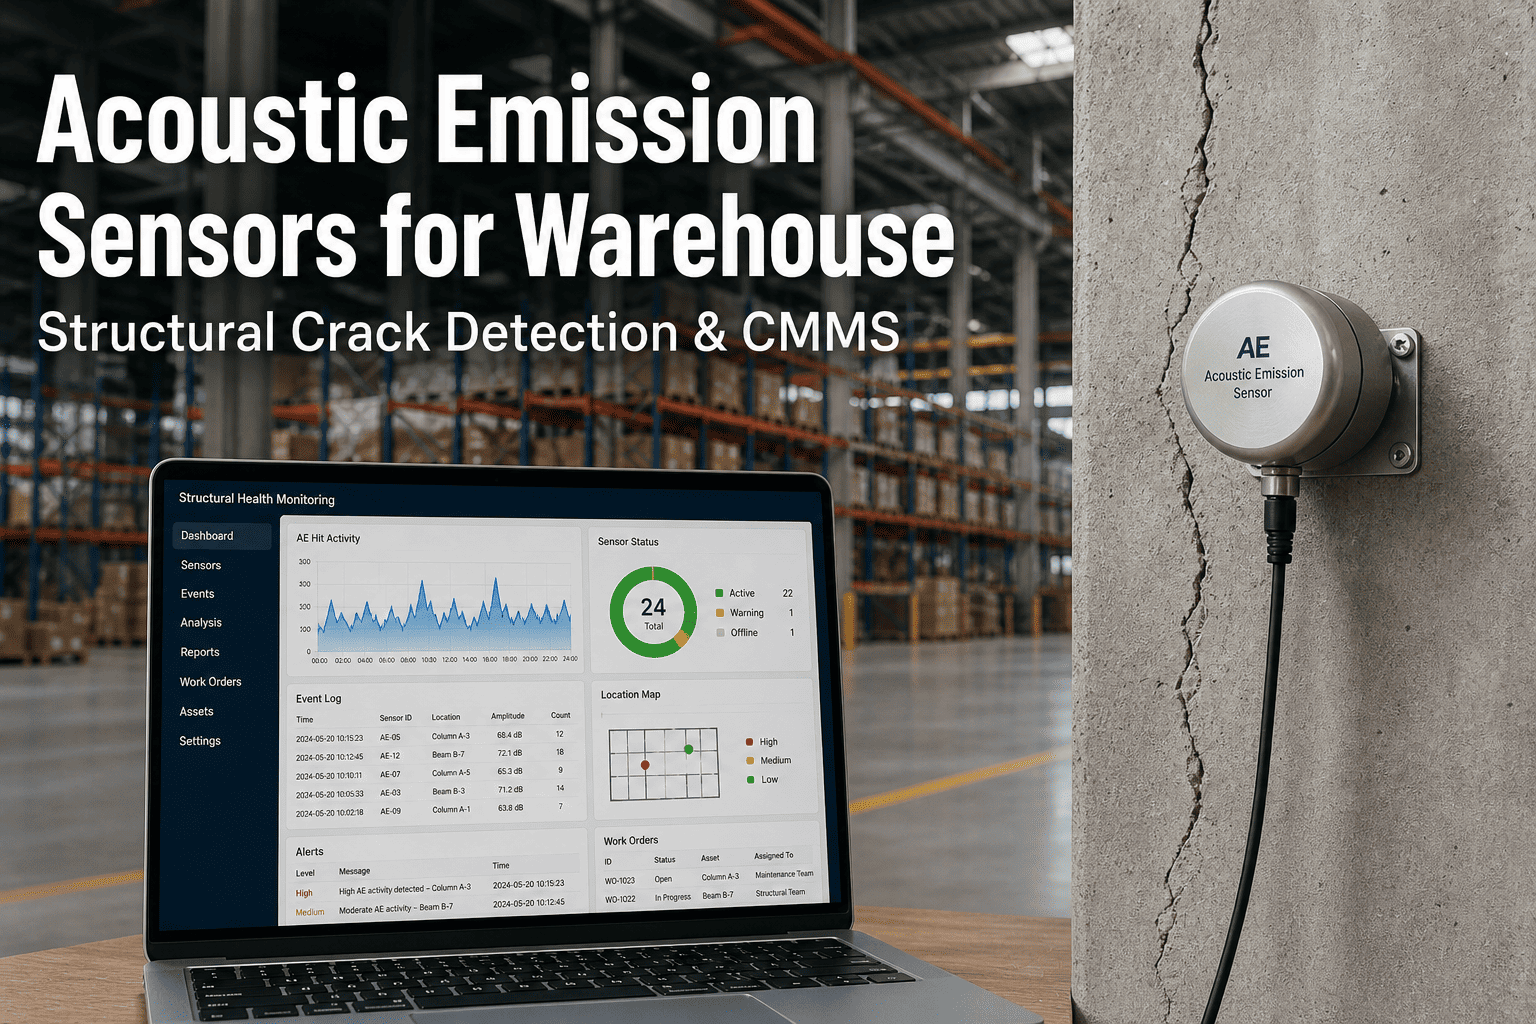
Real-time dashboards and automated reports give operations managers, fleet directors, and CFOs full visibility into fleet health, cost trends, and maintenance ROI — without manual data compilation.
Enterprise Implementation Roadmap: 4 Phases
Migrate all maintenance records, vehicle specs, and service history into a centralized CMMS. Define asset hierarchy across your fleet. Standardize work order templates. This data layer is the non-negotiable foundation every AI model depends on.
Integrate existing telematics platforms (Samsara, Geotab, Verizon Connect) with your CMMS. Deploy OBD-II sensors on high-priority vehicles first. Begin streaming engine, brake, and transmission health data into the platform.
With 90+ days of historical sensor data, ML models activate. Anomaly detection begins scoring every vehicle. Work orders are now triggered by condition thresholds, not schedules. Fleet managers see failure predictions with lead times of 2–4 weeks.
Expand across all depots and fleet categories. AI now cross-references fleet data with route patterns, weather, load weight, and driver behavior. Prescriptive recommendations optimize cost per mile. CFO-level ROI reporting automated.
What Gets Better — And By How Much
| Metric | Reactive / Manual | Preventive (CMMS) | AI Predictive |
|---|---|---|---|
| Unplanned Breakdowns | Very High | Moderate | 70% fewer |
| Maintenance Cost / Vehicle | Highest | 15–20% lower | 35–40% lower |
| Fleet Uptime Rate | 78–85% | 88–92% | 95–98% |
| Time to Detect Failure | After breakdown | At scheduled PM | 2–6 weeks before |
| Parts Inventory Waste | High (overstock) | Moderate | Minimal (demand-driven) |
| Vehicle Lifespan | Shortened | Normal | 20–25% longer |
Key Assets to Prioritize First
Highest failure cost. Monitor coolant temp, oil pressure, RPM patterns, and exhaust back-pressure. Predictive models reduce catastrophic engine failures by up to 80%.
Safety-critical and compliance-sensitive. Continuous brake pressure and pad wear monitoring prevents both accidents and DOT violations — critical for enterprise liability management.
Transmission rebuilds average $4,500–$9,000. Early detection of fluid degradation, temperature spikes, and shift anomalies extends transmission life by 30–40%.
Underinflated tires cost 0.5–1% fuel efficiency loss per vehicle. TPMS integration with predictive scheduling prevents blowouts and reduces fuel waste across large fleets.
Common Enterprise Implementation Challenges — And How to Address Them
Large fleets often have maintenance data fragmented across regional depots, legacy software, and spreadsheets. The fix: choose a CMMS with open API integrations that can ingest data from existing telematics and ERP systems without a full rip-and-replace.
Field technicians who have worked on feel-based diagnostics for years can resist AI-generated work orders. Address this with role-specific training, showing technicians how AI reduces their emergency callouts and after-hours work — not their job security.
ML models need historical data to make accurate predictions. Start with rule-based condition alerts on day one while accumulating data, then transition to ML-driven predictions once you have 90+ days of sensor history per vehicle.
Enterprise fleets often mix Freightliner, Kenworth, International, and Mercedes Sprinter vehicles. Choose a platform with pre-built OEM-specific failure models rather than one that requires building custom models per vehicle type from scratch.