Delivery operations that rely on gut instinct and manual tracking are losing ground fast. In 2026, the fleets pulling ahead are not necessarily the biggest — they are the ones using data to make smarter decisions, faster. From route performance dashboards to predictive fleet analytics, data-driven delivery operations have become the clearest path to lower costs, fewer delays, and stronger margins. Start for free and build your analytics foundation today or book a demo to see fleet data in action.
The Gap Between Data-Rich and Data-Ready
Most delivery operations generate enormous amounts of data — GPS pings, fuel receipts, maintenance logs, delivery scans. The problem is not a lack of data. It is that most teams cannot access, connect, or act on it in time to make a difference. Disconnected systems, paper-based records, and siloed spreadsheets turn valuable signals into noise.
Data-driven delivery operations close this gap by centralizing fleet data into a single analytics layer — one where every work order, vehicle status, route completion, and cost metric is visible, searchable, and actionable. Sign up free and centralize your fleet data today.
Five Analytics Layers Every Delivery Operation Needs
Track vehicle maintenance status, upcoming PM triggers, repair history, and downtime frequency. Identify high-cost vehicles before they become high-risk vehicles.
Measure on-time delivery rates, average stops per shift, and delay frequency by zone. Pinpoint which routes consistently underperform and why.
Break down total operating costs by completed delivery stop. Compare cost efficiency across drivers, vehicles, and neighborhoods to find waste and act on it.
Monitor inspection completion rates, work order closure times, and response speed. Use data to coach performance and recognize top contributors.
Track parts usage rates, reorder lead times, and stockout frequency. Ensure the right components are available before a breakdown stops a run.
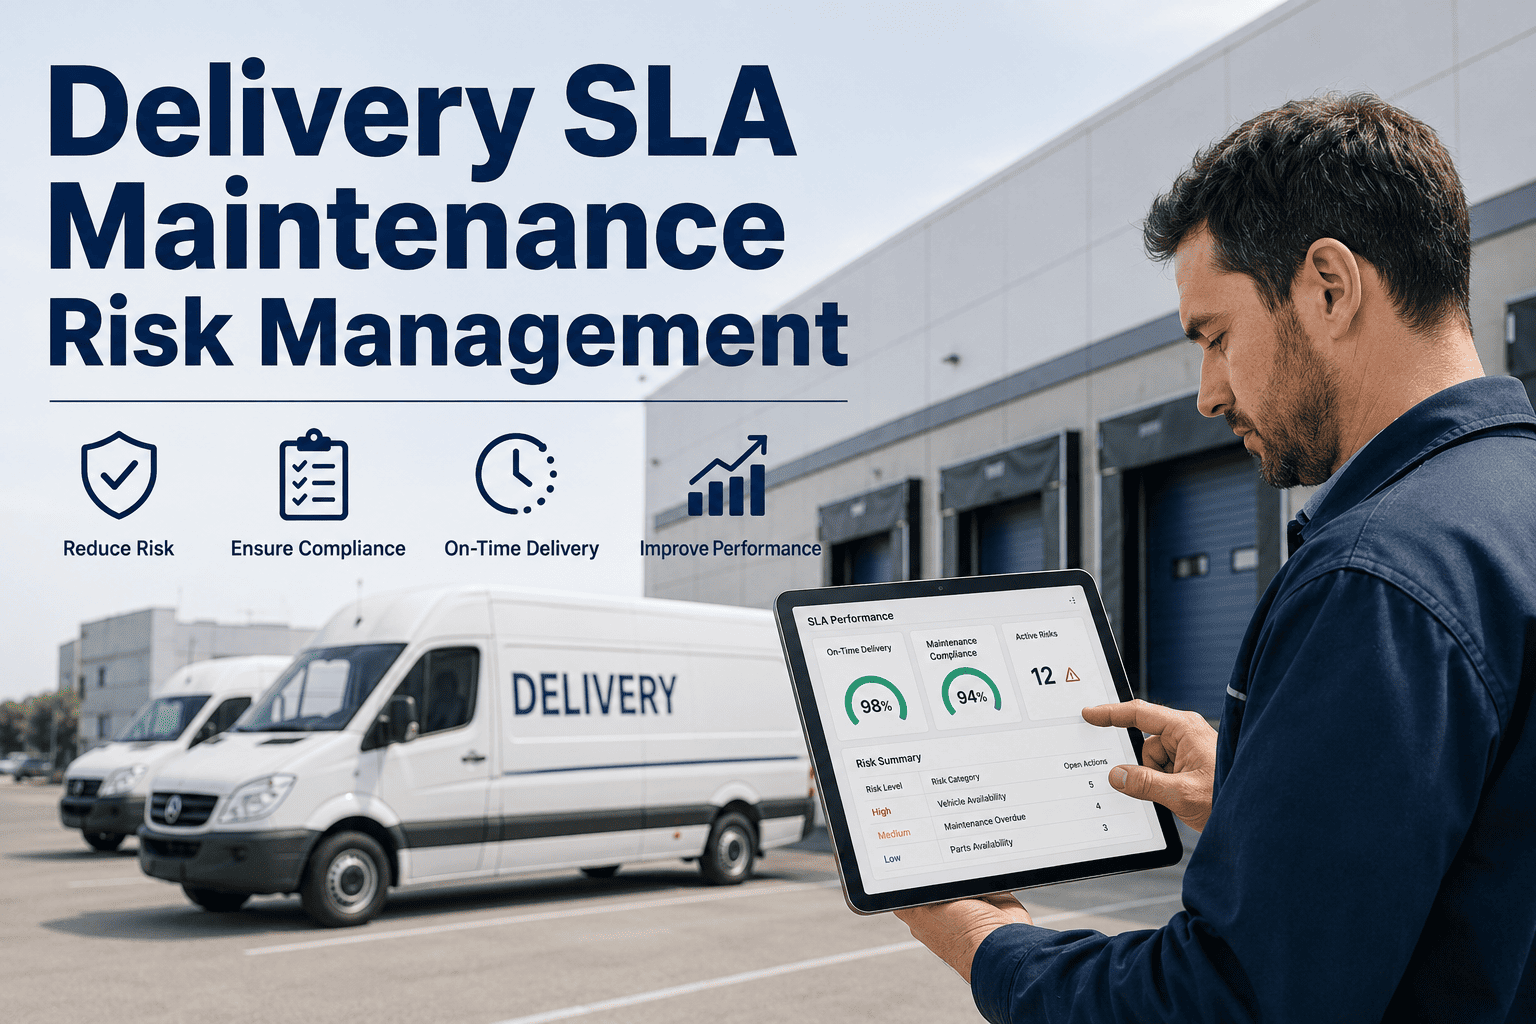
Automate delivery SLA reporting and maintenance compliance documentation. Reduce manual audit effort and stay audit-ready at all times.
What the Data Actually Reveals
When delivery operations start tracking the right metrics, patterns emerge that are invisible to teams running on instinct. The same vehicles fail repeatedly. The same routes miss SLAs every Thursday. The same maintenance tasks get skipped under pressure. Analytics surfaces these patterns so managers can act on root causes, not just symptoms. Book a demo to see how Oxmaint surfaces these patterns for your fleet.
20% of vehicles account for 60% of repair costs. Data identifies the bad actors so you can repair, replace, or retire them before they drain your budget.
Certain zones consistently produce late deliveries. Analytics shows whether the cause is traffic timing, stop density, or vehicle assignment — so you can fix the right thing.
Emergency repair costs spike on Mondays — vehicles pushed through Friday without PM. Weekly cost dashboards make this visible before it becomes a habit.
Pre-trip inspection completion drops by 40% on high-volume days. Identifying this lets managers address workload design rather than just remind drivers to comply.
Analytics vs. No Analytics: By the Numbers
| Performance Metric | Without Analytics | With Analytics Platform |
|---|---|---|
| Unplanned Breakdowns | High — reactive fixes only | Down 35–40% within 6 months |
| On-Time Delivery Rate | 68–72% avg | 90–95% with route data |
| Maintenance Cost/Vehicle | Unpredictable, peaks high | 20–30% lower, predictable |
| Decision Speed | Days (manual review) | Minutes (live dashboard) |
| SLA Compliance Reporting | Hours of manual compilation | Auto-generated, always ready |
| Parts Stockout Frequency | Common — reactive ordering | Near-zero with threshold alerts |
Building a Data-Driven Operation: The Three Stages
Move work orders, vehicle records, and maintenance logs off paper and spreadsheets into a single digital platform. This is the foundation — nothing else works without it.
Set up dashboards for on-time delivery, vehicle uptime, cost-per-stop, and PM compliance. Review weekly. Identify your top three performance gaps.
Use trend data to redesign underperforming routes, retire high-cost vehicles, and optimize PM schedules. Each decision is now backed by evidence, not experience alone.
Key Metrics That Define Data-Driven Delivery Performance
Tracking the right numbers is the difference between reacting to problems and preventing them. Sign up free to start tracking these metrics automatically across your entire fleet.
How Oxmaint Powers Data-Driven Delivery
Oxmaint is built for operations teams who need more than a maintenance log — they need a live intelligence platform. Start for free or book a walkthrough to see the full analytics suite in action.
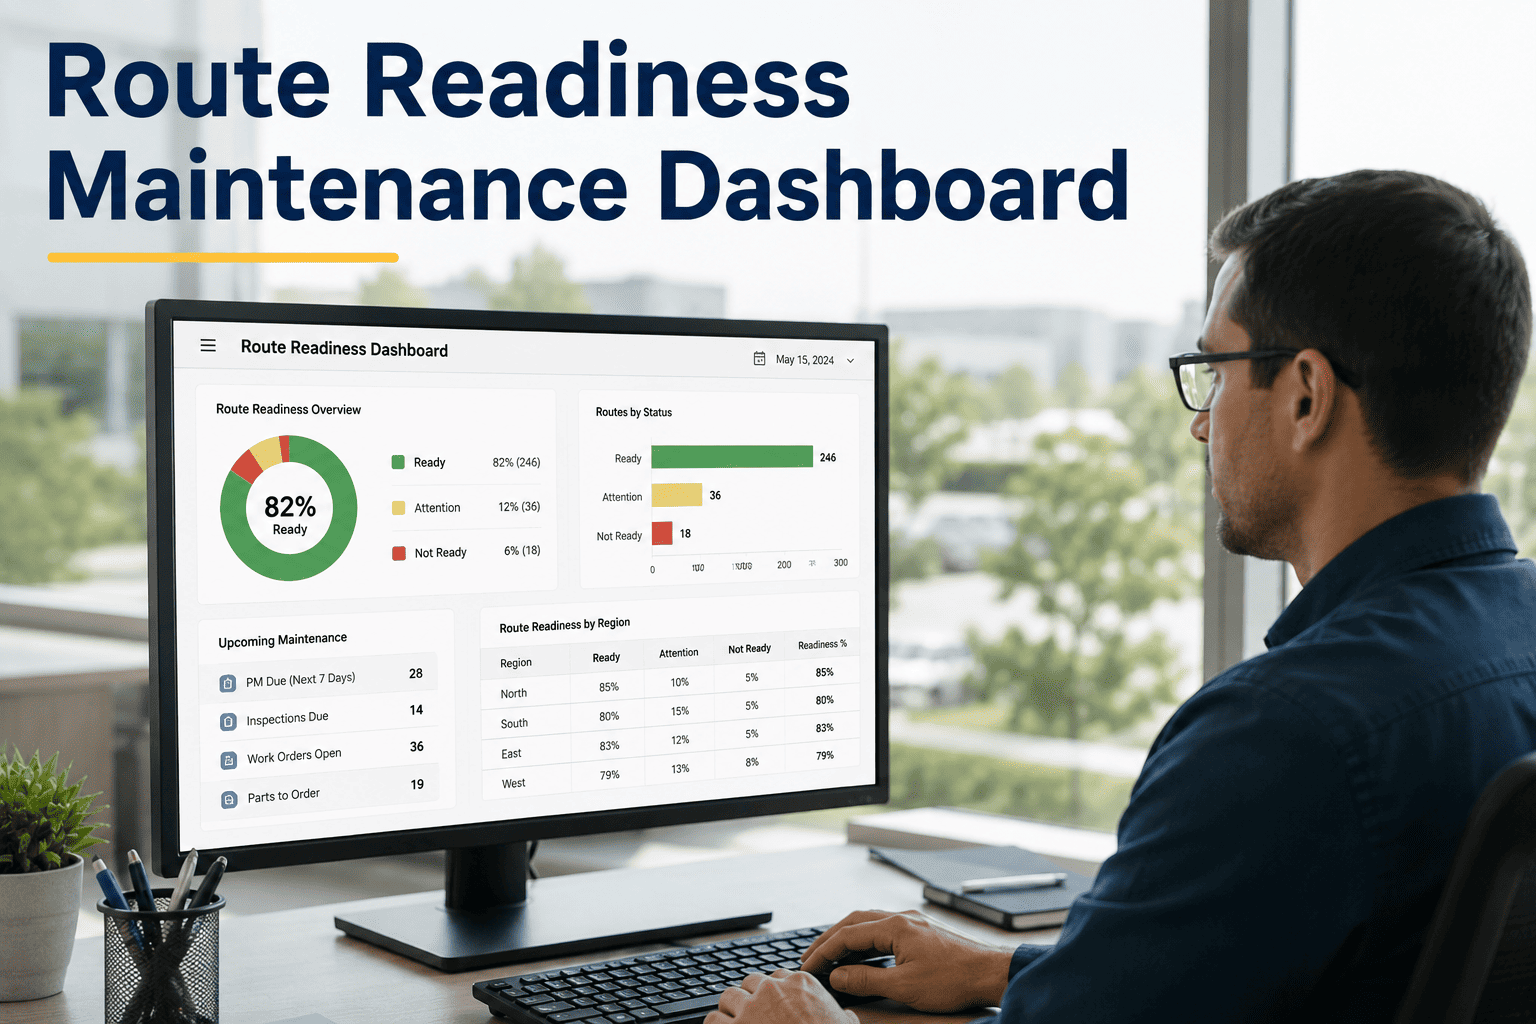
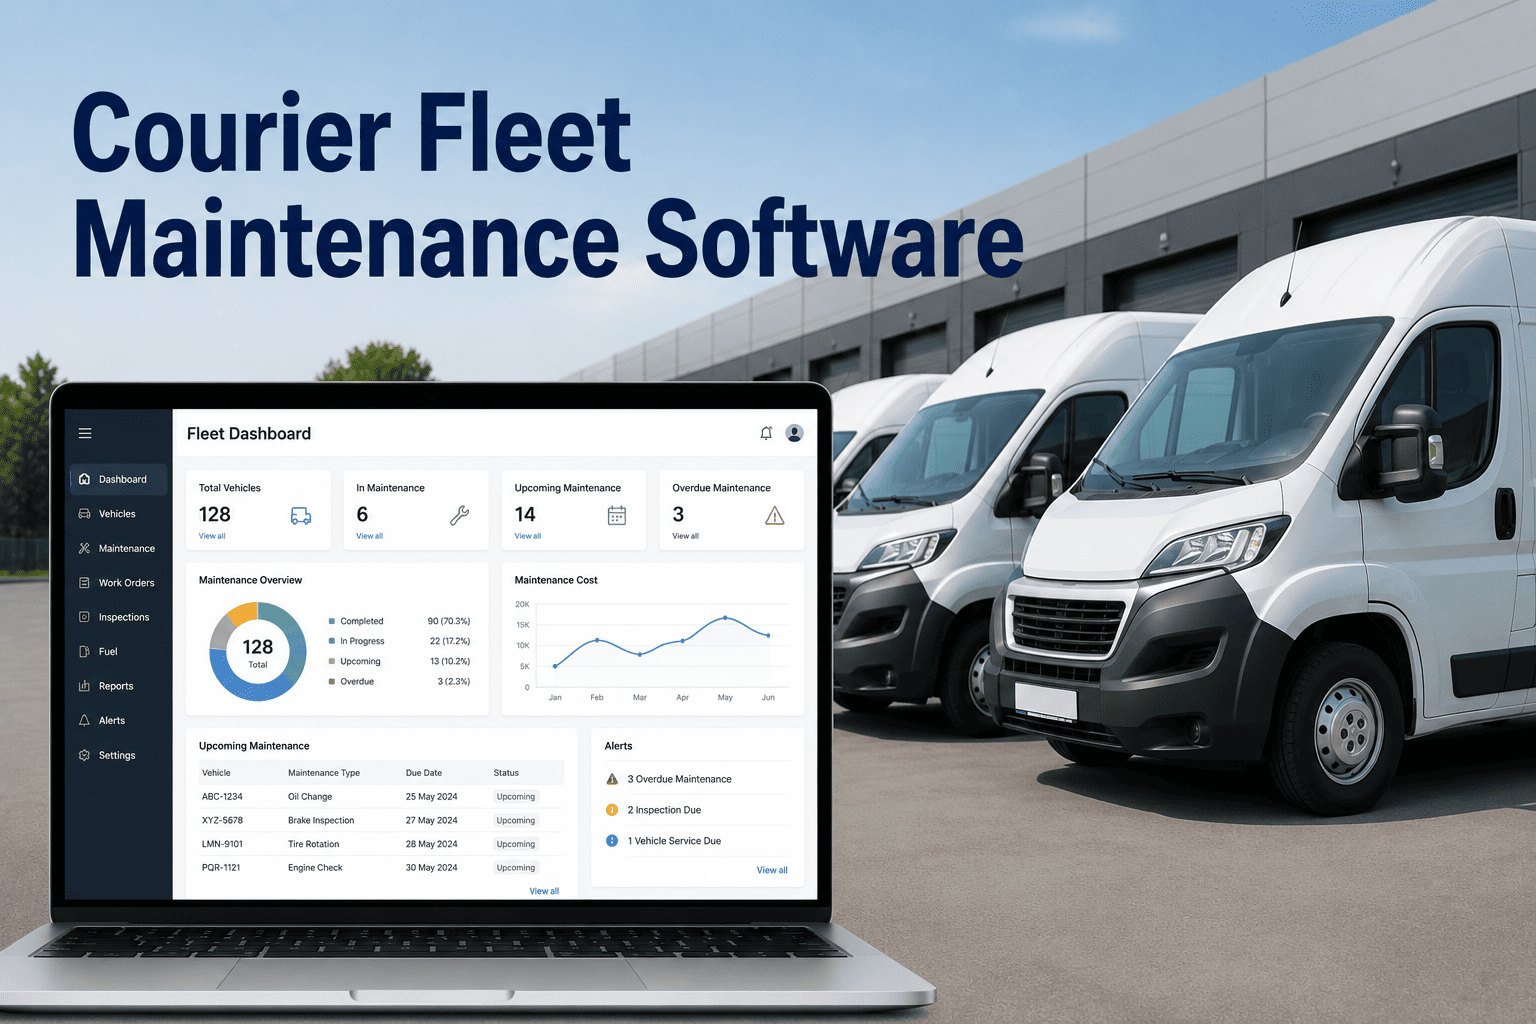
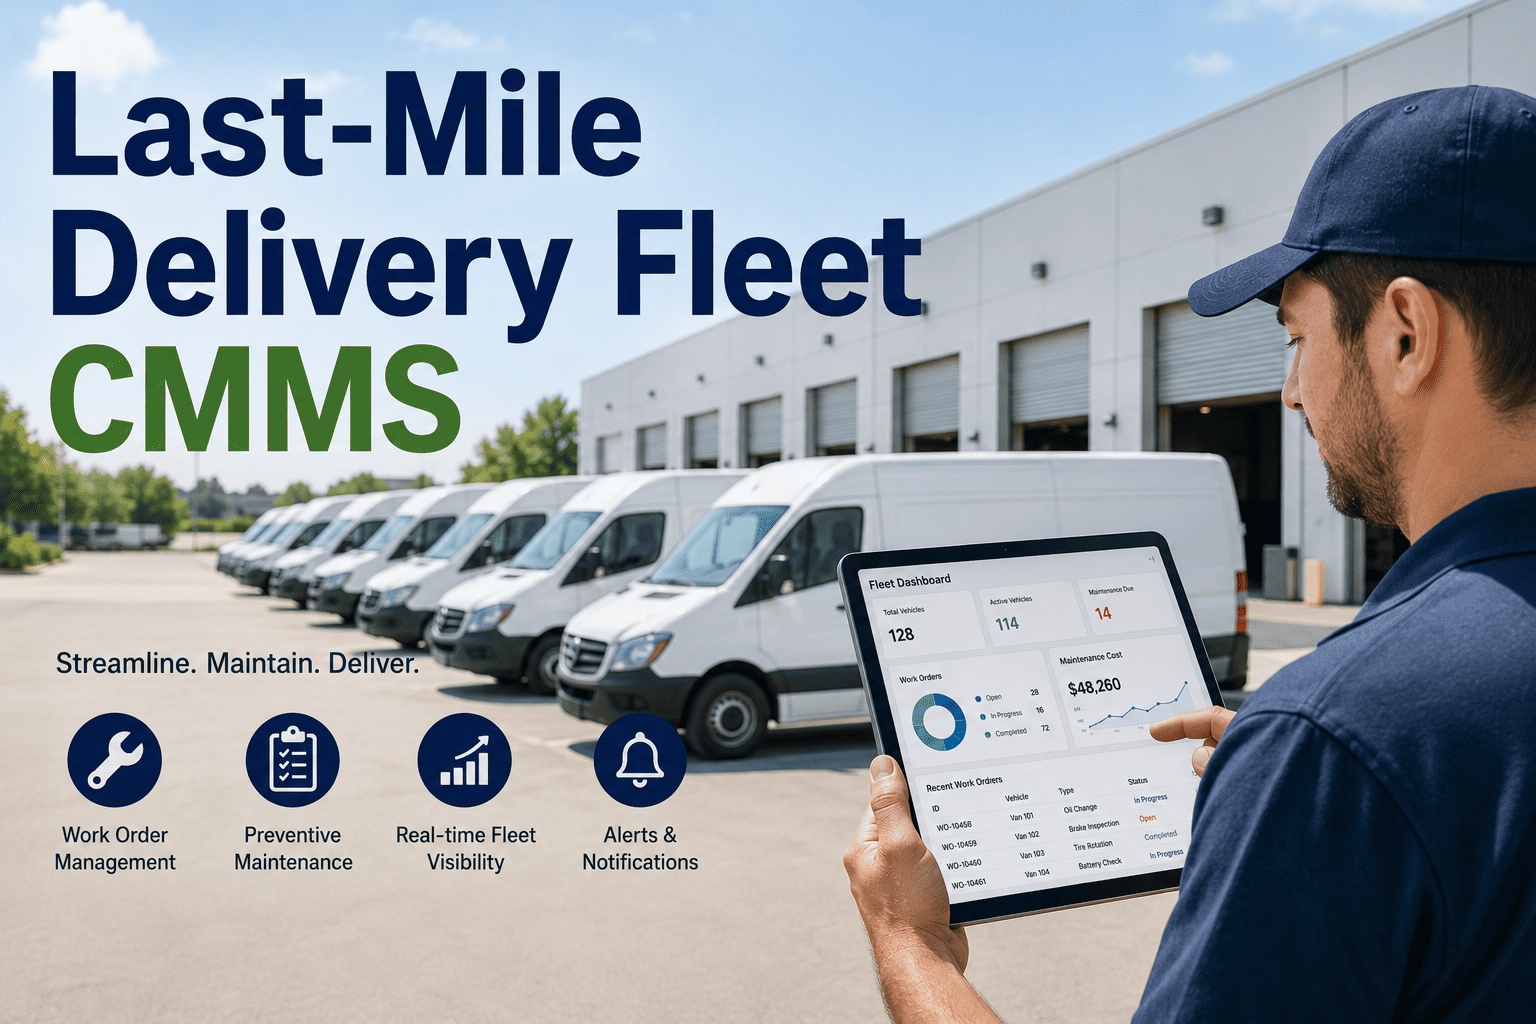
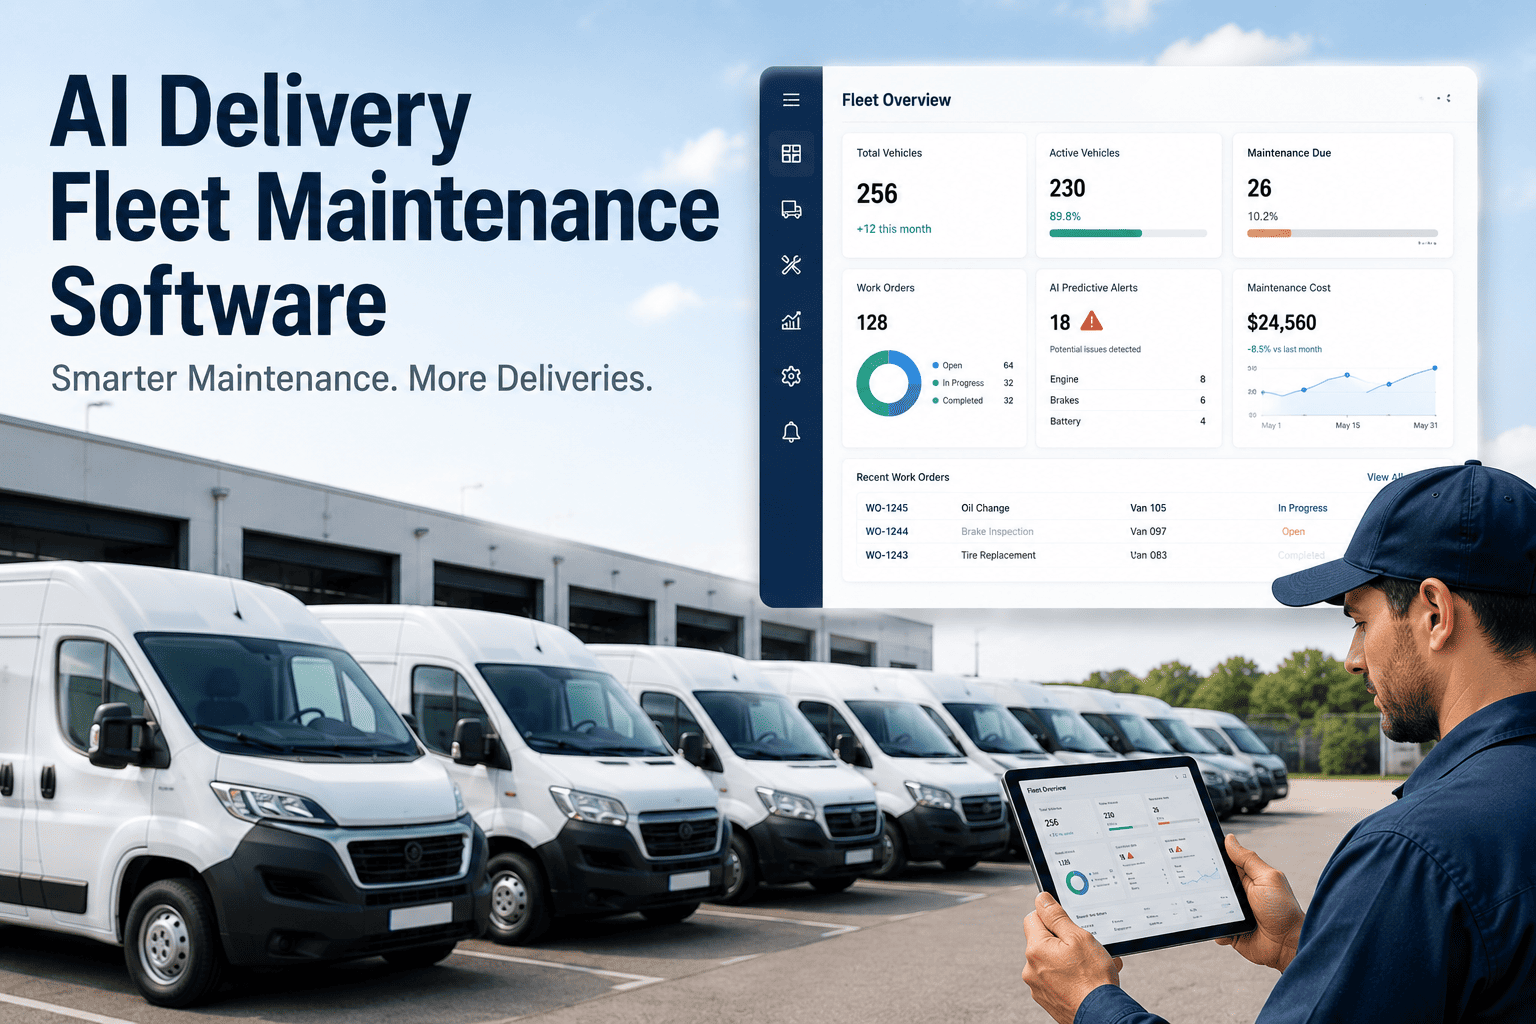
Real-time visibility into every vehicle's status, maintenance due dates, and active work orders — all in one screen, updated continuously.
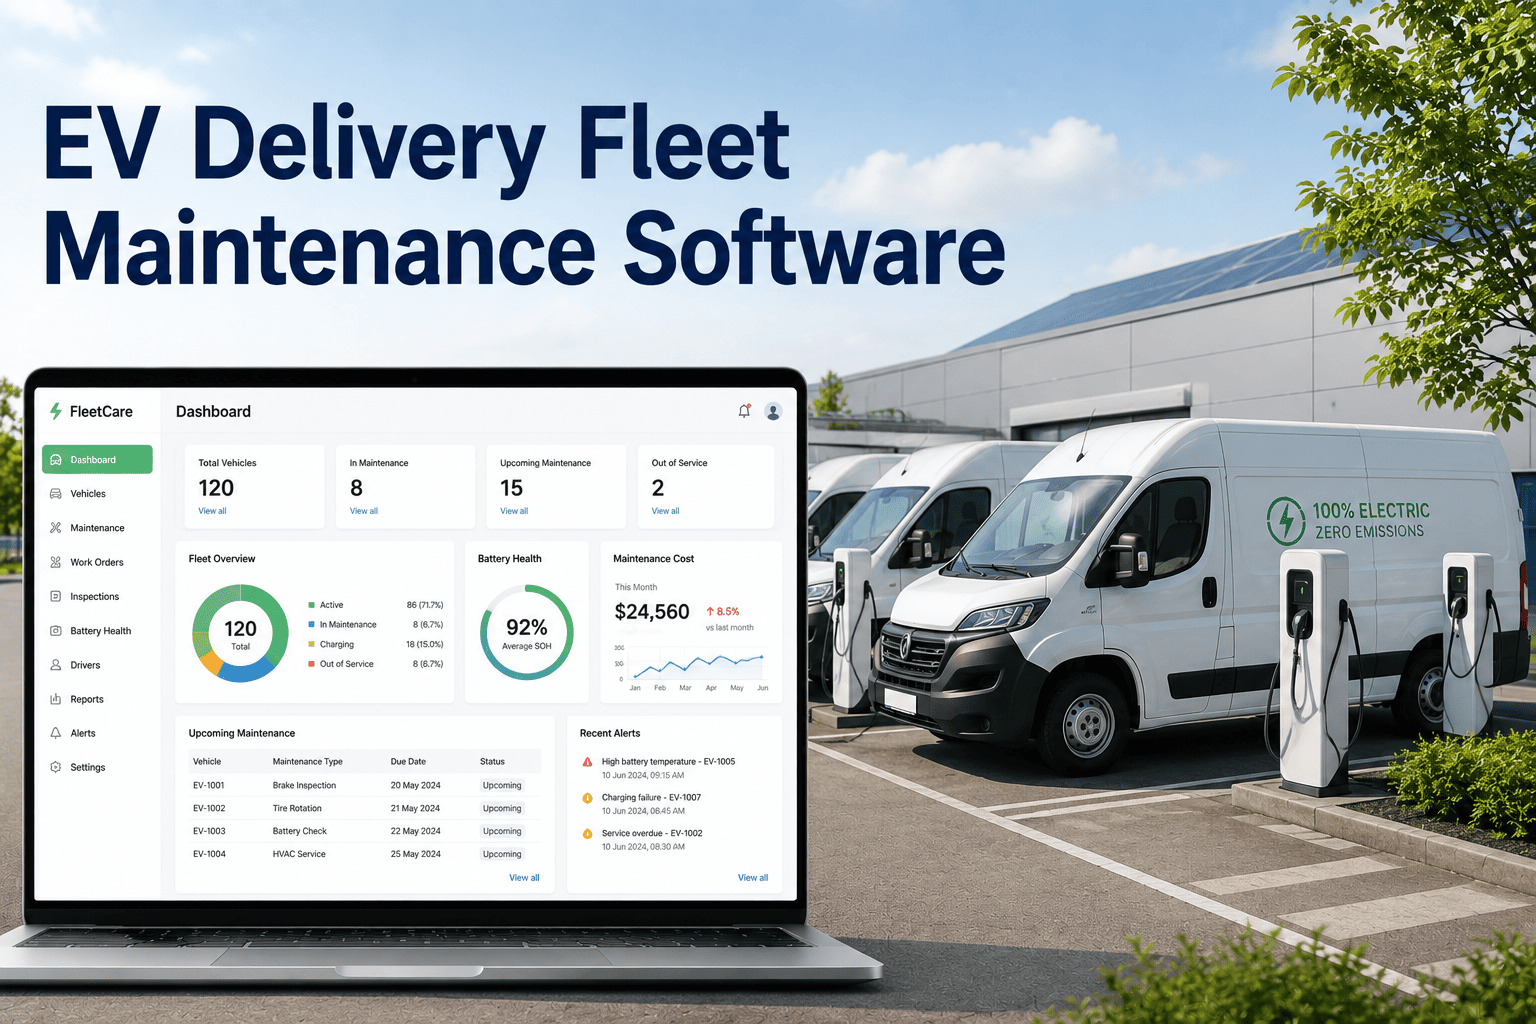
Automated reports on maintenance spend, downtime frequency, and cost-per-vehicle broken down by time period, route, or asset category.
Monitor which preventive maintenance tasks are on schedule, overdue, or at risk. Get alerts before compliance gaps turn into breakdowns.
Track consumption patterns for critical components, set automatic reorder thresholds, and eliminate stockouts that delay repairs.
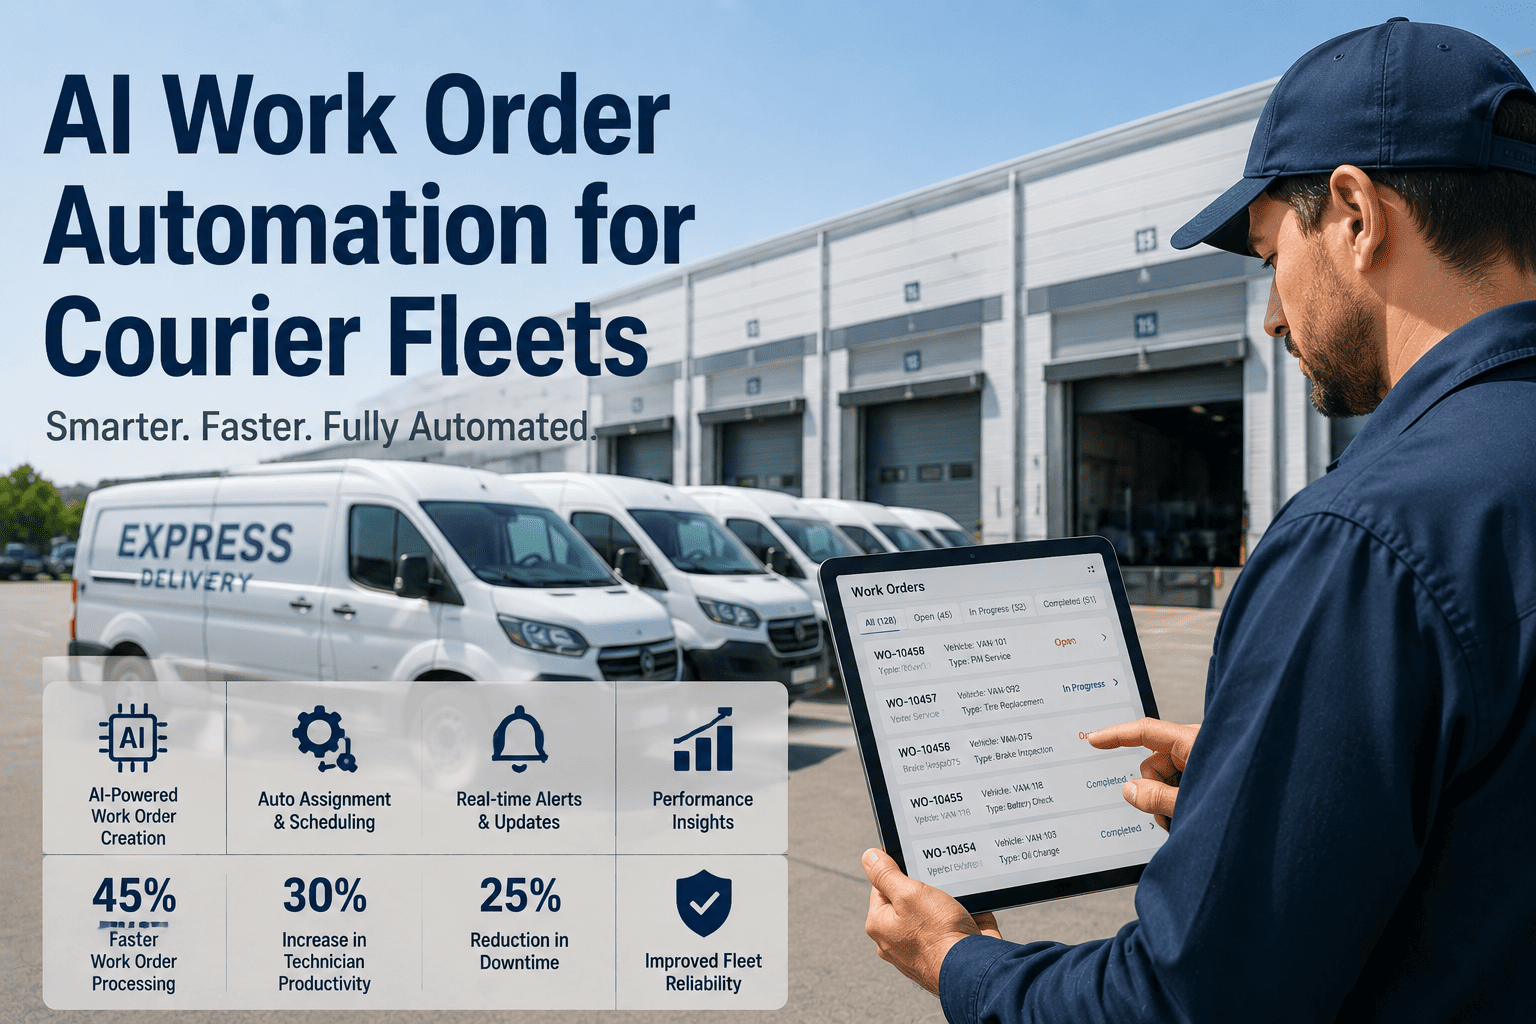
Measure technician response time, work order completion rates, and recurring failure patterns across your entire vehicle fleet.
Connect existing location tracking hardware to combine route data and vehicle health metrics in a unified analytics view.