High-growth logistics companies face a paradox: every new customer, new route, and new vehicle added to the network increases complexity faster than it increases capacity. A delivery network that worked efficiently at 40 vehicles and 8 routes starts breaking down at 80 vehicles and 18 routes — not because the fleet is bigger, but because the operational systems that managed the smaller network cannot scale. The companies that grow without hitting this wall share one characteristic: they treat network optimization as a continuous data discipline, not a periodic planning exercise. This guide covers the strategies, frameworks, and systems that high-growth logistics operators use to scale delivery networks without scaling their problems.
Strategic + Growth · Delivery Operations Management
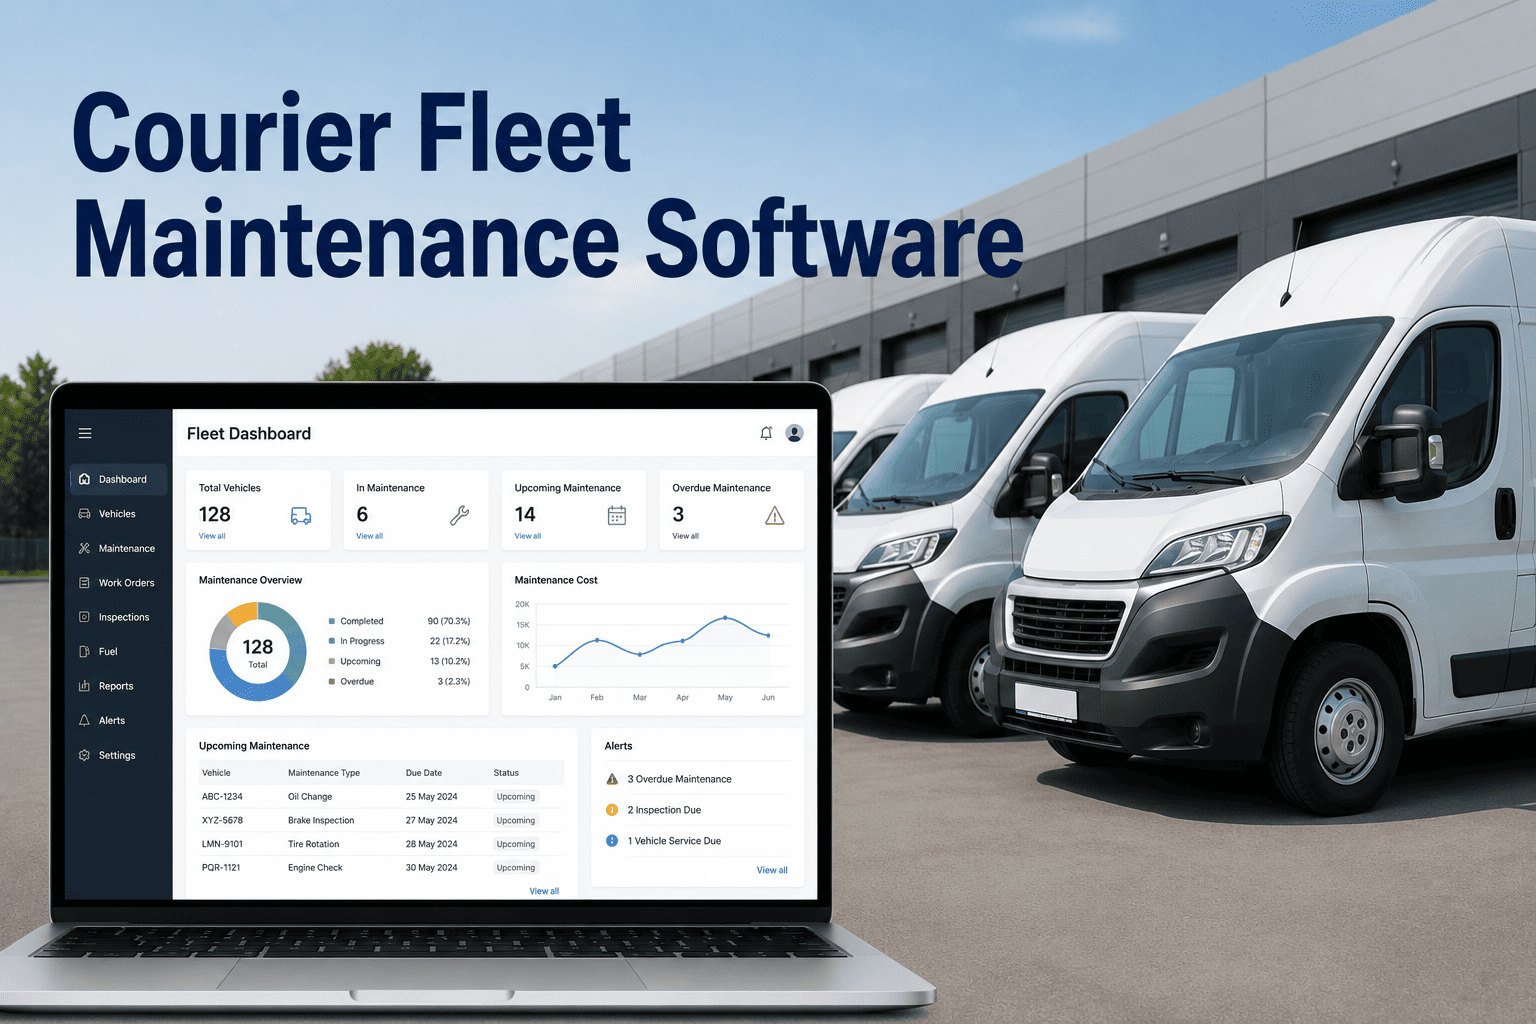
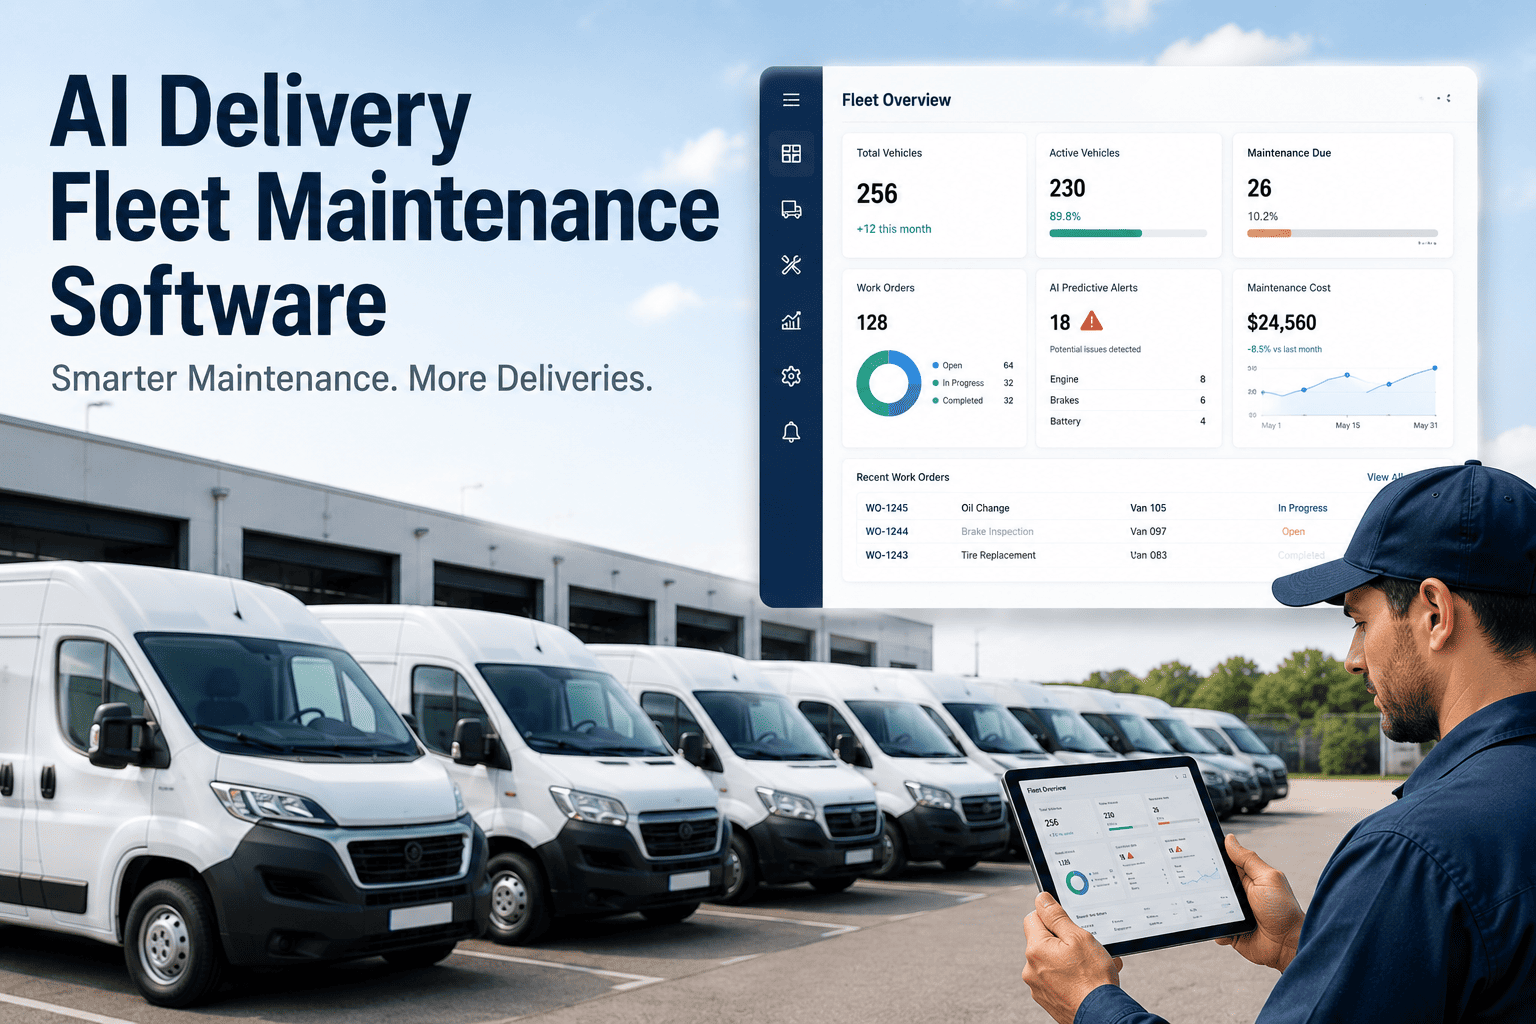
Delivery Network Optimization Strategies for High-Growth Logistics Companies
Advanced frameworks to reduce operational costs, improve fleet uptime, and scale logistics operations efficiently — without losing control of reliability or margins.
31%
Average logistics cost reduction achieved by companies using AI-driven network optimization vs. manual planning
2.4x
Revenue scalability advantage of digitally optimized networks over manually managed equivalents at growth stage
$260B
Annual cost of US logistics inefficiency — the majority concentrated in network design, capacity planning, and fleet management gaps
18 mo
Average time before manual fleet management systems visibly break down as logistics networks scale past 50 vehicles
The Network Optimization Maturity Ladder
Before choosing strategies, high-growth operators need to know where their network sits today. Most logistics companies scaling from 20 to 200 vehicles pass through four distinct capability stages — and the strategies that work at each stage differ significantly.
Level 1
Reactive Operations
Manual dispatch, paper DVIRs, calendar-based maintenance, no real-time visibility. Vehicle breakdowns are discovered when drivers call dispatch. SLA breaches are reported after they occur. Route planning is tribal knowledge, not data.
Most SMB logistics companies at under 30 vehicles
Level 2
Digitized Operations
Digital maintenance records, GPS tracking, basic telematics, structured route planning. Data exists but lives in silos — maintenance team does not see route data, dispatch does not see vehicle health scores. Manual reporting dominates decision-making.
Typical for 30–80 vehicle fleets that have deployed basic software
Level 3
Connected Operations
Integrated CMMS and telematics, vehicle health feeds dispatch decisions, automated PM scheduling, real-time fleet dashboard. Decisions are data-driven. Unplanned events are the exception, not the norm. SLA compliance improves significantly at this stage.
High-growth fleets that have invested in integration between systems
Level 4
Predictive and Optimized
AI route optimization, predictive maintenance from sensor data, SLA risk scoring per delivery, automated work order routing, capacity forecasting across the network. The system surfaces decisions — humans approve them. Network scales with volume, not headcount.
Top-quartile logistics operators — achievable within 12–18 months of structured implementation
Strategy 01 — Fleet Health as a Network Asset
Most logistics companies manage fleet maintenance as a cost center. High-growth operators treat vehicle health as a network capacity asset — because every unplanned vehicle loss is a capacity reduction that impacts route coverage, SLA performance, and customer retention simultaneously.
The Cost of Treating Maintenance as an Afterthought
Each unplanned breakdown removes 1 vehicle from network capacity for 18–48 hours on average
Emergency repair costs run 40–65% higher than planned maintenance interventions
Mid-route failures cascade into 15–20 SLA misses per event for a typical 30-stop route
Driver retention declines measurably in fleets where vehicles break down frequently
The Network-First Maintenance Approach
Predictive maintenance detects degradation 4–7 days before failure — maintenance is scheduled, not discovered
Condition-based PM replaces calendar-based scheduling — reducing both over-maintenance and under-maintenance
Vehicle health scores feed dispatch directly — route assignments reflect actual vehicle capability
Full maintenance history per vehicle enables accurate resale, insurance, and warranty decisions at scale
Strategy 02 — Capacity Planning Before You Need It
Network Zone Mapping
Divide your delivery geography into zones and model vehicle requirements per zone at current volume and at 1.5x, 2x, and 3x volume. Zone-level capacity planning reveals where vehicle additions are actually needed vs. where route restructuring solves the problem without new assets.
Vehicle Utilization Rate Targeting
Networks operating below 72% vehicle utilization are carrying excess capacity that costs money daily. Networks above 88% are one breakdown away from capacity failure. The 78–85% utilization target balances cost efficiency with reliability buffer — and CMMS data is the only accurate way to calculate true utilization.
Fleet Age and Replacement Forecasting
High-growth fleets that cannot predict which vehicles will need replacement in the next 12–24 months cannot plan capital budgets accurately. A CMMS with full lifecycle data produces replacement forecasts per vehicle — so capital planning reflects actual condition, not age assumptions that routinely miss by 30–50%.
Seasonal Demand Buffering
Logistics networks that spike 30–60% in Q4 and holiday periods need vehicle availability buffers that are built from data, not guesswork. Predictive maintenance schedules should complete critical services in September–October — ensuring full capacity availability precisely when network demand peaks.
Scale your delivery network on a foundation of real fleet data
OxMaint gives high-growth logistics companies the CMMS platform that connects maintenance history, vehicle health, and capacity planning into a single operational data layer — the foundation every network optimization strategy depends on.
Strategy 03 — Route Architecture for Scale
Route optimization for a 20-vehicle fleet is a planning exercise. Route optimization for a 120-vehicle fleet is a continuous data operation. The architectural decisions made at growth stage determine whether the network can be optimized at scale — or whether it gets rebuilt every time volume doubles.
Static Route Architecture
Fixed zones, fixed drivers, fixed stop sequences. Efficient at small scale. Brittle at growth. A single vehicle failure or driver absence collapses multiple routes with no algorithmic fallback. Capacity cannot flex with demand variance.
FlexibilityVery Low
Failure RecoveryManual, Slow
ScalabilityBreaks at 2x
Setup CostLow
Dynamic Route Architecture
AI-optimized route generation that accounts for vehicle health, driver availability, delivery window constraints, load capacity, and real-time conditions. Failures are redistributed algorithmically. Capacity scales with data, not manual replanning effort.
FlexibilityHigh
Failure RecoveryAutomated
ScalabilityScales linearly
Setup CostPlatform + data
Strategy 04 — The Cost Reduction Levers That Actually Move at Scale
Predictive maintenance converts emergency repairs to planned interventions. Emergency repair costs 40–65% more than planned. For a 100-vehicle fleet, eliminating 80% of unplanned events typically saves $280,000–$420,000 annually — the single highest-ROI optimization in network management.
AI route optimization and load density improvements increase the number of stops each vehicle completes per shift. This directly reduces cost per delivery and extends the useful capacity of existing assets — delaying fleet expansion capital by 6–12 months while volume grows.
Static routes waste fuel through suboptimal sequencing, missed load consolidation, and no accounting for real-time traffic. AI route optimization combined with driver behavior coaching consistently delivers 15–22% fuel savings across the network — a compounding cost advantage as fleet size grows.
Per-delivery SLA risk scoring with 30–90 minute early warning allows dispatch to intervene before a breach is recorded. As network volume grows, SLA exposure compounds — a 3% miss rate on 1,000 daily deliveries is 30 penalties per day. Proactive risk management eliminates the majority at the route level.
Network Optimization KPIs: What to Measure at Every Growth Stage
Target: 78–85%
The primary network efficiency indicator. Below 72% means excess capacity. Above 88% means no buffer for failures. Growing networks need this tracked per zone to identify where true capacity gaps exist.
Target: 97%+
Percentage of scheduled vehicle hours where mechanically available vehicles were deployed. Every downtime percentage point represents lost network capacity — and in high-growth networks, capacity gaps translate directly to unmet demand.
Target: Decreasing YoY
The ultimate network efficiency metric. Fuel, maintenance, driver, overhead divided by delivery volume. High-growth networks should see cost per delivery fall as volume scales — if it is rising or flat, the network has an optimization problem.
Target: 90%+ planned
The most important leading indicator of network reliability. Networks below 70% planned maintenance will not sustain SLA commitments at growth scale. This ratio must improve before capacity expansion — adding vehicles to a reactive maintenance environment amplifies costs, not capacity.
Target: 95%+
On-time delivery rate across the full network. At growth scale, even small SLA miss rates generate significant penalty and churn costs. A 2% miss rate on 2,000 daily deliveries is 40 penalties per day — compounding into contract risk that limits further growth.
Target: Increasing YoY
Measures how effectively route optimization is maximizing vehicle productivity. Growing this metric without adding vehicles directly improves network margin. Stagnant or declining rates signal route architecture problems that need to be addressed before scaling the fleet further.
Network Optimization ROI — 100-Vehicle Logistics Fleet
Savings Source
Predictive maintenance (unplanned event reduction)$380,000
Route optimization (fuel and capacity gains)$290,000
SLA penalty elimination$220,000
Driver retention improvement$140,000
Fleet capacity extension (deferred expansion)$180,000
Total Annual Savings$1,210,000
Annual Investment
Fleet CMMS platform$32,000
Telematics integration$18,000
Implementation and training$14,000
Total Annual Investment$64,000
$1.15M
Net Annual Savings
Key Takeaways: Network Optimization for Growth-Stage Logistics
→
You cannot optimize what you cannot measure: Every network optimization strategy — predictive maintenance, route optimization, capacity planning, SLA risk management — depends on clean, structured fleet data. The CMMS is not the optimization tool itself. It is the data foundation that makes every other optimization tool accurate.
→
Fleet reliability must scale before route volume does: Adding vehicles and routes to a reactive maintenance environment amplifies cost and downtime, not capacity. The planned maintenance ratio must reach 85%+ before network expansion — otherwise each new vehicle added brings proportionally more unplanned failures into the network.
→
Cost per delivery is the growth-stage metric that matters most: Revenue growth is easy to generate by adding vehicles and routes. Margin growth requires that cost per delivery falls as volume scales. Networks where cost per delivery stays flat or rises at growth are building toward a margin crisis that becomes visible around the 80–120 vehicle threshold.
→
The highest-ROI network investment is almost always in maintenance management: Across 100-vehicle network models, predictive maintenance consistently generates the largest single cost savings — $280,000–$420,000 annually — against the lowest investment. It is the optimization that enables all other optimizations by keeping the physical network available and operating as planned.
High-Growth Delivery Networks Are Built on a Single Foundation: Fleet Data
OxMaint gives logistics companies scaling from 20 to 200+ vehicles the fleet maintenance management platform that connects vehicle health, maintenance history, and operational analytics — turning the data your fleet generates every day into the network intelligence that drives down cost and scales up capacity.
Full vehicle lifecycle and maintenance history
Automated PM and predictive maintenance alerts
Real-time fleet health and uptime dashboard
Analytics-ready data for every optimization decision
Frequently Asked Questions
What is delivery network optimization and why does it matter at growth stage?
Delivery network optimization is the continuous process of configuring fleet assets, routes, capacity, and maintenance programs to maximize delivery volume and service quality at minimum cost. It matters most at growth stage because operational complexity scales faster than revenue without systematic optimization. Manual processes that work at 30 vehicles begin failing visibly at 60–80 vehicles — generating SLA breaches, rising cost per delivery, and capacity gaps that limit further growth. High-growth logistics companies that implement systematic fleet and route optimization consistently achieve 2x–3x more efficient scaling than operators relying on manual processes and tribal knowledge.
What should a logistics company optimize first when scaling its delivery network?
Fleet reliability — specifically, the shift from reactive to predictive maintenance — should be the first optimization priority. Every other improvement (route optimization, SLA management, capacity planning) depends on vehicles being available when scheduled. A network where 10–15% of vehicles are unexpectedly unavailable at any given time cannot be reliably optimized at the route or capacity level. The planned maintenance ratio — targeting 85%+ planned vs. unplanned maintenance events — is the most reliable leading indicator of network optimization readiness. Once fleet reliability is established, route architecture, capacity planning, and AI optimization tools can be layered on a stable foundation.
How does fleet maintenance management connect to network optimization?
Fleet maintenance management is the primary source of two types of data that network optimization depends on: vehicle availability data (which vehicles are operational, which are in maintenance, which have health flags that should constrain route assignment) and vehicle lifecycle data (which vehicles need capital replacement in the next 12–24 months, what the maintenance cost trend per vehicle looks like, which assets are generating disproportionate repair cost vs. operational value). Without a CMMS generating this data continuously, network optimization tools are working with incomplete information — and route optimization built on vehicles that break down mid-route generates costs, not savings.
What ROI can a high-growth logistics company expect from network optimization investment?
A 100-vehicle logistics network investing approximately $64,000 annually in fleet CMMS and integration infrastructure can expect $1.15M in annual net savings — a 19x first-year ROI. The largest savings components are predictive maintenance ($380,000), route optimization and fuel efficiency ($290,000), and SLA penalty elimination ($220,000). Driver retention improvement ($140,000) and fleet capacity extension through deferred expansion ($180,000) are significant secondary benefits. The payback period for the full platform investment is approximately 19 days of realized savings — making this among the highest-certainty ROI investments available to growth-stage logistics operators.
What is the right vehicle utilization target for an optimizing delivery network?
The optimal vehicle utilization range for a growth-stage delivery network is 78–85%. Below 72% indicates excess capacity that is generating fixed costs without proportional delivery volume — a signal to grow volume before adding vehicles. Above 88% indicates insufficient buffer capacity — a single cluster of vehicle failures or a demand spike will cause immediate capacity failure with no recovery option. The 78–85% band provides cost efficiency while maintaining the reliability buffer that a network operating in dynamic conditions (weather, traffic, demand variance) requires. This range should be tracked per geographic zone, not just at the network aggregate level, since capacity gaps are often localized rather than fleet-wide.