A 2% SLA miss rate sounds manageable. On 500 daily deliveries, that is 10 missed windows per day. Over a 22-day operating month, that is 220 breach events — each one a recorded failure in your customer's carrier scorecard, a potential penalty trigger, and a data point moving you closer to a contract review you do not want. At scale, SLA performance is not a driver issue or a traffic issue. It is a systems issue. The logistics companies that consistently hit 97%+ on-time rates do it through data infrastructure — per-delivery risk scoring, real-time fleet health visibility, automated early warnings, and maintenance programs that keep vehicles on route. This guide covers the full SLA management framework.
Performance + KPI Focus · Delivery Operations Management
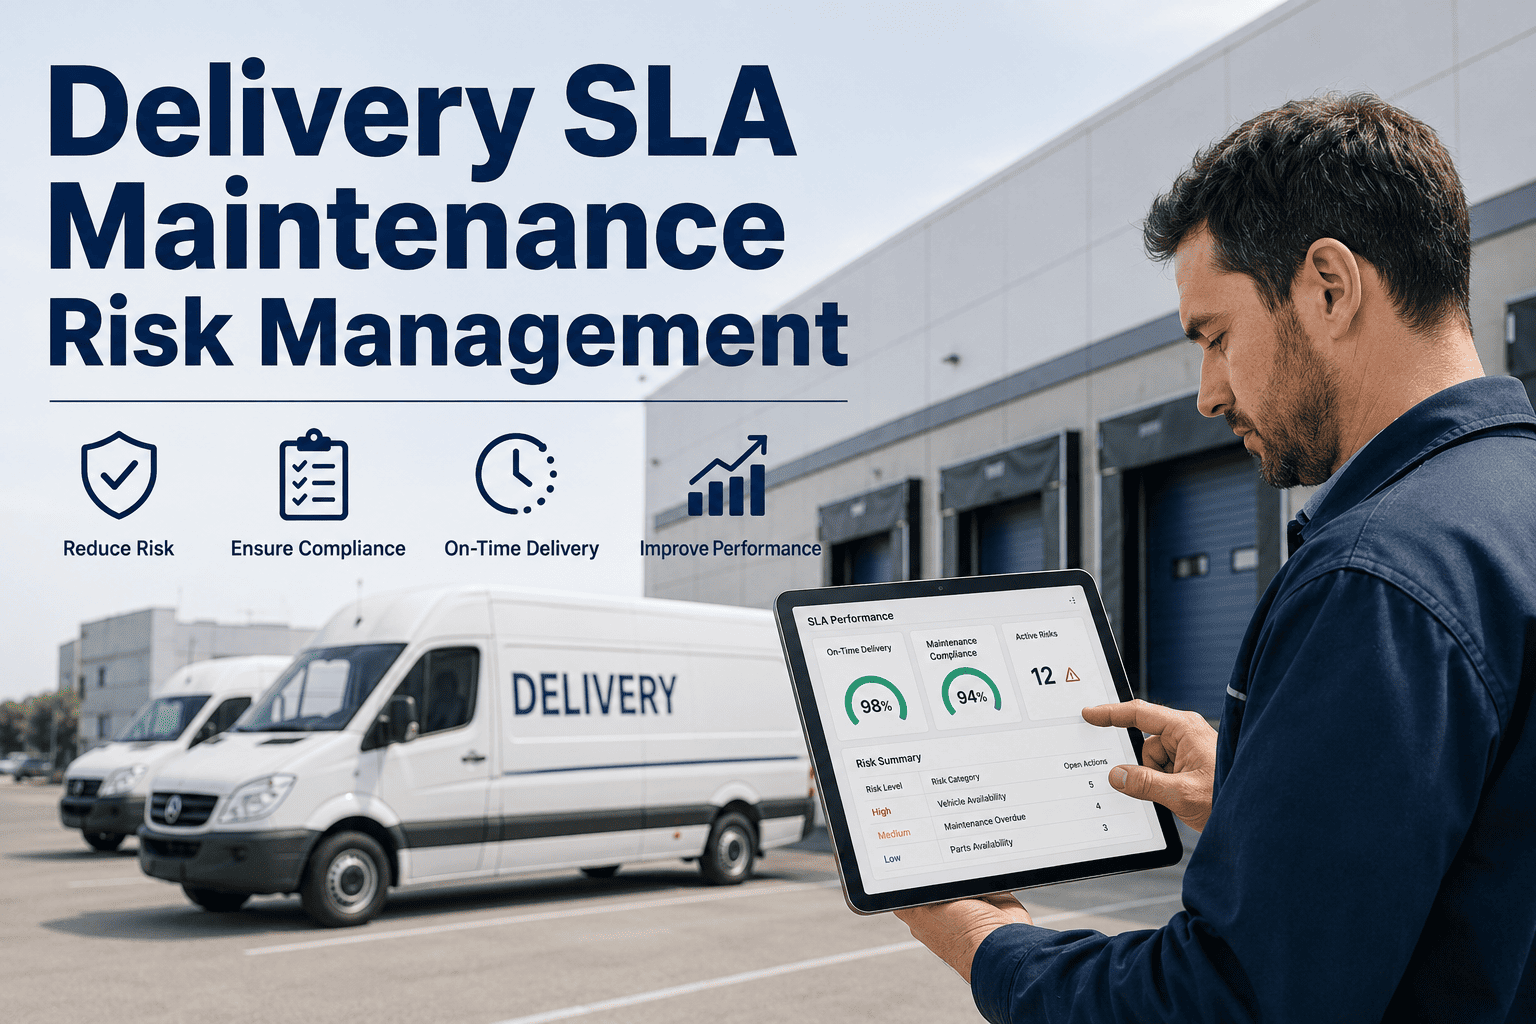
Delivery SLA Management: Improving On-Time Performance at Scale
The systems, KPIs, and operational frameworks that logistics companies use to hit 97%+ on-time delivery rates — consistently, across large networks, without adding headcount.
$1.47
Average cost of a single failed delivery attempt including redelivery, admin, and penalty exposure
26%
Of all SLA breaches trace directly to vehicle mechanical failure — the most preventable single cause
3x
Higher contract churn for carriers whose SLA miss rate exceeds 5% vs. those consistently below 3%
95%+
On-time performance achievable with systematic SLA management vs. 88–91% typical for reactive fleets
Why SLA Performance Breaks Down at Scale
01
No Per-Delivery Risk Visibility
At scale, dispatch cannot monitor every delivery manually. Without a system scoring each delivery's SLA risk in real time — accounting for vehicle position, traffic, remaining stops, and window closing time — breaches are discovered after they occur, not before.
Failure Mode: Reactive, not predictive
02
Vehicle Failures With No Early Warning
A mid-route breakdown on a 35-stop route cascades into 15–22 SLA breaches with zero advance warning. Without predictive maintenance flagging the vehicle 4–7 days before failure, the first signal dispatch receives is a driver call — after the route has already collapsed.
Failure Mode: Mechanical risk invisible until it fails
03
SLA Data Siloed From Operations
When SLA performance data lives in a reporting system and fleet health data lives in a maintenance system, the connection between why breaches happen and what to fix operationally is never made. The same failure causes repeat month after month.
Failure Mode: Data exists but does not drive action
04
Penalty Accumulation Without Root Cause Visibility
SLA penalty reports show what was missed. They rarely show why — which vehicles, routes, drivers, and customer windows are generating disproportionate breach risk. Without root cause analytics, teams apply general effort to a problem with specific, fixable causes.
Failure Mode: Treating symptoms, not causes
Identifying which failure mode drives your SLA miss rate is the first step. Sign up free and get the fleet health and performance data that surfaces your root causes from day one.
The SLA Management Stack: Four Operational Layers
Layer 1
Fleet Reliability Foundation
SLA performance cannot be managed above fleet mechanical reliability. A network where 10–15% of vehicles carry unresolved maintenance flags is structurally incapable of consistent SLA compliance. Predictive maintenance eliminates the mechanical failure category from SLA risk entirely — this is the layer every other layer depends on.
Impact: Eliminates 26% of SLA breaches at source
Layer 2
Route Architecture and Load Optimization
Routes that are structurally over-committed will miss SLA windows regardless of driver performance. AI route optimization builds routes that are achievable against contracted delivery windows — accounting for vehicle load capacity, realistic traffic patterns, and actual delivery dwell time per customer type.
Impact: 12–18% reduction in route-structure-driven SLA misses
Layer 3
Real-Time SLA Risk Scoring and Early Warning
Per-delivery SLA risk scoring runs continuously during active routes — calculating breach probability for each remaining delivery. Deliveries crossing a risk threshold trigger automated dispatcher alerts with 30–90 minutes of lead time — enough time to reroute, reassign, or contact the customer before breach is recorded.
Impact: 70–85% of at-risk deliveries rescued before breach
Layer 4
Performance Analytics and Root Cause Tracking
Post-delivery SLA analytics identify breach patterns at the vehicle, route, driver, customer, and time-of-day level. A fleet where 80% of SLA breaches trace to 12% of vehicles can be fixed precisely. Without this analytics layer, the same failure patterns repeat indefinitely.
Impact: SLA miss rate declining quarter over quarter
Want to see all four layers working together? Book a demo and we will show you how OxMaint connects fleet health data to each layer of your SLA management stack.
SLA management at scale requires data infrastructure — not just effort
OxMaint provides the fleet maintenance and health data layer that feeds every SLA management system — real-time vehicle status, predictive maintenance alerts, full maintenance history, and the analytics that connect fleet condition to on-time delivery performance.
SLA Performance Benchmarks by Fleet Size and Management Maturity
| Fleet Size |
Reactive Fleet |
Digitized Fleet |
Connected Fleet |
Optimized Fleet |
Annual Penalty Delta |
| 20–40 vehicles |
88–91% |
92–94% |
95–97% |
97–99% |
$48K–$96K |
| 40–80 vehicles |
86–90% |
91–93% |
94–96% |
97–99% |
$120K–$240K |
| 80–150 vehicles |
84–88% |
89–92% |
93–95% |
96–98% |
$280K–$560K |
| 150–300 vehicles |
82–87% |
88–91% |
92–95% |
95–98% |
$620K–$1.2M |
| 300+ vehicles |
80–85% |
86–90% |
91–94% |
95–98% |
$1.4M–$3.2M |
The Mechanical Failure — SLA Connection: By the Numbers
1 Vehicle Breakdown
Mid-route, 35-stop route
→
15–22 SLA Breaches
Remaining stops on failed route
→
$22–$33 Per Penalty
Typical enterprise contract rate
→
$330–$726 Per Event
Penalties alone — before repair costs
Add emergency repair premium ($800–$2,400), redelivery ($44–$88), and overtime ($180–$420) — a single unplanned breakdown costs $1,354–$3,634 total. For a 50-vehicle fleet with 8 unplanned events per month: $130K–$348K annually in fully avoidable cost.
Unplanned breakdowns / month8–12 events
SLA breaches from mechanical failure120–264 / month
Emergency repair premium$9,600–$28,800
Monthly mechanical SLA penalties$2,640–$5,808
Monthly cost: $12,240–$34,608
Unplanned breakdowns / month1–2 events
SLA breaches from mechanical failure15–44 / month
Emergency repair premium$1,200–$2,400
Monthly mechanical SLA penalties$330–$968
Monthly cost: $1,530–$3,368
SLA KPI Reference Table
| KPI |
Definition |
Target |
Warning Level |
Primary Driver |
| On-Time Delivery Rate |
% deliveries completed within contracted window |
97%+ |
Below 93% |
Route design + fleet uptime |
| First-Attempt Success Rate |
% deliveries completed on first attempt |
95%+ |
Below 88% |
Customer data + windows |
| SLA Near-Miss Rate |
Deliveries within 15 min of window close |
Under 5% |
Above 10% |
Route load + traffic buffers |
| Mechanical Breach Rate |
SLA misses caused by vehicle failure |
Under 0.5% |
Above 2% |
Predictive maintenance |
| Breach Root Cause Split |
% mechanical / route / driver / external |
Mechanical under 15% |
Mechanical above 30% |
Fleet health management |
| SLA Penalty per Vehicle |
Monthly penalty cost ÷ active vehicles |
Under $28 |
Above $80 |
Combined SLA program |
The Mechanical Breach Rate is the most directly controllable KPI — entirely addressable through a predictive maintenance program. Sign up free and start tracking the vehicle health data that drives this metric toward zero.
90-Day SLA Improvement Action Plan
Days 1–30: Data Foundation
1
Deploy CMMS — baseline every vehicle with current health status, maintenance history, and open work orders. Identify vehicles with unresolved flags active on routes today.
2
Pull 90-day SLA breach data and categorize by root cause: mechanical, route structure, driver, external. Identify your top 3 breach categories.
3
Implement digital DVIR — daily vehicle condition documentation that feeds predictive maintenance and compliance records simultaneously.
Days 31–60: Control Layer Activation
4
Activate predictive maintenance alerts — flagged vehicles pulled for scheduled maintenance before failure. Target: zero mid-route mechanical failures within 60 days.
5
Integrate fleet health status into dispatch — vehicles with health flags receive route assignments consistent with their current condition.
6
Deploy real-time SLA risk scoring — configure alert thresholds so dispatchers receive 45–90 minute early warnings on at-risk deliveries before breach occurs.
Days 61–90: Optimization and Benchmarking
7
Run first SLA analytics report — identify which vehicles, routes, and windows generate disproportionate breach risk. Apply targeted adjustments to the top 3 problem areas.
8
Benchmark against the SLA maturity table — identify which level your network has reached and model the annual value of moving up one level.
SLA Management ROI — 100-Vehicle Fleet
Mechanical SLA breach elimination (predictive maintenance)$310,000/yr
SLA penalty reduction (real-time risk scoring)$240,000/yr
Contract retention improvement (scorecard performance)$380,000/yr
Emergency repair elimination$168,000/yr
Total Annual SLA Management Benefit$1,098,000
Ready to model this against your specific fleet and contract structure? Book a demo and we will run the numbers for your operation in under 30 minutes.
Key Takeaways: SLA Management for Scale-Stage Logistics
→
Fleet reliability is the foundation of SLA performance: 26% of SLA breaches trace to vehicle mechanical failure — and every single one is preventable with predictive maintenance. No route optimization or dispatch tool can compensate for vehicles failing mid-route without warning. Fleet health management must come first.
→
SLA misses compound in ways not visible in aggregate reporting: A 5% fleet-level miss rate may mask a 22% miss rate on specific routes or vehicles. Root cause analytics that break breach distribution down by dimension are the difference between general effort and targeted fixes that actually change the trend line.
→
Early warning time is the most valuable variable in SLA management: A dispatcher with 90 minutes of warning on an at-risk delivery can reroute, reassign, or communicate. A dispatcher who learns of a breach after it occurs can only report it. Every investment that increases early warning lead time directly increases the number of breaches that never get recorded.
→
SLA management costs grow faster than fleet size without systematic controls: Moving from 50 to 150 vehicles triples the fleet — but at reactive management levels, SLA penalty costs multiply 4–6x. Systematic SLA management is the only approach that scales linearly with volume growth.
Your SLA Performance Is Only as Good as Your Fleet's Mechanical Reliability
OxMaint gives logistics companies the fleet maintenance platform that eliminates mechanical failure from SLA risk — predictive maintenance alerts, real-time vehicle health status, digital compliance records, and the analytics that connect fleet condition to on-time delivery performance.
Predictive maintenance and vehicle health alerts
Real-time fleet health and uptime dashboard
Full maintenance history and SLA root cause data
Digital DVIR and audit-ready compliance records
Frequently Asked Questions
What is delivery SLA management and why does it matter at scale?
Delivery SLA management is the systematic process of ensuring delivery commitments are met consistently — tracking on-time performance, identifying breach causes, intervening before windows close, and continuously improving compliance rates. It matters most at scale because SLA failure costs compound with volume: a 5% miss rate on 200 daily deliveries generates 10 breach events per day, but the same rate on 1,200 deliveries generates 60 — and the enterprise contracts that come with high volume carry larger penalty clauses and more aggressive review thresholds. Systematic SLA management is the infrastructure that prevents growth from amplifying breach costs alongside revenue.
What causes most SLA breaches in delivery networks?
The four primary SLA breach cause categories are: vehicle mechanical failure (26% — the most preventable), route structure problems such as over-committed stop sequences and unrealistic travel time assumptions (approximately 31%), real-time disruptions including traffic and customer-side delays (approximately 28%), and driver-related factors (15%). Mechanical and route structure failures together represent 57% of total breaches — and both are entirely controllable through predictive maintenance programs and AI route optimization. Addressing these two causes first delivers the fastest measurable SLA improvement at the lowest implementation cost.
How does predictive maintenance improve SLA compliance?
Predictive maintenance improves SLA compliance by eliminating the single highest-impact uncontrolled failure event in delivery operations: the mid-route vehicle breakdown. When AI analysis of sensor data and maintenance history identifies degrading components 4–7 days before failure, the vehicle is scheduled for a planned maintenance window rather than failing mid-route. Each prevented breakdown eliminates 15–22 SLA breaches, $330–$726 in penalties, $800–$2,400 in emergency repair premium, and the compounding customer trust damage that follows. For a 50-vehicle fleet eliminating 8 unplanned breakdowns monthly, this represents $130,000–$348,000 in annual avoidable cost — before counting contract retention value of sustained SLA improvement.
What on-time delivery rate should logistics companies target?
The target on-time delivery rate for logistics companies competing for enterprise contracts is 97%+. Below 93% is a contract risk threshold — most enterprise agreements include automatic review clauses at sustained miss rates above 5–7%. Achievable performance by fleet maturity: reactive fleets 80–91%, digitized fleets 86–94%, connected fleets 91–97%, optimized fleets 95–99%. Moving from reactive to connected maturity — the highest-impact single step — requires three things: a CMMS generating real-time vehicle health data, predictive maintenance capability, and real-time SLA risk scoring with dispatcher alerts.
What ROI can logistics companies expect from SLA management investment?
A 100-vehicle logistics fleet investing in systematic SLA management can expect approximately $1,098,000 in annual benefit: mechanical SLA breach elimination ($310,000), SLA penalty reduction from real-time risk scoring ($240,000), contract retention improvement ($380,000), and emergency repair elimination ($168,000). The platform investment typically runs $28,000–$45,000 annually for a 100-vehicle fleet — a first-year ROI of 24–39x. The contract retention component is often the largest single line item, reflecting the revenue impact of maintaining carrier scorecard ratings that protect existing contracts and qualify for higher-value enterprise business.