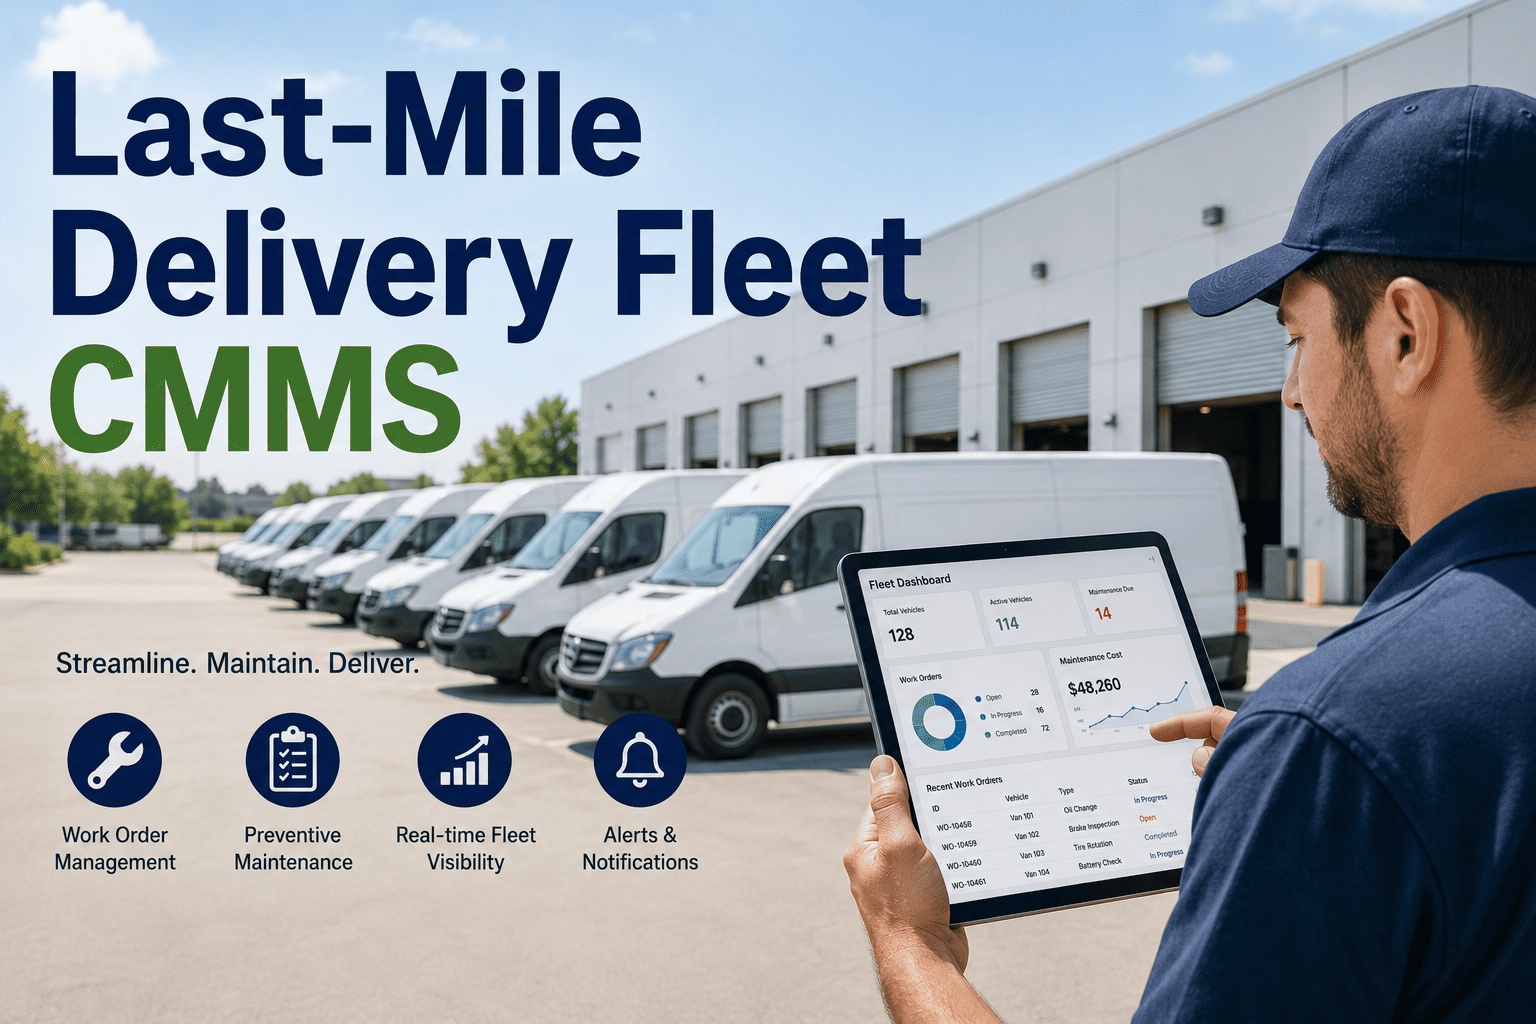
Fleet Maintenance Cost Analytics to Track Cost Per Mile and Maintenance ROI
By Alex Jordan on March 23, 2026
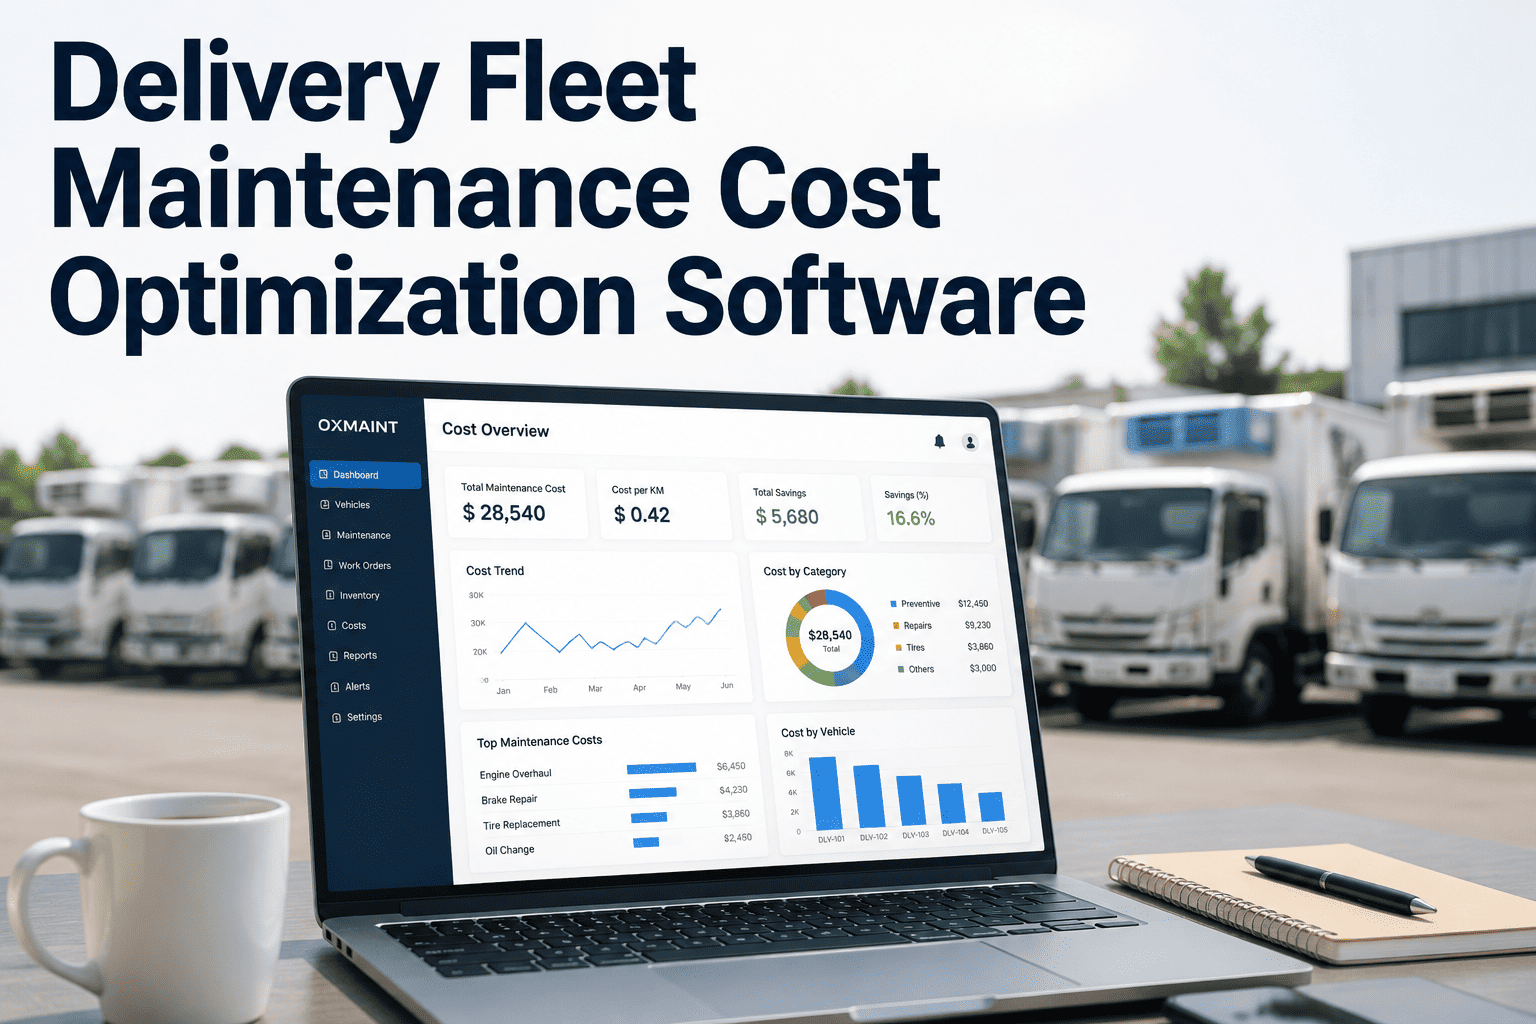
Most fleet managers know their total annual maintenance spend. Very few know their cost per mile, cost per vehicle, cost per component category, or how their maintenance spend compares to industry benchmarks for their fleet size and route type. That gap between knowing what you spent and understanding why you spent it is where the majority of fleet budget waste lives — in over-servicing low-cycle vehicles, emergency parts premiums on failures that were predictable, and reactive repair labour rates that run 40–60% higher than planned maintenance labour. Fleet maintenance cost analytics closes that gap by converting raw spend data into actionable intelligence: which vehicles are costing you the most per mile, which components drive the majority of unplanned spend, which routes produce the most maintenance events, and whether your current maintenance programme is delivering measurable ROI against the cost of running it. For fleet operations directors and maintenance managers across the USA, UK, Canada, Australia, UAE, and Germany, this is the financial visibility layer that transforms maintenance from a cost centre into a managed, optimised function.
OxMaint · Fleet Maintenance Cost Analytics · 2026
Stop Managing Maintenance Spend. Start Optimising It.
Cost per mile, cost per vehicle, parts analytics, labour efficiency, and maintenance ROI — tracked automatically across every vehicle, every depot, every day.
of fleet maintenance spend has no per-vehicle or per-component breakdown
65%
Overspend is Concentrated
of total overspend sits in just 20% of fleet vehicles — invisible without analytics
50%
Parts Cost Reduction
drop in emergency parts spend within 90 days of deploying cost analytics
80%
Decisions Made Blind
of maintenance budget decisions are made without real-time cost data per vehicle
What Fleet Maintenance Cost Analytics Actually Measures
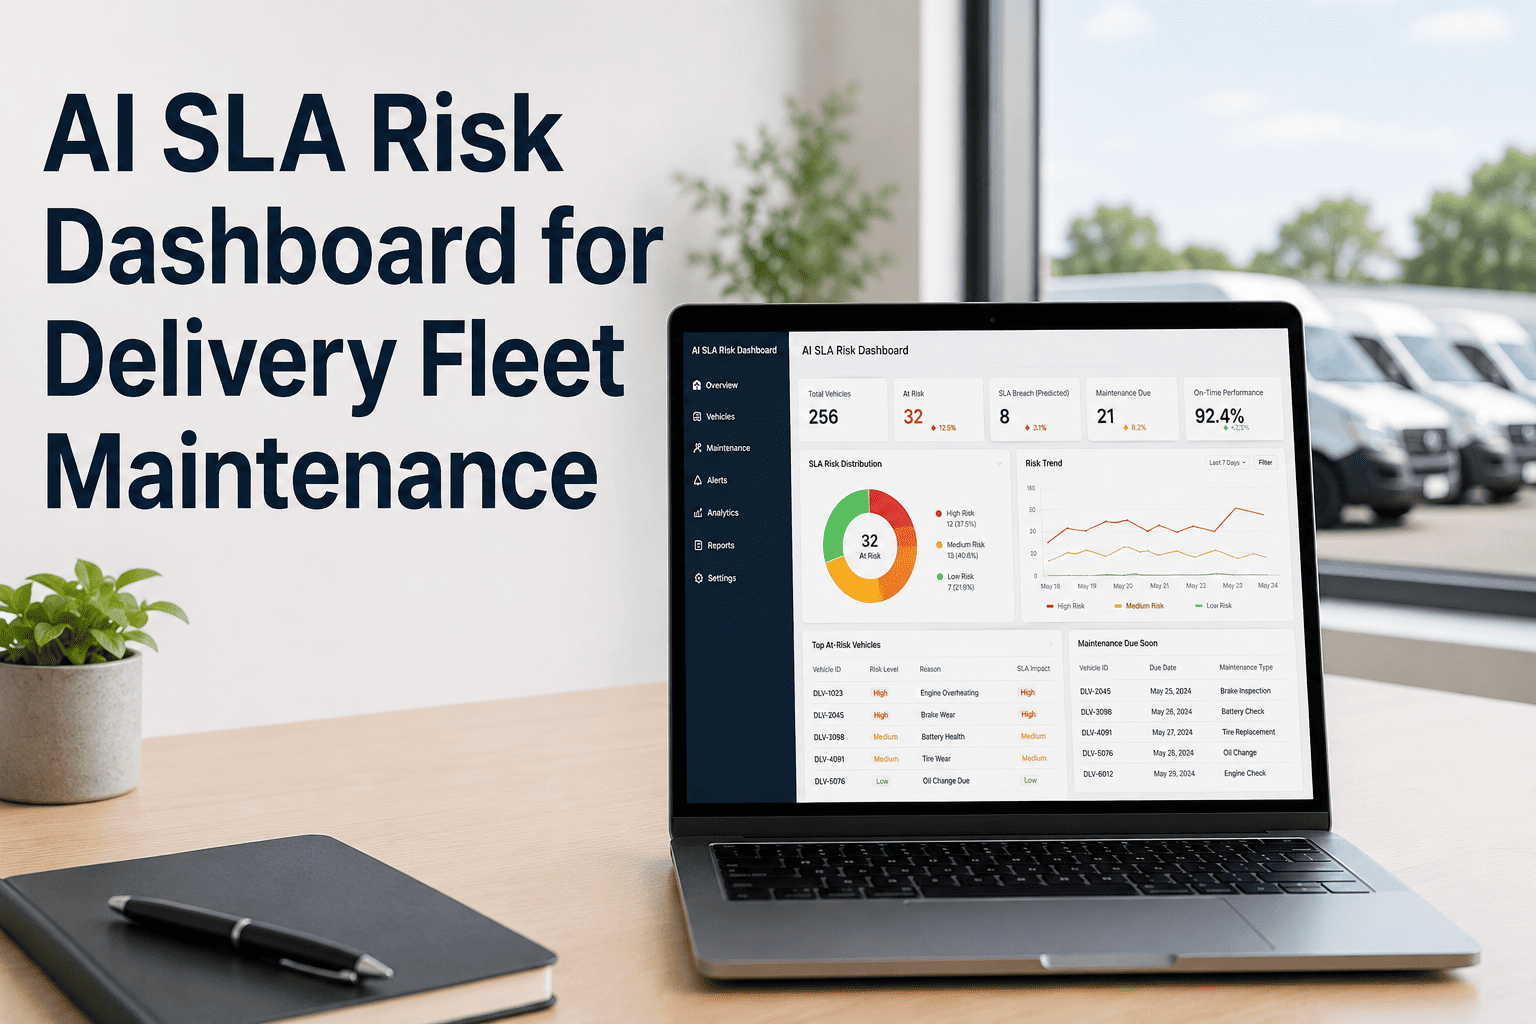
Fleet maintenance cost analytics is not a report you pull once a month — it is a live intelligence layer that tracks every maintenance dollar against the vehicle, component, route, and technician that generated it. The distinction matters because monthly reports show you what happened. Real-time analytics shows you what is happening and where the next cost spike is forming. OxMaint's cost analytics dashboard connects to OBD sensor data, work order completions, parts consumption logs, and labour time entries to build a continuous cost model per vehicle that updates as spend occurs. For fleet directors managing budgets across multiple depots, vehicles, and jurisdictions, OxMaint's cost analytics dashboard gives you the financial visibility layer that most fleet management systems do not provide.
WHAT THE COST ANALYTICS DASHBOARD TRACKS — 50-VEHICLE FLEET ANNUAL SPEND
Labour Cost
$148K
34%
Tracked per technician, per work order type
Parts & Materials
$124K
29%
Planned vs emergency split tracked
Breakdown Recovery
$86K
20%
Recoverable through predictive maintenance
Compliance & Inspection
$43K
10%
Over-Servicing Waste
$30K
7%
Breakdown recovery (20%) and over-servicing waste (7%) are directly reducible with predictive maintenance. Combined: $116K recoverable on a 50-vehicle fleet.
The 6 KPIs That Drive Smarter Maintenance Budget Decisions
Fleet maintenance cost analytics is only useful if it surfaces the right numbers at the right level of detail. Six KPIs consistently produce the most actionable cost decisions across delivery fleet operations. OxMaint tracks all six automatically — no manual data entry, no spreadsheet assembly — updating every KPI as work orders are completed, parts are consumed, and sensor data is processed. Book a demo to see your fleet's estimated KPI baseline calculated from your vehicle count and current maintenance frequency.
LIVE COST ANALYTICS KPI DASHBOARD — 50-VEHICLE FLEET
Cost Per Mile
$0.38
Industry avg$0.52
−27% vs benchmark
Monthly Cost Per Vehicle
$724
High-cost vehicles$1,840
3 vehicles above threshold
Planned vs Reactive Ratio
78:22
Target ratio80:20
Near target — improving
Maintenance ROI
6.2×
Platform cost$42K/yr
$261K value delivered
Parts Spend — Emergency %
18%
Target<10%
Above target — action needed
Mean Time Between Failures
42 days
Previous period28 days
+50% improvement
Know Your Cost Per Mile. Know Which Vehicle Is Bleeding Your Budget.
OxMaint tracks every maintenance dollar automatically — per vehicle, per component, per route.
The operational difference between managing maintenance with and without cost analytics is the difference between reacting to last month's invoice and preventing next month's overspend. Fleet maintenance managers who deploy OxMaint cost analytics consistently identify the same pattern within the first 30 days: a small subset of vehicles accounts for a disproportionate share of total spend, and that spend is concentrated in predictable failure modes that sensor data and AI prediction would have caught weeks earlier. Start your free OxMaint trial and see your fleet's cost concentration pattern within the first 14 days of deployment.
Decision Area
Without Analytics
With OxMaint Analytics
Budget allocation
Distributed equally across fleet — no cost intelligence
Directed to highest-cost vehicles and components first
Cost per mile visibility
Unknown — total spend only
Tracked per vehicle, per route, updated daily
Parts procurement
Reactive — emergency orders at 2.4× cost
Predictive — auto-PO before scheduled service
High-cost vehicle ID
Discovered only at year-end budget review
Flagged in real time — corrective action within days
Maintenance ROI
Unmeasured — maintenance seen as a fixed cost
Tracked monthly — ROI visible per programme change
Budget forecast accuracy
±30–40% variance — constant surprises
±8% variance — predictable, defendable budgets
Technologies That Feed the Cost Analytics Engine
Maintenance cost analytics is only as accurate as the data feeding it. OxMaint connects four technology sources — each contributing a different dimension of cost intelligence — to produce a cost model that reflects reality rather than estimates. The more data sources connected, the more granular and actionable the cost analytics becomes. OBD provides real-time vehicle usage data. SAP integration prevents cost data from being siloed in the maintenance system while asset records live in the ERP. AI digital twin enables cost scenario modelling before operational decisions are committed. AI camera vision adds inspection data that closes the gap between sensor-detected wear and visually observable deterioration.
Primary cost driver data — 70% of analytics inputs
SAP
Enterprise Cost Reconciliation
SAP bidirectional integration means every work order cost, parts consumption, and labour entry in OxMaint is written to SAP PM and MM simultaneously — eliminating the data discrepancy between maintenance records and enterprise financials that makes budget analysis unreliable. PLC integration with depot charging and production infrastructure feeds EV charging costs and shop-floor asset spend into the same cost model — giving manufacturing-connected delivery operations a unified view across vehicles and plant equipment. Critical for US, Canadian, Australian, German, and UAE operations where SAP and PLC-based automation are standard infrastructure.
Eliminates cost data lag between CMMS and ERP
Digital Twin
Cost Scenario Modelling
The AI digital twin allows fleet managers to simulate the cost impact of maintenance decisions before committing to them — testing whether changing a PM interval, adding a vehicle to a higher-intensity route, or deferring a repair affects projected annual spend. Cost modelling on virtual vehicles eliminates the trial-and-error risk of testing interval changes on live fleet assets.
Reduces cost of PM optimisation decisions by ~40%
AI Camera
Visual Cost Trigger Detection
AI camera systems at the depot gate detect visual wear indicators — tyre sidewall damage, brake disc condition, suspension deterioration — that OBD sensors cannot measure. Every camera-detected defect adds a cost trigger to the analytics model, ensuring that visually observable deterioration is costed and work-ordered before it progresses to a more expensive failure mode. Camera-triggered repairs cost on average 60% less than the failure-mode repair they prevent.
Camera-triggered repairs 60% cheaper than failure repairs
The ROI of Maintenance Cost Analytics
Maintenance cost analytics delivers ROI through three mechanisms: it identifies the vehicles and components generating disproportionate spend before they generate another overspend cycle; it shifts procurement from reactive emergency ordering to planned purchasing at standard rates; and it makes the maintenance programme's financial performance visible — enabling the fleet director to make evidence-based decisions about investment levels, vehicle replacement timing, and PM frequency adjustments. For a 50-vehicle fleet, the analytics capability itself typically costs less than one avoided breakdown event per month. Book a demo to see a personalised ROI estimate built from your fleet size and current maintenance frequency.
ANNUAL ROI BREAKDOWN — 50-VEHICLE FLEET WITH OXMAINT COST ANALYTICS
Prevented breakdown cost
60% reduction in unplanned events
$172,800
Emergency parts premium eliminated
Reactive to planned procurement
$43,200
Over-servicing waste removed
Dynamic PM replaces fixed intervals
$29,400
Labour efficiency gain
Planned vs reactive repair ratio
$16,200
OxMaint platform cost (50 vehicles)
$42,000/yr
Total annual value delivered
$261,600/yr
6.2× ROI · Payback in under 5 months
Frequently Asked Questions
Q1
How does OxMaint calculate cost per mile?
OxMaint aggregates all maintenance costs attributable to each vehicle — labour time, parts consumed, recovery events — and divides by odometer miles driven in the period. The calculation updates automatically as work orders close and route data is processed via OBD. No manual calculation or spreadsheet required.
Q2
Can OxMaint cost analytics integrate with SAP for enterprise financial reporting?
Yes — OxMaint integrates bidirectionally with SAP PM, MM, and CO modules. Every work order cost and parts consumption writes to SAP automatically. Finance teams see maintenance cost in the ERP in real time without double entry. Book a demo to confirm compatibility with your SAP version.
Q3
How quickly does cost analytics produce actionable insights after deployment?
Initial cost per vehicle and parts spend breakdowns are visible within 48 hours of deployment once OBD and work order data begins flowing. Budget alerts and high-cost vehicle flags typically surface within the first two weeks. Full predictive cost modelling accuracy builds over 60–90 days as the AI model accumulates your fleet's historical spend patterns.
Q4
Can cost analytics track budget performance across multiple depots?
Yes — OxMaint's cost analytics dashboard supports multi-depot views with cost breakdowns per depot, per route cluster, and per vehicle type. Fleet directors managing operations across USA, UK, Australia, Germany, Canada, and UAE can see consolidated global spend alongside granular per-location breakdowns in one dashboard.
Q5
Does OxMaint support budget alerts when spend exceeds thresholds?
Yes — configurable budget alerts trigger when any vehicle, depot, or component category exceeds the defined monthly or annual spend threshold. Alerts reach the fleet manager and finance team simultaneously, with a cost breakdown showing which work orders drove the overspend. No more end-of-month budget surprises.
Your Maintenance Budget Deserves Better Than a Spreadsheet.
Cost per mile. Cost per vehicle. ROI per programme. All tracked automatically — no manual assembly.