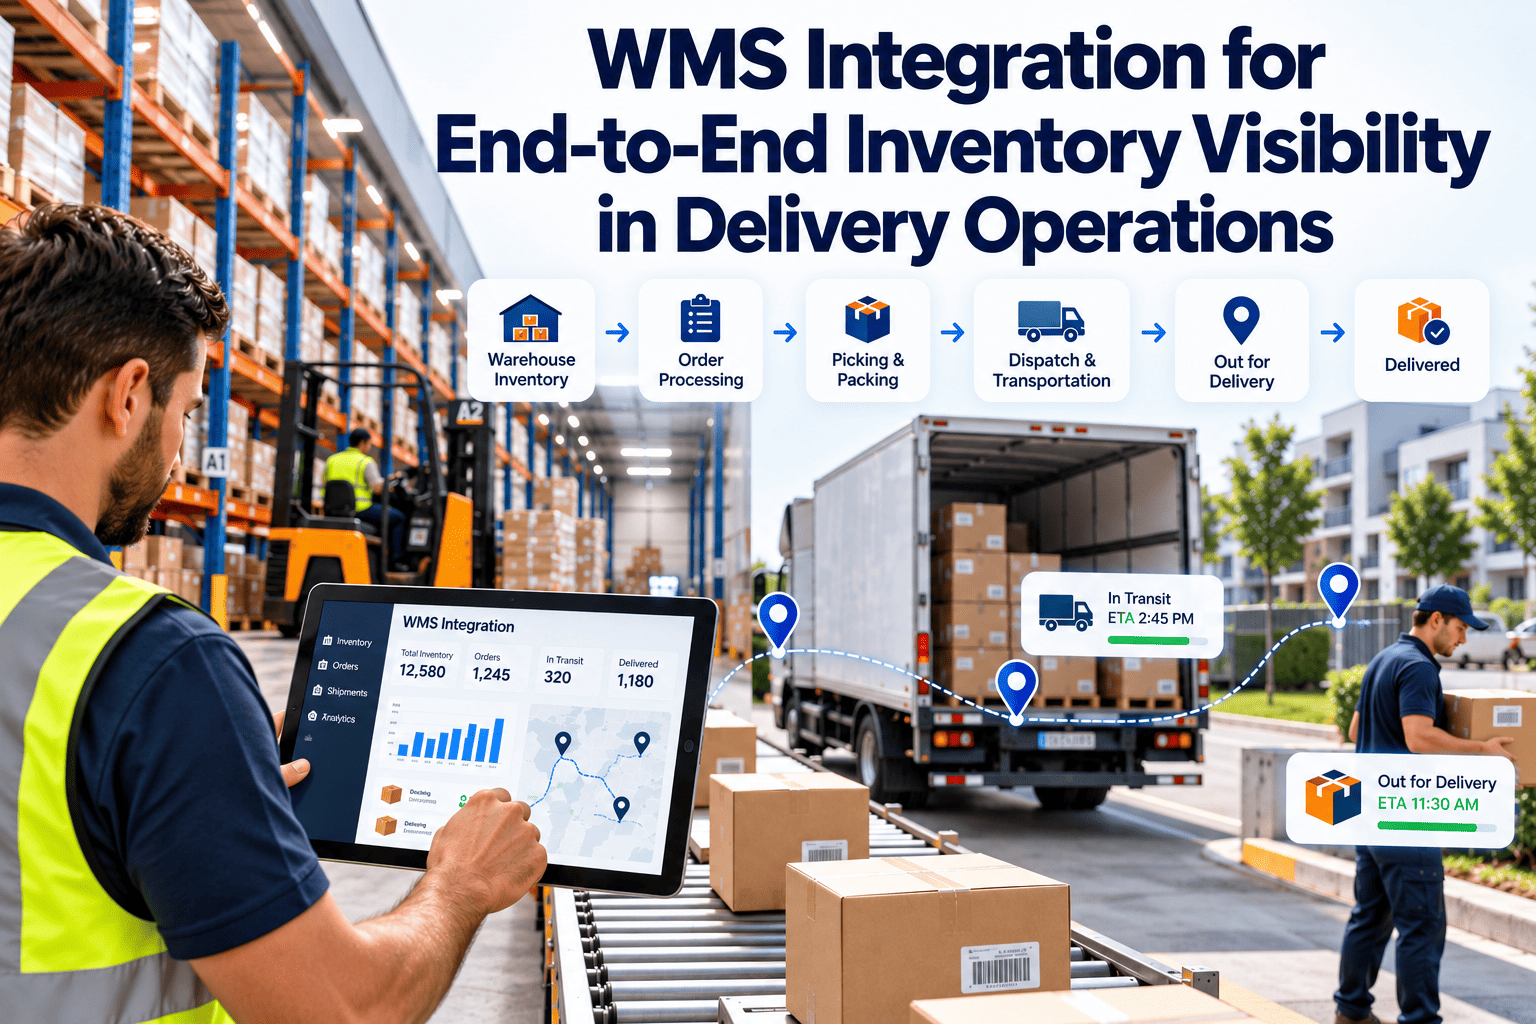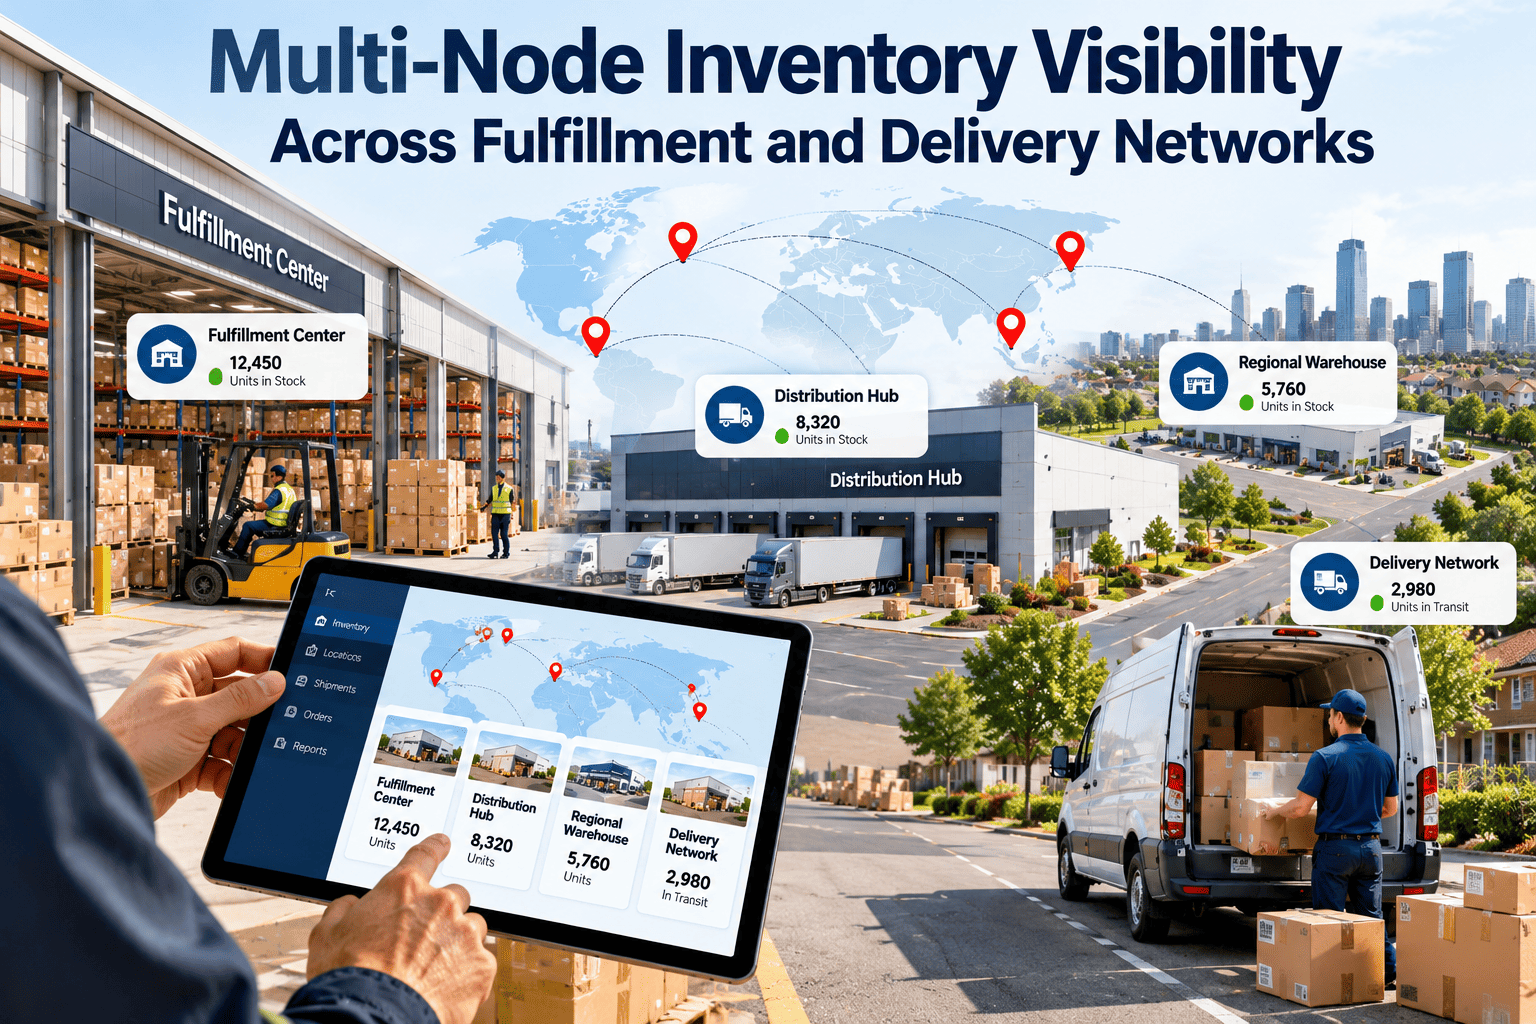
Most retailers can tell you how much inventory they own, but far fewer can say where every unit is, what is promised, and what can ship today across distribution centers, stores, and partner sites. That gap leads to oversell, split shipments, and stock sitting idle at the wrong node. This guide explains how multi-node inventory visibility works, which data and system layers it needs, and where equipment readiness enters the picture, with practical points for teams using maintenance management software alongside their supply chain systems.
Multi-Node Inventory Visibility Across Fulfillment and Delivery Networks
Visibility is not a dashboard. It is a shared, trusted answer to one question: what can we actually promise from which node, right now? Getting there takes clean data, fast updates, clear rules, and equipment that can actually move the stock.
What multi-node visibility actually means
A multi-node network spreads stock across central distribution centers, regional warehouses, stores, micro-fulfillment sites, and sometimes third-party logistics partners. Each node has its own system, its own count, and its own definition of available. Visibility connects those views into one consistent picture.
- Where each unit is physically located, down to the node and location type
- What state it is in, such as available, reserved, in transit, quarantined, or damaged
- What can be promised to a customer and from which node at the lowest total cost
- How recent the information is, so teams know how much to trust it
The layers between a shelf and a delivery promise
Each layer takes the one below it and adjusts it. Errors compound as they move upward, which is why fixing the bottom layers matters most.
Where inventory hides in a distributed network
Stock rarely disappears. It sits in states that the visibility layer cannot see or does not count. Mapping these hiding places shows where integration work pays back first.
Why visibility breaks down as networks grow
Adding nodes multiplies the number of systems, counting methods, and handoffs. Problems that were manageable with two warehouses become constant with ten sites, stores, and partners.
What poor visibility costs in everyday operations
The impact appears in several places at once, which makes the root cause easy to miss.
| Symptom | Typical cause | Business effect |
|---|---|---|
| Orders cancelled after acceptance | Stock counted as available that is not | Lost sales and weaker customer trust |
| Frequent split shipments | No single node seen as able to fill the order | Higher shipping and handling cost |
| Emergency transfers | Stock imbalance discovered late | Premium freight and disrupted plans |
| Excess stock at some sites | Safety stock set node by node | Carrying cost and obsolescence risk |
| Late deliveries from a healthy node | Capacity limits not visible to routing | Missed delivery windows |
A practical rollout path for a multi-node network
Start narrow, prove the model on a slice of the business, and expand only after the numbers hold up.
Returns, damage holds, and reverse flows
Returned and held units are inventory too, and in many networks they are the largest source of invisible stock. A clear reverse-flow process turns them back into sellable units faster.
- Receive returns into a defined status the moment they arrive, rather than leaving them in an unrecorded pile
- Set a time limit for inspection and disposition so held units do not become permanent
- Expose restockable returns to the network as soon as they pass inspection
- Track damage and quarantine reasons, because repeated causes point to handling or equipment issues
- Make sure inspection stations, scales, and label printers are covered by preventive maintenance so returns do not queue behind broken equipment
Governance that keeps the picture trustworthy
Technology gives visibility, but ownership keeps it accurate. Without governance, data quality slips back within months.
Three ways to pool inventory across nodes
Pooling lets one node cover for another without moving stock first. The right approach depends on how much your network can share systems and processes.
| Approach | How it works | Benefit | Watch for |
|---|---|---|---|
| Virtual pooling | Stock stays at each node but is shown as one pool and allocated by an order management layer | Fast to start, no physical movement | Depends on accurate, timely node data |
| Physical pooling | Stock is consolidated or cross-docked in shared facilities | Simplest rules and strongest risk pooling | Longer delivery distance to some customers |
| Distributed placement | Fast sellers are positioned in stores or micro-fulfillment sites near demand | Shorter last-mile time | Duplicated buffers if safety stock is set per node |
Centralizing safety stock without hurting service
When every node sets its own buffer, the network carries more total stock than it needs. Planning buffers at the network level lets variability offset itself across nodes.
Before: buffers per silo
- Each node protects itself against its own variability
- Central and regional buffers overlap for the same demand
- Slow sellers are over-stocked everywhere
- One node runs out while another holds excess
After: network-level buffers
- Buffers are set by SKU segment and node role
- A central reserve can be reallocated to a stressed node
- Fast sellers are forward-stocked, slow sellers stay central
- Transfers and allocations follow clear rules
The data foundation: fix this before the integration
Visibility software cannot repair inconsistent data. These items need agreement across nodes first.
Keep the equipment behind your inventory ready to run
See how asset records, preventive maintenance, and work orders can protect the conveyors, scanners, racks, and docks that every node depends on.
Update speed: real-time, near-real-time, or batch
Not every signal needs to arrive instantly, but the slowest signal sets the confidence in the promise.
How orders get routed once the picture is clear
A distributed order management layer applies rules to choose a node. Rules should be written down and reviewed, not buried in code.
The maintenance link most visibility projects overlook
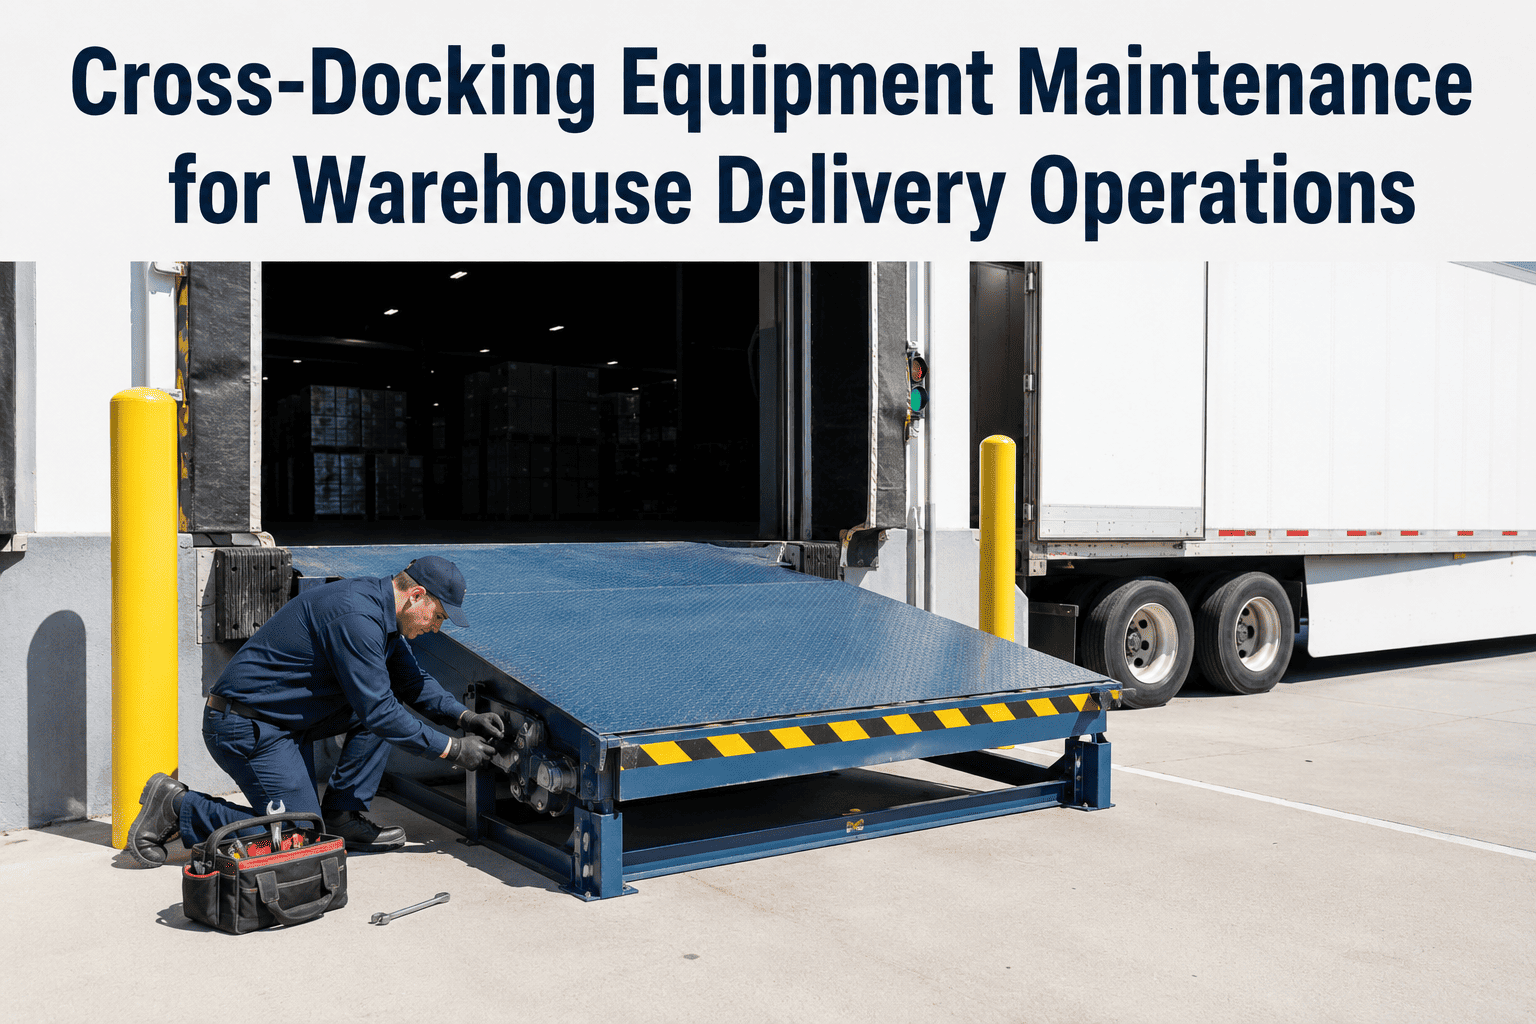
A node can show plenty of stock and still be unable to ship it. Conveyor stoppages, failed scanners, dock door problems, and refrigeration faults reduce real capacity without changing the inventory count. Routing logic that ignores them sends orders to sites that cannot deliver.
How Oxmaint supports network-wide operational readiness
Oxmaint is a maintenance platform, not an order management or inventory planning system. It supports the visibility effort by keeping node equipment and maintenance supplies under control.
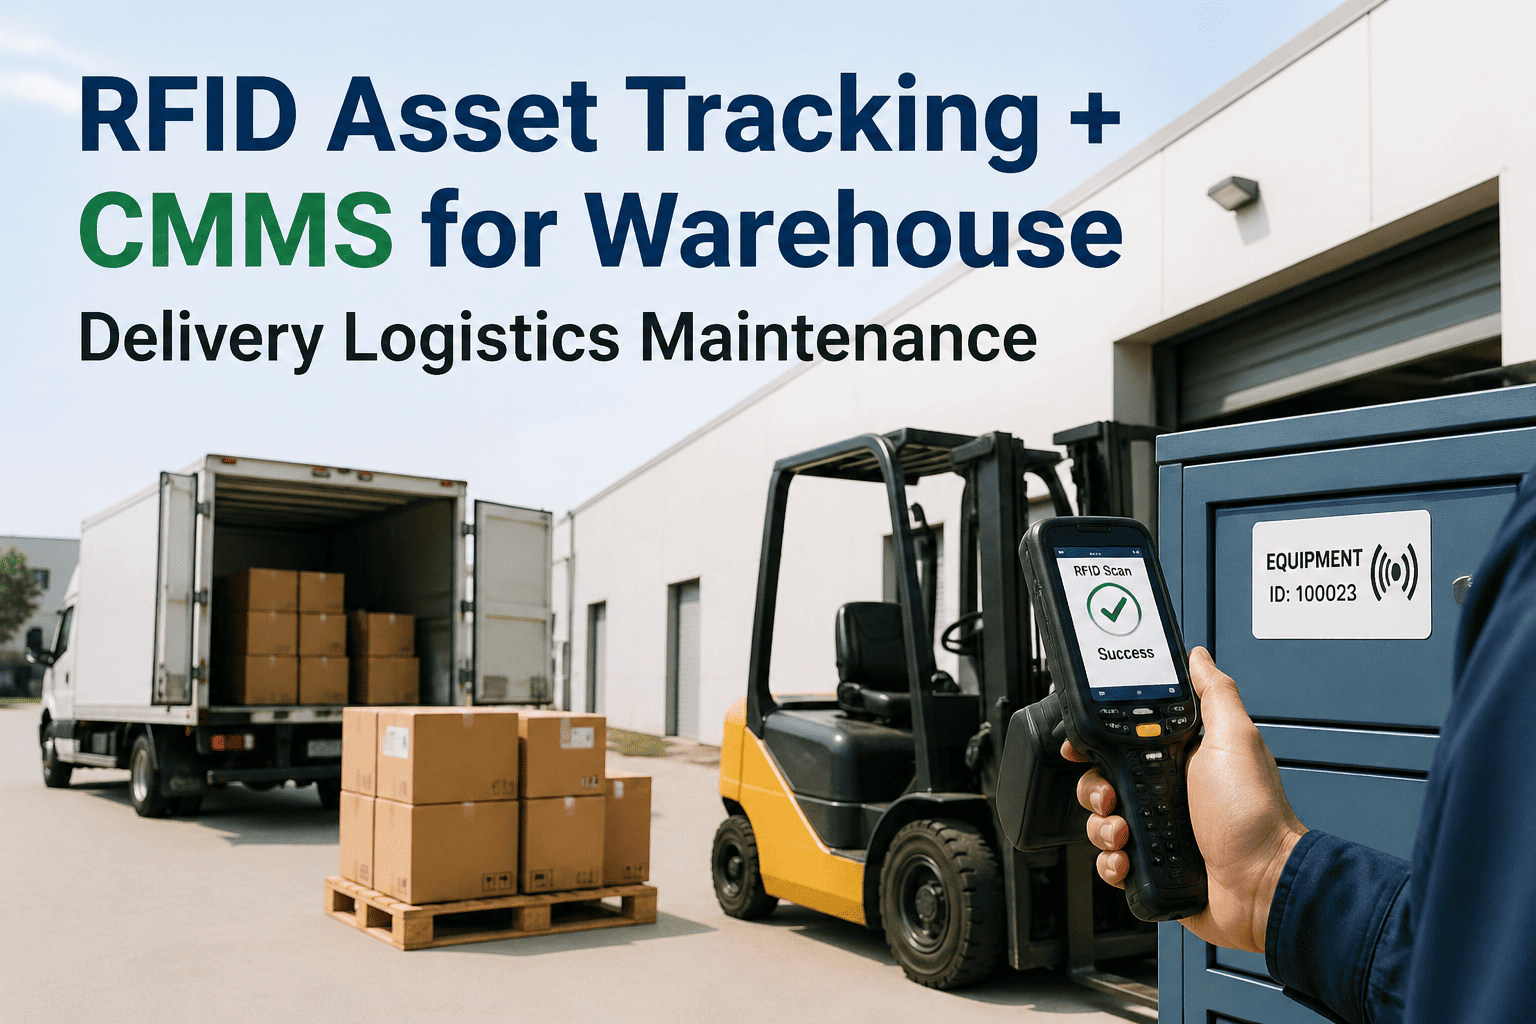
- Asset management for conveyors, sorters, racking, dock equipment, scanners, and refrigeration across every node
- Preventive maintenance schedules and inspections that reduce unplanned stoppages at each site
- Work orders with priority and status, so downed equipment is visible to operations quickly
- Recurring cycle-count and inspection tasks assigned and tracked with completion records
- Inventory management for spare parts and consumables, with stock levels by site
- Dashboards and reports that compare downtime, repeat failures, and PM compliance across nodes
Delivery decisions that improve with network visibility
Once availability and capacity are trusted, several delivery choices become easier and cheaper to make.
Without shared visibility
- Orders default to the nearest warehouse regardless of stock risk
- Customers receive several parcels for one order
- Planners learn about shortages from customer complaints
- Delivery promises are padded to cover uncertainty
With shared visibility
- Orders go to the node that can fill the full basket
- Delivery dates reflect real stock and capacity
- Low-stock alerts reach planners before a stockout
- Store and micro-fulfillment stock supports fast delivery
KPIs for a visible, trustworthy network
Measure at the node level, because network averages hide local problems.
| KPI | What it shows | Warning sign |
|---|---|---|
| Inventory accuracy by node | System count versus physical count | Accuracy varies widely between nodes |
| Node fill rate | Orders a node ships without escalation | Frequent reroutes after allocation |
| Oversell and cancel rate | Orders accepted that cannot be filled | Cancellations clustered on a few SKUs |
| Split shipment rate | Orders shipped from more than one node | Rising splits with no change in assortment |
| Data latency | Delay between stock event and system update | Peak-hour delays |
| Equipment downtime by node | Capacity lost to maintenance issues | Repeat downtime on the same assets |
- Review KPIs by node and by SKU segment, because a healthy network average can hide a failing site
- Pair inventory metrics with equipment downtime so planners see when capacity, not stock, is the constraint
- Set alert thresholds for count variance and data delay, and assign each alert to a named owner
- Revisit targets after seasonal peaks, assortment changes, or the addition of a new node
Frequently asked questions
What is the difference between inventory visibility and inventory accuracy?
Accuracy is whether a count is correct at a node. Visibility is whether everyone can see correct counts across all nodes in time to act.
Do we need physical pooling to share inventory?
No. Virtual pooling can present stock from several nodes as one pool, provided node data is accurate and updated quickly enough.
Is Oxmaint an inventory visibility or order management system?
No, it is maintenance software. It keeps node equipment, inspections, and spare parts organized, and you can start with your asset list at each site.
How does equipment downtime affect inventory visibility?
Down equipment reduces what a node can actually ship even when stock exists. Sharing downtime status with planners keeps promises realistic.
Where should a visibility project start?
Begin with SKU master data, statuses, and count accuracy at the busiest nodes. To discuss the maintenance side, book a demo.
Make every node ready to ship what the network promises
Give operations one view of equipment condition, planned maintenance, and spare parts across your fulfillment and delivery sites.