NVIDIA Omniverse for Warehouse Delivery Operations Simulation & Testing
By Johnson on April 18, 2026
Every warehouse layout change, every new conveyor configuration, every robot fleet addition carries a hidden cost: the weeks of disrupted operations, the throughput drop during commissioning, and the expensive surprises that only appear once the system is live. NVIDIA Omniverse is changing that equation by letting warehouse operators simulate thousands of virtual operating hours — with real physics, real sensor data, and real robot behavior — before a single shelf is moved or a single robot is unboxed. For maintenance and operations leaders, this means maintenance schedules can be stress-tested against future demand scenarios, robot-to-robot collision risks can be identified before deployment, and conveyor reconfigurations can be validated against peak-season traffic without pausing live operations. Digital twins in warehouse and distribution operations have delivered up to 15% reductions in total center costs, with predictive maintenance programs cutting machine downtime by 30 to 50% — numbers that only materialize when simulation data flows into a CMMS that can act on it. Book a demo to see how OxMaint connects Omniverse simulation outputs to live warehouse maintenance schedules.
Warehouse Simulation · Digital Twin · CMMS Integration
NVIDIA Omniverse for Warehouse Delivery Operations Simulation & Testing
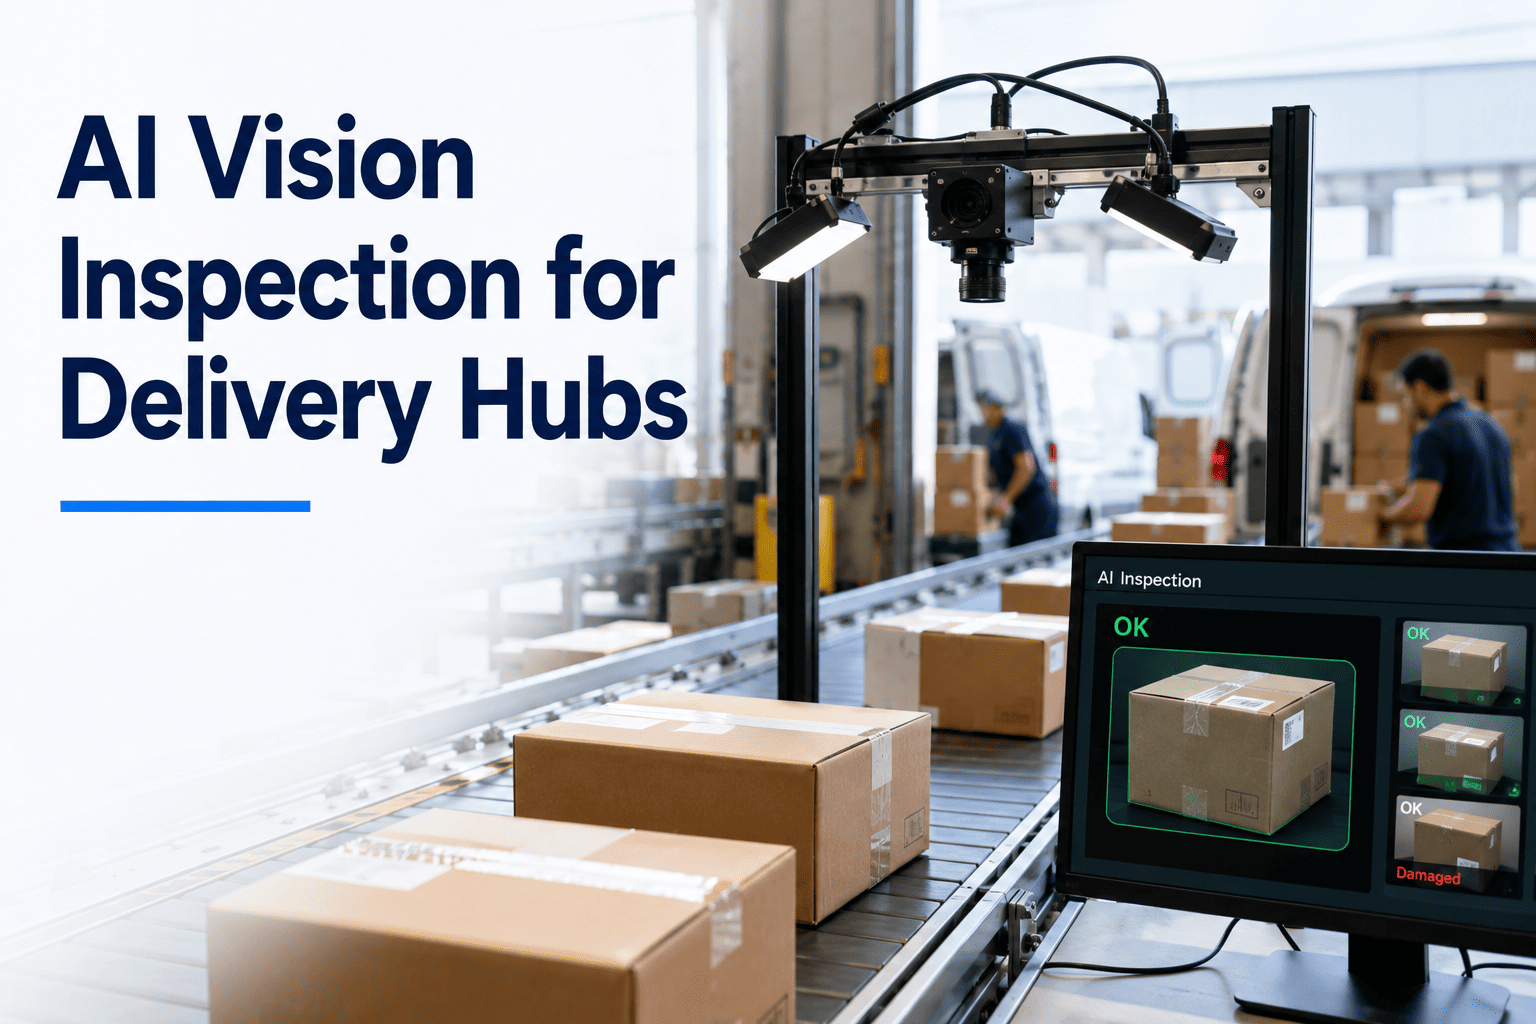
Simulate thousands of virtual operating hours. Validate layouts, robot fleets, and maintenance schedules before touching live operations. Feed the results into your CMMS and turn simulation into scheduled action.
Downtime reduction reported by digital twin adopters
15%
Total center cost cut from digital twin deployments
30%
Operational efficiency improvement from warehouse twins
8 mo
Typical payback period for AMR and automation projects
The Hidden Cost Problem
Why Testing Warehouse Changes in Production Is the Most Expensive Way to Learn
Every unvalidated layout change, robot deployment, or conveyor reconfiguration introduces risk that shows up in three ways: disrupted throughput during commissioning, unexpected maintenance failures that were not accounted for in the original schedule, and bottlenecks that only reveal themselves at peak volume. Warehouses under SLA pressure cannot afford to discover these problems in production. The numbers below show what simulation-first deployment is worth when you measure it against the status quo.
$50B
Annual unplanned downtime cost
US industry loses $50 billion every year to equipment failures. Warehouses running reactive maintenance absorb a disproportionate share through missed SLAs and rushed repair parts.
5-20%
Productive time lost to equipment failures
Average facilities lose between 5% and 20% of productive hours to unplanned equipment stoppages — most caused by scenarios that were predictable in simulation.
Weeks
Commissioning time for unvalidated changes
Physical-first deployment of new automation takes weeks of shakedown. Digital twin pre-validation reduces on-site commissioning dramatically because the software has already run thousands of scenarios.
$5M-50M
Capex at risk without pre-deployment simulation
Supply chain automation investments have shifted from sub-$1M projects to $5M–$50M deployments. A single unvalidated assumption in a capex decision of this size can cost more than the entire simulation program.
How the Simulation Loop Works
The Four-Stage Virtual Testing Cycle Before Anything Moves in the Physical Warehouse
Omniverse does not replace physical operations — it front-loads the discovery phase. Changes are proposed virtually, stress-tested against thousands of hours of synthetic runtime, validated against physics-accurate sensor data, and only then pushed to the live warehouse floor. Here is the sequence every successful warehouse digital twin follows.
01
Stage One
Build the USD Scene
CAD files from racking suppliers, robot manufacturers, and building architects merge into a single Universal Scene Description environment. The layout becomes a physics-accurate 3D replica where every beam, conveyor, and pick location matches reality.
02
Stage Two
Run Synthetic Operating Hours
Robot brains, workers, inventory flow, and conveyor logic run against realistic demand curves. Thousands of operating hours compress into minutes of compute — capturing edge cases that would take months to appear in the real warehouse.
03
Stage Three
Validate Against Sensor Data
Omniverse Sensor RTX APIs produce the same LiDAR, camera, and tactile output the real robots will see. If the robot brain performs well in simulation, it will perform well on day one — because it has effectively already run the route.
04
Stage Four
Deploy & Feed Back
The validated schedule, layout, or robot configuration goes live. Real-world performance data flows back into the twin, continuously improving the simulation. This closed loop is what separates a digital twin from a static 3D model.
What You Can Actually Simulate
Six Warehouse Decisions Omniverse Pre-Validates Before Deployment
The question for a maintenance or operations leader is not whether digital twin technology works — it is which decisions benefit most from pre-validation. The six categories below are where warehouses consistently see the highest return on simulation investment, based on published case studies from KION, Amazon, and PepsiCo Omniverse deployments.
01
Layout & Racking Optimization
Test multiple racking configurations, aisle widths, and dock assignments against actual SKU velocity and order profiles. Identify travel-path bottlenecks before moving a single pallet rack.
02
Robot Fleet Behavior
Simulate fleets of AMRs, robotic arms, and humanoid workers operating together. Catch collision risks, deadlocks, and coordination failures in the virtual environment — not on the warehouse floor during peak season.
03
Conveyor & Sortation Logic
Validate conveyor speeds, diverter timing, and sortation logic against worst-case parcel volumes. Identify heat-generating overload points and the specific assets that will carry the highest maintenance burden.
04
Maintenance Schedule Stress Testing
Run the planned preventive maintenance schedule against the simulated demand curve. Identify PM windows that conflict with peak traffic and rebalance intervals before a missed maintenance causes a live breakdown.
05
Synthetic Training Data Generation
Generate millions of photorealistic labeled images of boxes, pallets, and labels under varying lighting and occlusion. Train vision models in days instead of the months required to photograph real inventory.
06
What-If Demand Scenarios
Model Black Friday, holiday surge, or SKU mix shift scenarios against the current layout. Validate that staffing, equipment, and maintenance schedules will hold — before the demand actually arrives.
Turn Simulation Insights Into Scheduled Maintenance Work
Omniverse identifies which assets will need attention. OxMaint schedules the work, assigns the technician, tracks the completion, and feeds the real-world outcome back into your next simulation cycle. Book a demo to see the closed loop in action.
Warehouse Decision-Making Without and With Digital Twin Validation
The most honest way to evaluate Omniverse is to compare the same decision — a racking reconfiguration, a new AMR fleet, or a conveyor upgrade — across two decision pathways. The traditional approach is trial and error in production. The simulation-first approach compresses that learning into virtual hours before anything physical changes.
Traditional Deployment
Test in production · Learn from failure
Capex committed before validation — fixes come out of operating budget
Layout issues discovered during peak season disruption
Robot collisions and deadlocks found on the warehouse floor
Maintenance PM windows clash with high-volume days
Vision AI trained on limited real photos — fails on edge cases
Change rollback means pausing the live operation
Weeks of commissioning before steady-state throughput
Simulation-First Deployment
Validate virtually · Deploy with confidence
Capex approved after simulation validates the ROI model
Layout issues surface in synthetic peak-season runs
Robot coordination tested across thousands of virtual hours
PM schedules pre-aligned with simulated demand curves
Vision AI trained on millions of synthetic labeled images
Changes iterated in virtual space — zero live disruption
Robots arrive pre-trained and ready for day-one operation
The ROI Picture
Measurable Outcomes From Warehouse Digital Twin Programs
The numbers below come from published case studies and analyst reports covering digital twin deployments in warehouse and distribution operations. They establish a realistic range for what simulation-first warehouses should expect — and what finance teams should demand when approving the investment.
Unplanned Downtime Reduction
30-50%
Digital twin predictive maintenance programs (McKinsey)
Maintenance Cost Reduction
10-40%
Predictive maintenance from twin data (McKinsey)
Equipment Life Extension
20-25%
Condition-based maintenance via twin monitoring
Warehouse & Logistics Cost Reduction
20-30%
Space optimization and automation (Smart Spatial)
Development Time Reduction
up to 50%
Virtual validation replacing physical iteration
Preventive Maintenance Failure Reduction
30%
Digital twin-enabled condition-based programs
Conservative ROI scenarios model 5–10% cost reduction with payback in 12–18 months. Aggressive deployments targeting predictive maintenance and layout optimization typically see initial returns in 3–6 months and full ROI within 12–30 months.
The OxMaint Integration
Where Simulation Ends and Scheduled Work Begins
A digital twin that identifies a maintenance risk but cannot schedule a technician to address it is a half-finished system. The value compounds when the twin feeds a CMMS and the CMMS feeds back real-world outcomes. Here is how OxMaint closes that loop for warehouse operators running Omniverse-based simulation programs.
Step 1
Omniverse Identifies Risk Assets
The simulation flags conveyors, AMRs, or sortation components that will experience accelerated wear under projected demand curves or show failure signatures in the synthetic runtime.
Step 2
OxMaint Generates Work Orders
Risk flags convert automatically into structured preventive maintenance work orders with asset ID, recommended task, parts list, and scheduling window that avoids simulated peak volumes.
Step 3
Technicians Execute on Mobile
Technicians complete the work on mobile, capturing actual condition, parts replaced, time taken, and any findings the simulation did not predict. Completion data becomes asset history.
Step 4
Outcome Feeds Back to Twin
Completion records, condition readings, and findings flow back to Omniverse to calibrate the next simulation cycle. The twin learns from real outcomes and the CMMS gets smarter schedules.
Deployment Reality Check
Omniverse Warehouse Simulation — Investment & Timeline by Scope
Warehouse digital twin programs scale from single-asset pilots to full facility twins. The table below maps typical scope, investment range, and time-to-first-value so operations leaders can size the pilot correctly before committing to enterprise rollout.
Program Scope
Typical Investment
Time To First Value
Primary Use Cases
Expected Outcome
Single Asset Pilot
$75K – $250K
8 – 18 months
Predictive maintenance on one critical conveyor or AMR fleet segment
Distribution network optimization, fleet coordination across sites
Network-wide cost-to-serve reduction
Operator Perspective
What Warehouse Leaders Say About Simulation-First Deployment
We used to discover AMR deadlocks two weeks after go-live, when the fleet size crossed a threshold our planners never modeled. With Omniverse simulation feeding OxMaint work orders, we caught those coordination failures in virtual space and tuned the pathing before commissioning. The first real fleet deployment was steady-state from day one.
SM
Sanjay M.
Head of Warehouse Operations, E-commerce Fulfillment Network, India
The maintenance schedule stress testing was the unexpected win. We had PM windows scheduled on what we thought were low-volume Tuesdays — the simulation showed those Tuesdays were actually peaking because of a new SKU cluster. Moved the windows, avoided three likely breakdowns in the first quarter, and the CMMS tracked every one of them.
EL
Elena L.
Maintenance Reliability Manager, Regional Distribution Center, Europe
The ROI calculation was simple once we had the numbers. One avoided conveyor jackpot during Q4 pays for the simulation investment several times over. What OxMaint added was the accountability — every risk the twin flagged turned into a work order that got tracked to completion. No more flagged risks disappearing into someone's inbox.
MO
Marcus O.
Director of Operations, Parcel & Delivery Hub, North America
Frequently Asked Questions
NVIDIA Omniverse for Warehouse Simulation — What Operators Ask Most
Do we need to replace existing warehouse equipment to start with Omniverse simulation?
How long before a warehouse sees measurable ROI from simulation programs?
Single-asset pilots typically show ROI in 8–18 months. Predictive maintenance and downtime reduction use cases deliver the fastest returns, often within 3–6 months. Full facility twins take 18–30 months to realize full return. Start a free trial to begin tracking ROI from day one.
How does Omniverse simulation connect to CMMS-based maintenance scheduling?
Risk signals from the simulation — accelerated wear predictions, failure signatures, schedule conflicts — flow into OxMaint as structured preventive work orders with asset ID, recommended task, and scheduling windows. The CMMS executes the work and feeds completion data back to calibrate the next simulation cycle. Book a demo to see the closed-loop integration.
What should our first simulation pilot focus on to build the business case?
Prioritize high-downtime-cost assets or a single high-risk layout change. A conveyor sortation zone or an AMR fleet pilot typically produces measurable savings within the first two quarters — enough evidence to fund broader rollout. Start a free trial to build the asset criticality list.
Can we simulate peak-season scenarios before the actual peak arrives?
Yes — this is one of the highest-value use cases. Modeling Black Friday, holiday surge, or SKU mix shift scenarios against current layout and staffing exposes bottlenecks weeks or months before demand actually arrives, giving time to rebalance schedules and parts inventory. Book a demo to plan your peak-season simulation.
Warehouse Simulation · OxMaint CMMS · Digital Twin Integration
Stop Testing in Production. Simulate First, Schedule the Work, Measure the Outcome.
OxMaint is the CMMS layer that turns Omniverse simulation outputs into assigned, tracked, and completed maintenance work — and feeds the real-world outcomes back to make the next simulation cycle smarter. Book a demo to see the complete closed loop in action, or start a free trial to connect your first asset today.