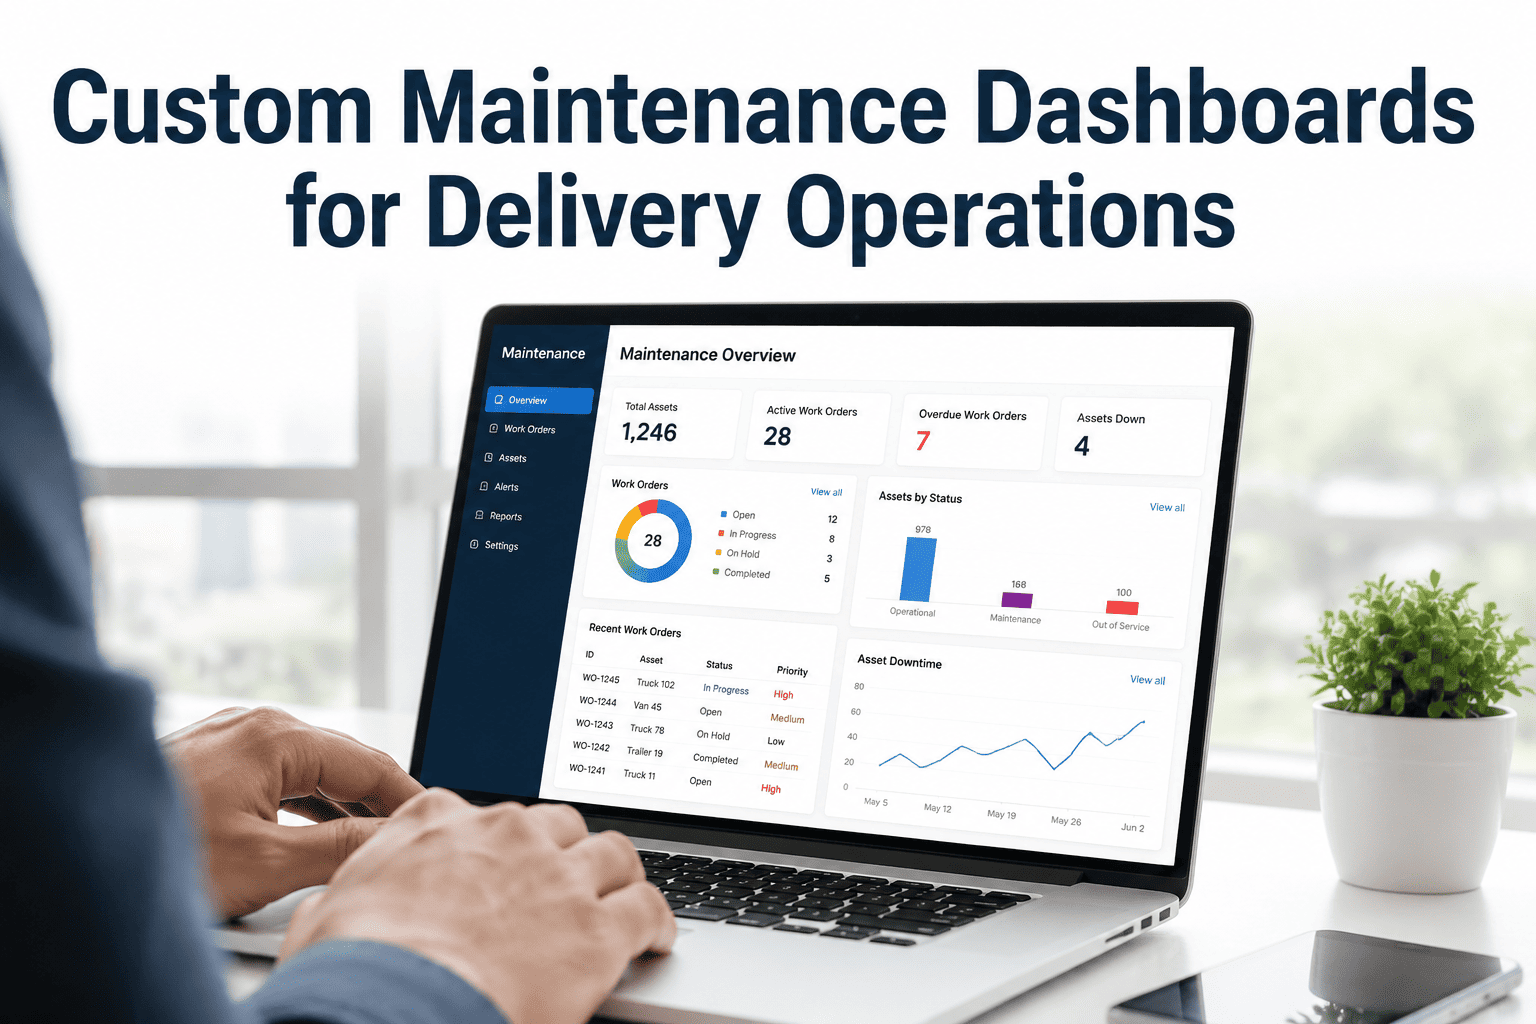
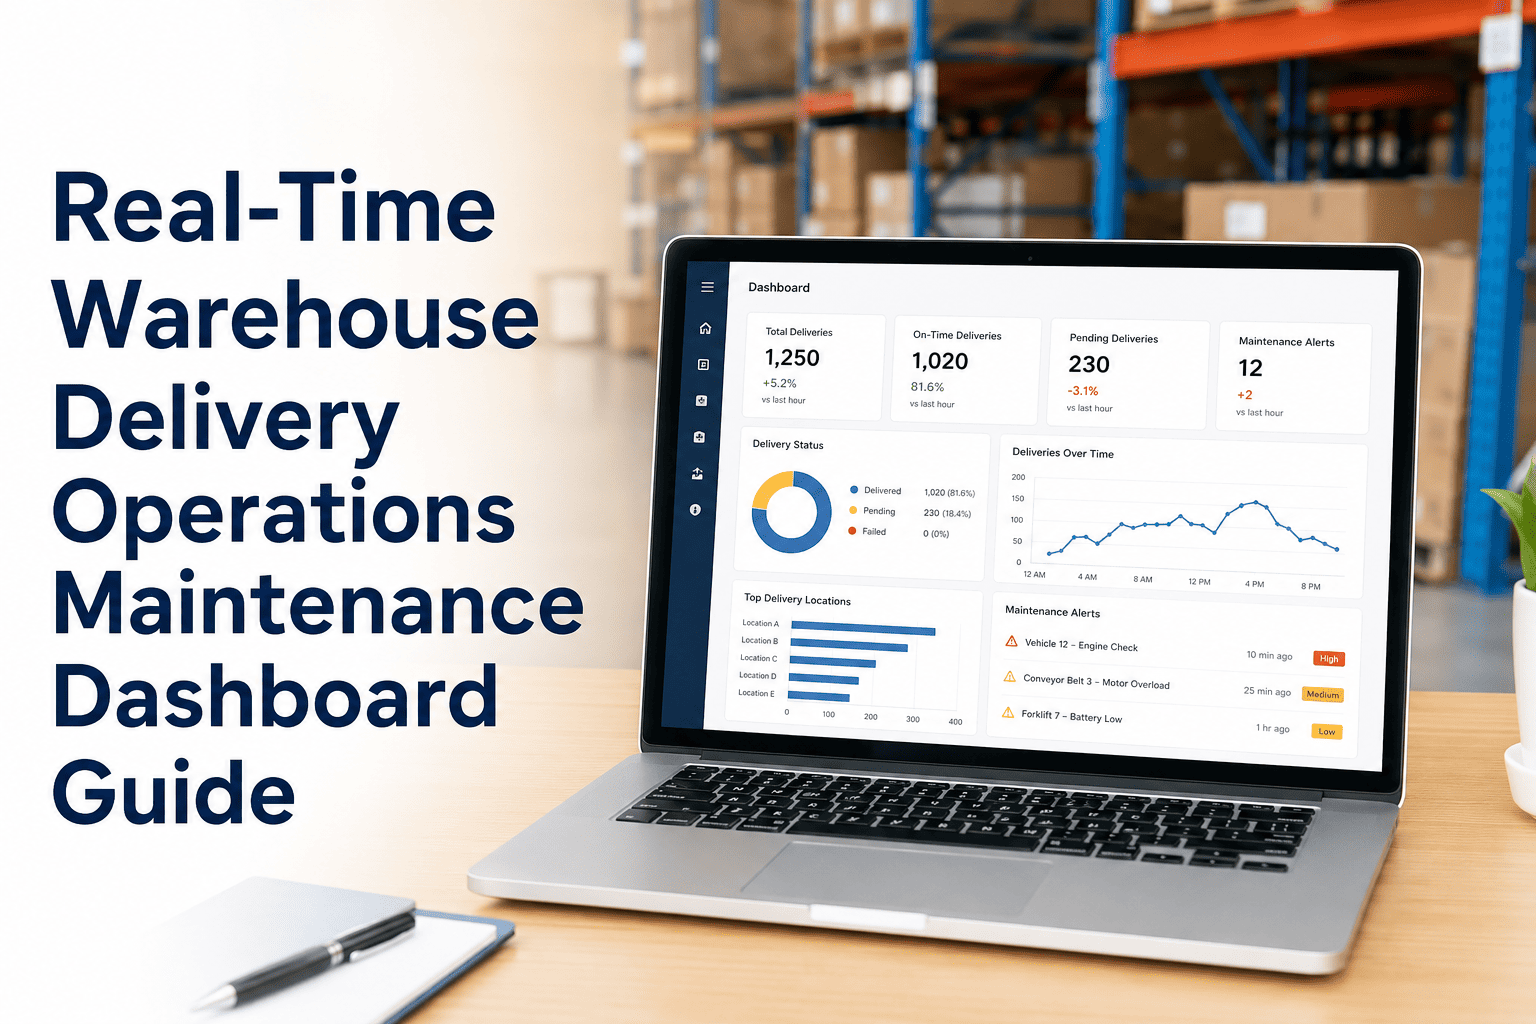
Logistics operations run on decisions — and decisions are only as good as the data behind them. When a fleet manager is working off a report generated 24 hours ago, they are not managing their fleet. They are auditing its past. In 2026, the most competitive delivery networks have moved to real-time fleet maintenance dashboards that surface vehicle health, work order status, technician productivity, and depot-level uptime in a single live view — updated continuously, accessible from any device, and connected directly to AI predictive maintenance data. The gap between fleets using live dashboards and those still relying on spreadsheets and end-of-day reports is widening fast. This page shows exactly what a best-in-class real-time fleet dashboard looks like — and what visibility your operation should have, right now, to run at peak performance.
Product Feature · Fleet Intelligence Dashboard
Real-Time Fleet Maintenance Dashboards for Logistics Operations
One live view across every vehicle, every depot, and every work order — AI-powered fleet maintenance visibility that turns raw telematics data into decisions your team can act on before problems become downtime.
Why Real-Time Visibility Is Now a Competitive Requirement
Avg. Data Lag (No Dashboard)
18–24 hrs
Decisions Made on Stale Data
63%
Faster Fault Response (Live Dashboard)
3.4x
Downtime Reduction (AI + Dashboard)
50%
Fleets with Real-Time Analytics
31%
What a Real-Time Fleet Dashboard Actually Shows
A true real-time fleet maintenance dashboard is not a reporting tool — it is an operational control layer. Every data point is live, every alert is actionable, and every metric is tied to a decision that affects fleet availability, cost, or delivery performance.
Oxmaint Fleet Operations Dashboard — Live View
What your operations team sees, updated in real time, from any device
Fleet Availability
98.4%
Live — updated every 5 min
Active Work Orders
14
6 planned · 8 in progress
Critical Alerts
3
Require action today
Vehicles Grounded
2
Repair in progress
Vehicle Health Status — All Depots
Live AI Fault Alerts — Priority Queue
Critical
VH-2241
Cooling system — overheating pattern detected · Action: Ground before next dispatch
8 min ago
High
VH-1804
Brake pressure degradation detected · Action: Schedule within 3 days
2 hrs ago
Monitor
VH-3317
Transmission fluid temp trending elevated · Action: Flag for next PM
5 hrs ago
The 6 Dashboard Views That Drive Fleet Performance
A best-in-class fleet maintenance dashboard is not one screen — it is six interconnected views, each designed for a different role and a different decision type. Together they give every stakeholder — from technician to CFO — the specific data they need, live.
01
Fleet Health Overview
For: Fleet Manager, Dispatch
Live vehicle health status across the entire fleet — Route-Ready, Monitor, and Grounded counts per depot, with drill-down to individual vehicle fault details. Pre-dispatch screening built directly into the dispatch workflow.
Fleet availability %
Grounded vehicle list
Health score per vehicle
02
AI Fault Alert Queue
For: Fleet Manager, Lead Technician
All active AI-generated fault alerts prioritized by severity — Critical, High, and Monitor. Each alert shows the vehicle, fault type, confidence score, and recommended action. Work orders generated directly from the alert with one click.
Alert severity queue
Fault type + confidence
1-click work order
03
Work Order Status Board
For: Workshop Supervisor, Fleet Manager
Live status of every open work order — Created, Parts Pending, In Progress, and Completed. Technician assignment, estimated completion time, and parts availability visible per job. Identifies bottlenecks in real time before they extend vehicle downtime.
Work order pipeline
Parts status per job
Completion ETA
04
PM Schedule and Compliance
For: Fleet Manager, Operations Director
Upcoming PM schedule for the next 30 and 90 days — per vehicle, per depot, and fleet-wide. Overdue PMs flagged automatically. Compliance rate tracked against target. Parts demand forecast generated from upcoming schedule for procurement planning.
30/90-day PM schedule
Compliance rate
Overdue PM alerts
05
Parts Inventory Dashboard
For: Procurement, Workshop Supervisor
Live stock levels per part number, per depot — with parts reserved for open work orders shown separately from available stock. Reorder alerts fire automatically when AI-calculated thresholds are reached. Cross-depot transfer opportunities flagged before external purchase orders are placed.
Stock per depot
Reserved vs available
Reorder alerts
06
Cost and CapEx Analytics
For: Operations Director, CFO
Maintenance cost per vehicle, per depot, and fleet-wide — trended over time and benchmarked against fleet averages. Vehicles with above-average cost per repair flagged for lifecycle review. Rolling 5–10 year CapEx forecast generated from vehicle age, failure rate, and parts cost trends.
Cost per vehicle
Fleet cost trends
CapEx forecast
Running your fleet on yesterday's data is the same as flying blind.
31% of fleets have real-time analytics. The other 69% are making dispatch, maintenance, and budget decisions on stale reports.
Start Free Trial →
Dashboard Access by Role — Who Sees What
Real-time data is only useful when the right person sees the right view. Oxmaint's dashboard architecture delivers role-specific visibility — so technicians are not overwhelmed with CapEx data, and CFOs are not hunting through work order queues for the numbers they need.
Role-Based Dashboard Architecture
Each stakeholder gets live data matched to their decisions — not everything for everyone
Technician
Mobile-first access
Assigned work orders — live status
Parts reserved for each job
Vehicle history and fault details
Job completion and sign-off
Workshop Supervisor
Depot-level view
All open work orders by status
Technician workload and utilization
Parts availability per active job
Bottleneck alerts — jobs at risk
Fleet Manager
Fleet-wide view
Live vehicle health — all depots
AI fault alert queue — priority order
PM compliance rate and overdue alerts
Pre-dispatch health scoring
Operations Director / CFO
Portfolio analytics view
Fleet availability rate — live and trended
Maintenance cost per vehicle / depot
CapEx forecast — rolling 5–10 years
Depot benchmark comparisons
No Dashboard vs. Real-Time Dashboard — What Changes Operationally
| Decision / Situation |
Without Real-Time Dashboard |
With Oxmaint Live Dashboard |
| Morning dispatch |
Based on PM date + driver walk-around |
Based on live health score per vehicle |
| Fault detection |
Driver reports it — hours or days late |
AI alerts 15–60 days before failure |
| Work order status |
Phone call or walking to the workshop |
Live pipeline — visible from any device |
| Parts availability check |
Manual stock count or spreadsheet |
Live per-depot, per-part-number stock |
| Uptime reporting |
End-of-day or end-of-week report |
Live availability % updated every 5 min |
| Budget visibility |
Month-end finance report — 4 weeks lag |
Rolling cost per vehicle, live |
| High-cost vehicle identification |
Annual review — 12-month lag |
Flagged automatically as costs escalate |
Key Dashboard Metrics Every Logistics Fleet Should Track Live
Operational Metrics
Fleet Availability Rate
% of vehicles route-ready at shift start — the primary uptime KPI for delivery fleet performance.
Mean Time Between Failures (MTBF)
Average operating time between unplanned breakdowns per vehicle class — tracked live and trended over time.
Mean Time to Repair (MTTR)
Average time from fault detection to vehicle return to service — a direct measure of workshop efficiency and parts readiness.
PM Compliance Rate
% of scheduled PMs completed on time — the leading indicator for future breakdown rate and unplanned downtime.
Financial Metrics
Maintenance Cost per Vehicle
Total maintenance spend divided by active vehicles — benchmarked per depot, per vehicle class, and fleet-wide against rolling averages.
Planned vs. Emergency Repair Ratio
The most important cost efficiency metric — a high emergency ratio signals AI is not catching faults early enough, or PM compliance is low.
Parts Inventory Turnover
How frequently parts stock is consumed and replenished — high dead stock ratio signals over-procurement and capital lock-up in slow-moving inventory.
Downtime Cost per Event
Direct and indirect cost per vehicle downtime event — tracks the financial impact of each missed delivery and enables ROI calculation for AI maintenance investment.
See your entire fleet health in one live view.
Oxmaint deploys across your fleet in 14 days — no hardware, no complex integration, and no IT project required.
Book a Demo →
Oxmaint Fleet Dashboard — Platform Overview
Live Intelligence
Vehicle Health Monitoring — Continuous
Telematics and OBD-II data analyzed continuously per vehicle. Individual health baselines built by AI — anomalies flagged the moment they diverge from expected patterns, not when they become fault codes. Every vehicle's health score visible on the dashboard in real time.
Live ScoreTelematics + OBD-IIAll Depots
Predictive Analytics
AI Fault Detection with Lead Time
ML models surface fault signatures 15–60 days before failure across 8 categories — severity-graded and visible in the fault alert queue dashboard with recommended action, estimated failure window, and auto-generated work order ready to assign.
15–60 Day Lead8 Fault TypesSeverity Grading
Workflow Visibility
Live Work Order Pipeline
Every work order — planned, in progress, and completed — tracked live with technician assignment, parts status, and estimated completion. Workshop supervisors spot bottlenecks before vehicles miss their next route. Mobile access for technicians from depot floor.
Live PipelineParts StatusMobile Access
Financial Intelligence
Cost Analytics and CapEx Forecasting
Maintenance cost per vehicle and per depot tracked live — trended, benchmarked, and connected to asset lifecycle data. High-cost vehicles flagged for review before annual capital planning cycles. Rolling CapEx forecasts give CFOs data-driven fleet renewal timelines.
Cost Per VehicleDepot BenchmarksCapEx Forecast
3.4x
Faster Fault Response Time
Live fault alert dashboards reduce average time from fault detection to work order creation from hours to minutes.
50%
Reduction in Unplanned Downtime
Real-time health monitoring combined with pre-dispatch grounding eliminates the majority of avoidable fleet downtime events.
14 days
Time to Full Dashboard Deployment
Oxmaint integrates with existing telematics infrastructure and deploys live dashboards across fleets of any size within two weeks.
See Your Fleet in Real Time — Starting Today
Oxmaint gives logistics operations live vehicle health scoring, AI fault alert queues, work order pipeline tracking, parts inventory dashboards, and cost analytics — across every depot, in one platform, updated continuously. Start free or book a walkthrough to see the full dashboard in action for your fleet.
Frequently Asked Questions
What data sources does a real-time fleet maintenance dashboard connect to?
A best-in-class fleet maintenance dashboard connects telematics data streams, OBD-II vehicle diagnostic data, CMMS work order records, parts inventory systems, and PM schedule data — synthesizing all sources into a single live view. Oxmaint integrates with leading telematics platforms including Samsara, Geotab, Verizon Connect, and Omnitracs. No new hardware is required for fleets already equipped with telematics units. The platform begins surfacing live data within hours of integration.
How is a real-time fleet dashboard different from a standard CMMS reporting module?
Standard CMMS reporting modules generate static snapshots — typically daily or weekly summaries of past activity. A real-time fleet maintenance dashboard is a live operational control layer — updated continuously from vehicle health data, fault detection alerts, work order status changes, and parts inventory movements. The critical difference is timing: a report tells you what happened, a live dashboard tells you what is happening now and what requires action before it becomes downtime. In fleet operations, that timing gap is the difference between a planned depot repair and a roadside breakdown.
Can different team members see different dashboard views based on their role?
Yes. Oxmaint delivers role-based dashboard access so each stakeholder sees the view most relevant to their decisions. Technicians access a mobile-first work order view. Workshop supervisors see the full depot work order pipeline and parts status. Fleet managers see fleet-wide health scores and the AI fault alert queue. Operations directors and CFOs access cost analytics, uptime trends, and CapEx forecasting dashboards. Role-based access also controls data permissions — ensuring sensitive cost and procurement data is visible only to appropriate stakeholders.
What are the most important metrics to track on a fleet maintenance dashboard?
The highest-value metrics to monitor live are: fleet availability rate (% of vehicles route-ready at dispatch), planned vs. emergency repair ratio (cost efficiency indicator), mean time to repair (workshop throughput), PM compliance rate (leading indicator for future breakdowns), and maintenance cost per vehicle (financial efficiency benchmark). The planned vs. emergency ratio is particularly critical — a fleet with more than 20% emergency repairs is not capturing the cost benefits of predictive maintenance, regardless of what the uptime number shows.