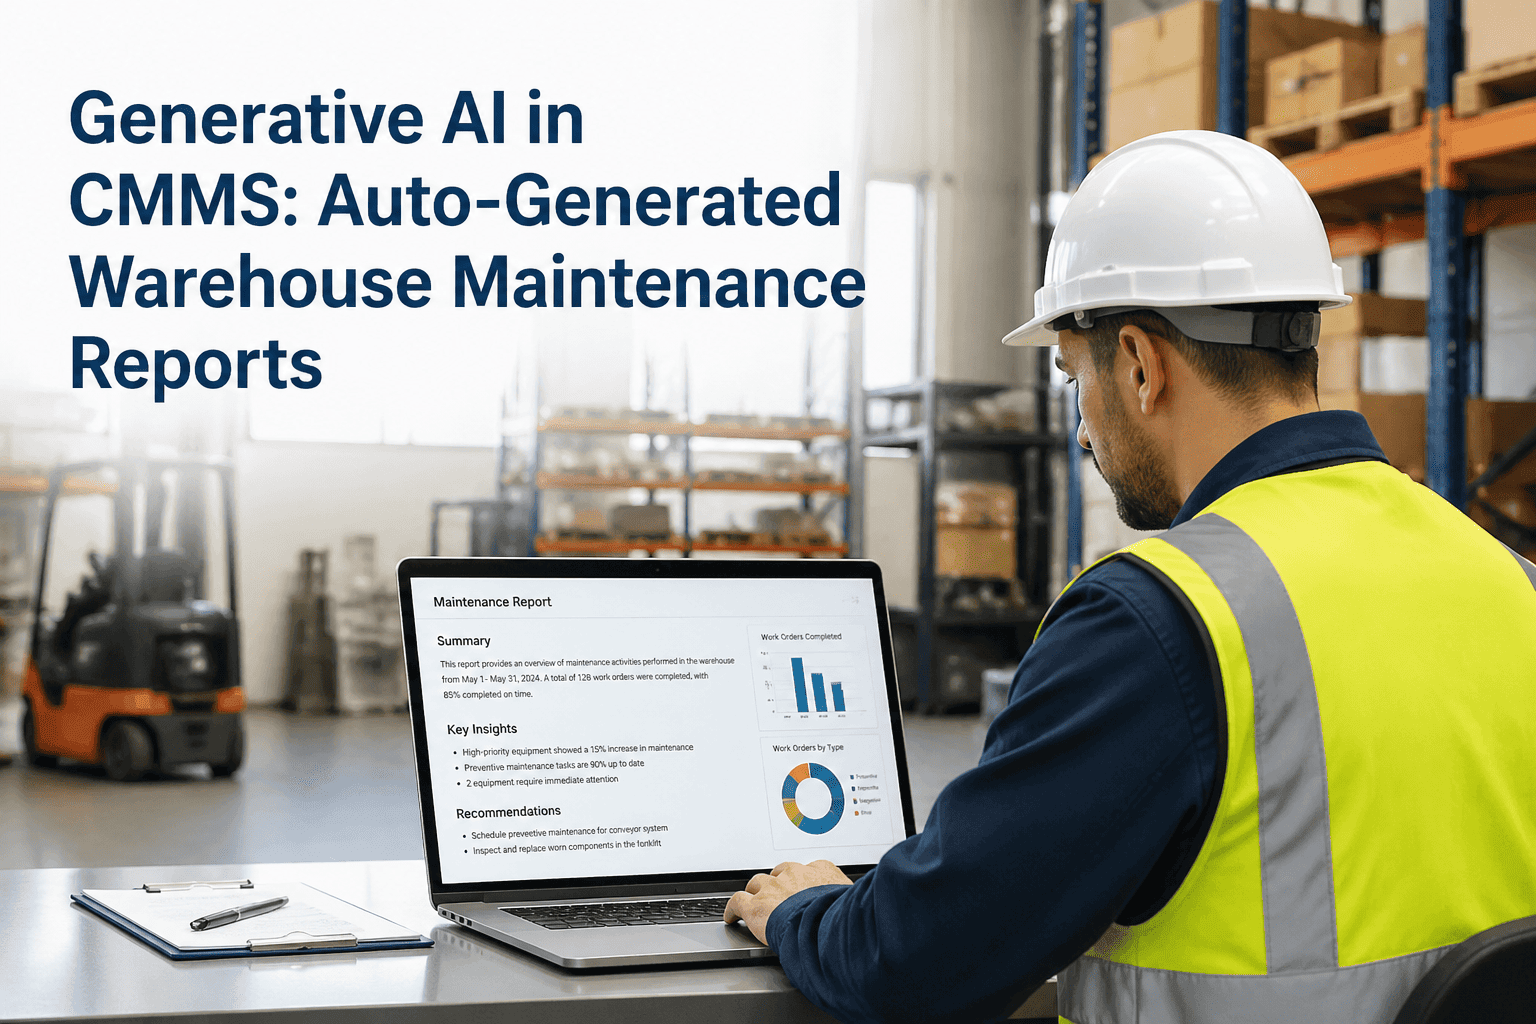
Warehouse maintenance managers spend an average of 6–10 hours every week doing something that delivers zero operational value: assembling reports. They pull work order data from one screen, sensor alert logs from another, failure histories from a third, and stitch it all into a slide deck or PDF that will be read once and shelved. By the time the report lands on a director's desk, the data it contains is already 3–5 days old — which means the decisions it should drive are being made on yesterday's operational picture. Generative AI embedded inside a CMMS changes that model completely. Instead of a maintenance manager manually translating raw data into narrative, the AI reads every sensor log, work order, failure event, and parts consumption record — and writes the report itself, in plain language, formatted for whatever audience needs it: operations team, executive leadership, or board review. Oxmaint's generative AI reporting layer produces shift summaries, weekly performance digests, failure root cause analyses, and board-ready maintenance scorecards in seconds — from the same data your team already captures every day.
Why Manual Reporting Is the Biggest Hidden Cost in Warehouse Maintenance
The maintenance team that runs your warehouse is expert at keeping conveyor systems moving, dock levelers functional, and racking inspection schedules current. They are not, by training or preference, data analysts. Asking them to spend a third of their administrative time building reports is asking the wrong people to do the wrong job — and the reports still come out late, inconsistent, and subjective.
Manual Reporting vs. AI-Generated Reporting — The Real Difference
Manual Process Today
6–10 hours per manager per week assembling data from disconnected sources
Reports delivered 3–5 days after the period they cover — decisions made on stale data
Narrative quality varies by author — same failure described differently by different managers
Board-level summaries require separate reformatting — another 2–4 hours per cycle
Root cause analysis depends on who wrote the work order — data quality is inconsistent
Generative AI in Oxmaint
Reports generated in seconds from live CMMS data — no manual assembly required
Shift-level, daily, weekly, and monthly summaries always current — zero lag between event and report
Consistent language and structure across every report — AI applies the same analytical framework every time
Audience-specific formatting — technical detail for operations, cost narrative for finance, KPI summary for executives
Root cause patterns surfaced across the full work order history — not just the current event
What Generative AI Actually Reads — And What It Produces
Generative AI in a CMMS is not a chatbot added on top of your data. It is a language model that reads structured operational data — sensor readings, work order fields, parts consumption records, failure codes — and produces coherent, accurate narratives that humans would have taken hours to write. Here is exactly what goes in, and what comes out.
Sensor Data
Temperature, vibration, current draw, cycle counts from conveyor motors, dock equipment, HVAC, and refrigeration units — streamed continuously and stored against each asset record
Work Order History
Every completed and open work order: asset ID, failure code, technician notes, time to complete, parts used, and cost — the full execution record
Failure Event Log
Unplanned stops, alert triggers, emergency work orders, and equipment downtime events with timestamps and duration — the reliability history
PM Completion Records
Scheduled PM tasks completed on time vs. delayed vs. skipped — compliance data that drives the planned maintenance ratio metric
Parts Consumption
Every part issued from inventory against a work order — consumption rate, cost per asset, stockout events, and reorder triggers
Shift Summary
Plain-language narrative of what happened during the shift — failures, completions, open issues, and any asset showing abnormal readings — ready before the next shift starts
Weekly Performance Digest
PM compliance rate, reactive vs. planned ratio, top 5 assets by downtime, parts spend vs. budget, and week-over-week trend commentary — formatted for operations review
Root Cause Analysis
When a failure repeats, AI surfaces the pattern across the full work order history and generates a structured RCA narrative — with contributing factors ranked by frequency
Board-Ready Scorecard
Executive-level maintenance KPIs with cost context, reliability trend, and forward-looking risk narrative — generated from the same underlying data, reformatted for a non-technical audience
Predictive Alert Brief
Assets showing pre-failure sensor patterns, ranked by estimated time to failure and production impact — a prioritized action list, not a raw alert feed
Stop Writing Reports. Start Reading Insights.
Oxmaint's generative AI turns your existing CMMS data into shift summaries, performance digests, and board-ready scorecards automatically — so your team spends zero hours on report assembly and full attention on the work the reports are pointing to.
The Six Report Types That Change Warehouse Maintenance Decisions
Not every report serves the same decision. A shift supervisor needs a different picture than a VP of operations — and both need a different picture than the CFO reviewing maintenance budget variance. Generative AI in Oxmaint produces all six report formats from the same underlying data, formatted for the reader who needs it.
01
Equipment Health Digest
For: Maintenance supervisors — daily
Every asset's current condition summarized in plain language. Sensors trending toward threshold are called out with estimated time to alert. Open work orders sorted by urgency. Zero data-hunting required to start the day with a complete operational picture.
02
PM Compliance Report
For: Maintenance managers — weekly
Completed PMs vs. scheduled, tasks deferred and why, assets with overdue maintenance by days, and compliance rate trend. The AI flags any asset where skipped PMs have correlated with increased corrective work orders in the following period — connecting the dots automatically.
03
Failure Pattern Analysis
For: Reliability engineers — on-demand
When the same asset or failure mode appears more than twice in a rolling window, the AI generates a structured root cause narrative — pulling the full work order history, the sensor data preceding each failure, and the parts consumed. It surfaces what human review would take hours to find.
04
Maintenance Cost Variance Report
For: Operations finance — monthly
Actual vs. budgeted maintenance spend by asset category, parts cost per work order, reactive vs. planned cost ratio, and a narrative explanation of the largest variances — written in language the finance team can act on, not maintenance jargon they need to decode.
05
Predictive Maintenance Forecast
For: Operations planning — rolling 4-week horizon
Assets expected to require intervention in the next 4 weeks, ranked by production impact and failure probability. The AI generates recommended actions and estimated window for each — giving planners the lead time to schedule during low-throughput periods instead of reacting mid-peak.
06
Executive Reliability Scorecard
For: Director / VP / Board — monthly
MTBF, MTTR, overall equipment effectiveness, maintenance cost as percentage of asset replacement value, and a forward risk narrative — summarized in one page with trend arrows and benchmark comparisons. No technical background required to read and act on it.
Measurable Impact — What AI-Generated Reporting Delivers
The benefits are not just about time saved on report writing. When decisions get made on current, accurate, AI-analyzed data instead of manually assembled summaries, the operational outcomes shift across the entire maintenance program.
38%
Reduction in administrative effort
Reported by facilities deploying AI-assisted work order and reporting workflows within 6 months
75%
Of manufacturers adopting hybrid AI analytics by 2026
Boston Consulting Group 2024 — the operational standard is shifting faster than most teams expect
32%
Reduction in work order backlogs at AI-pilot sites
Because decisions get made faster when the data is already organized and narrated
3–6 mo
Typical payback period on AI-powered CMMS deployment
Including reduced downtime, lower reactive maintenance cost, and recovered manager hours
Frequently Asked Questions
Does the AI replace our existing CMMS or add to it?
Oxmaint's generative AI layer reads from and writes back to your existing CMMS data — it does not replace your system or require migration. It connects to your work order, sensor, and asset data via standard APIs and begins generating reports from whatever history already exists in your system.
How accurate are the AI-generated root cause analyses?
Accuracy improves with data volume. For assets with 6 or more months of work order history and sensor data, the AI's pattern recognition matches or exceeds manual RCA quality — and delivers results in seconds rather than hours. Early deployments with limited history still surface useful frequency and cost patterns that manual review routinely misses.
Can the AI produce reports in different formats for different stakeholders?
Yes. Oxmaint generates the same underlying analysis in multiple formats — a technical detail report for maintenance engineers, a cost-focused summary for finance, and a one-page KPI narrative for executive review — all from a single data pull, with no manual reformatting required.
What sensor types and data sources does Oxmaint's AI connect to?
Oxmaint connects to IoT sensors via standard protocols including MQTT, Modbus, and REST APIs — covering temperature, vibration, current draw, and cycle count data from conveyor systems, dock equipment, HVAC, and refrigeration units. Manual inspection data entered via mobile app is included in the same analysis alongside automated sensor feeds.
How long does setup take before the AI starts producing useful reports?
Rule-based reports and shift summaries are available from day one. Pattern-based failure analysis requires 4–8 weeks of work order history to produce statistically meaningful root cause narratives. Most warehouse operations see their first high-confidence predictive insights within 60 days of deployment.
Your Warehouse Data Is Already Writing the Report — You Just Have to Let the AI Read It
Every sensor reading, work order, failure event, and parts transaction your warehouse generates today is the raw material for maintenance decisions that are currently being delayed by manual report assembly. Oxmaint's generative AI turns that data into decisions in seconds — and gives your maintenance managers back the hours they spend every week building slide decks instead of preventing failures.