School districts and university systems are sitting on a deferred maintenance crisis that grows larger every year it goes unaddressed. The American Society of Civil Engineers estimates the K-12 deferred maintenance backlog in the United States alone exceeds $85 billion — and most facility directors cannot tell their board exactly how much of that burden belongs to their own portfolio. Without a structured cost model, deferred maintenance stays invisible on budget spreadsheets until a roof collapses, an HVAC system fails mid-winter, or a boiler inspection triggers a building closure. The real cost of deferral is not the repair bill — it is the compounding degradation that turns a $40,000 roof repair into a $280,000 replacement five years later. Facility leaders who use asset condition data and structured cost calculators to quantify their backlog consistently win more capital funding, make smarter prioritization decisions, and stop the cycle of emergency spending that drains operating budgets. If you want to stop guessing and start calculating, start a free trial or book a demo to see how OxMaint builds your deferred maintenance cost model automatically.
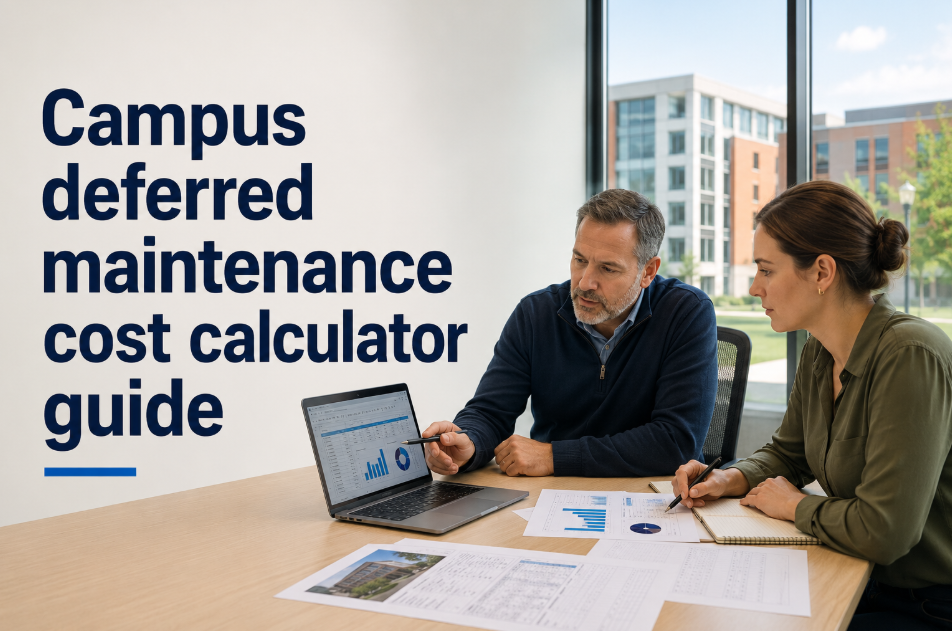
Campus Deferred Maintenance Cost Calculator: The Complete Guide
How to calculate, model, and present the true cost of your campus maintenance backlog — so you can stop losing budget battles and start winning capital funding with data your board cannot ignore.
What Is Deferred Maintenance — And Why the Real Cost Is Always Larger Than Reported
Deferred maintenance is any maintenance work that has been identified as necessary but postponed due to budget constraints, competing priorities, or a lack of visible urgency. On paper, deferral looks like budget discipline. In practice, it is a compounding liability that grows at 5–10% annually as asset condition deteriorates.
Most districts and universities undercount their deferred maintenance backlog because they track it the wrong way — listing only work orders that have been formally written up, not all known deficiencies across every building system. A roof with five years of identified deterioration that has never generated a work order is not in the backlog on paper. It is, however, a real liability that will require capital funding within the next budget cycle.
The other reason backlogs are underestimated is that they exclude secondary degradation. When a leaking roof is deferred, the water damage to ceiling tiles, insulation, structural members, and electrical systems is not included in the original repair estimate. Studies show that deferred roofing repairs generate an average of 2.3x their original cost in secondary system damage when left unaddressed for three or more years. Calculating your true backlog means accounting for this compounding effect — something most manual methods miss entirely. The most accurate approach uses condition-based asset data from a platform like OxMaint, where each asset's current condition score automatically informs a projected cost model. Want to see this in practice? Start a free trial or book a demo with our capital planning team.
The 4-Component Deferred Maintenance Cost Model
Accurate cost calculation requires four distinct components. Missing any one of them produces a number that will be challenged — and rejected — at the board level.
The current-year cost to restore the asset to its required condition level. This should use current local labor rates and materials pricing — not historical estimates from past capital plans. RSMeans data updated annually is the industry standard for school facility repair costing.
The annual cost increase applied for each year the repair is deferred. Structural and envelope systems escalate at 8–12% annually. Mechanical systems escalate at 5–8%. Electrical systems escalate at 4–6%. Applying the correct escalation rate to each asset class produces a defensible multi-year cost projection.
Costs generated by the deferred item's continued deterioration — water damage from leaking roofs, mold remediation from failed HVAC drain pans, structural damage from deferred concrete repairs. This component is almost always excluded from manual backlog estimates but represents 30–60% of total deferral cost.
The cost of operating around a failing asset — temporary heating, portable classrooms, utility inefficiency from degraded HVAC, and staff overtime managing emergency situations. A failing boiler typically costs $12,000–$18,000 in operational workarounds before it is replaced.
How to Calculate Deferred Maintenance Cost: Step-by-Step
This methodology is aligned with the APPA (Association of Physical Plant Administrators) standard for educational facility cost modeling. Apply it to any building system on your campus.
Group assets into APPA building system categories: Structural/Envelope, Mechanical (HVAC), Plumbing, Electrical, Roofing, Interior Finishes, Site/Grounds. For each system, record the asset, installation year, expected useful life, and current condition score (1–5 scale).
Calculate the cost to replace each asset at today's prices using RSMeans or a certified cost estimator. CRV is the baseline from which your FCI (Facility Condition Index) is derived. For schools, CRV typically ranges from $180–$280 per square foot depending on construction type and region.
For each asset below condition threshold, calculate the cost to restore it. Use the formula: DMN = (Repair Cost) x (Degradation Escalation Factor)^years deferred. A $50,000 roof repair deferred 4 years at 9% annual escalation becomes $70,580 — a $20,580 penalty for delay.
Apply a secondary damage multiplier of 1.3–1.6x depending on asset type (roofing and plumbing carry higher secondary risk than electrical). Apply an operational impact factor of 1.15–1.25x to assets where degradation causes ongoing utility waste or requires active workarounds.
Group the total deferred maintenance cost into three tiers: Critical (safety risk or imminent failure, address within 12 months), Necessary (significant deterioration, address within 3 years), and Planned (routine replacement at end of useful life, address within 5 years). This tiered presentation gives your board a decision framework, not just a number.
Manual Backlog Estimation vs CMMS-Driven Cost Modeling
The method you use to calculate deferred maintenance determines whether your board believes the number — and funds the work. Here is what separates a defensible cost model from a spreadsheet exercise.
| Evaluation Criteria | Manual / Spreadsheet Method | OxMaint CMMS-Driven Method |
|---|---|---|
| Data source for asset condition | Annual walkthrough, subjective scoring | Continuous digital inspection with timestamped condition scores |
| Asset coverage | Known assets only — typically 40–60% complete | Full asset registry — every system tracked in hierarchy |
| Cost escalation modeling | Flat percentage applied uniformly | Per-system escalation rates based on asset class |
| Secondary damage inclusion | Rarely included — 90% of spreadsheets omit it | Automatically flagged when related assets show degradation |
| Time to produce board report | 3–8 weeks of manual data gathering | Generated on demand in minutes |
| Update frequency | Annually, if at all | Real-time, updated with every inspection and work order |
| Audit and grant defensibility | Low — subjective and undocumented | High — timestamped records with technician sign-off |
| Multi-building portfolio view | Separate spreadsheets, inconsistent format | Unified portfolio dashboard across all buildings and campuses |
How OxMaint Builds Your Deferred Maintenance Cost Model Automatically
OxMaint's CapEx forecasting engine turns your asset condition data into a live, board-ready deferred maintenance cost model — updated continuously as your team completes inspections and work orders.
Every building system and component lives in OxMaint's asset hierarchy — Portfolio, Building, System, Asset, Component. Each carries a condition score updated through digital inspections and work order history.
OxMaint's forecasting model projects replacement and major repair costs across your entire portfolio for 5 or 10 years — by building, by system, and by priority tier — using current-year pricing inputs.
Generate a complete deferred maintenance cost report — including per-building FCI scores, priority tier breakdown, and year-by-year funding needs — in minutes, not weeks. Export in PDF or Excel format for board presentations.
Every inspection, work order, and condition assessment is timestamped and linked to the relevant asset. When state auditors or grant reviewers request documentation, your records are already organized and exportable.
Districts and universities that move from spreadsheet-based backlog tracking to OxMaint consistently report two outcomes: their calculated backlog increases (because they are now counting everything), and their board approval rates for capital funding increase because the data is suddenly credible and defensible. See how this works for your campus — start a free trial or book a demo with the OxMaint capital planning team.
What Accurate Cost Modeling Delivers
Presenting Deferred Maintenance Costs to Boards: What Works
Getting budget approval requires more than a large number. Boards respond to structured, risk-framed presentations that connect deferred maintenance cost to specific consequences and a clear funding ask.
Board members respond to liability and safety risk faster than abstract dollar figures. Frame your top deferred items in terms of regulatory compliance risk, student safety exposure, and insurance implications before presenting the repair cost.
Present the cost-if-deferred calculation alongside the current repair cost. A $75,000 boiler repair deferred three more years costs $97,000 — and risks a mid-winter failure that costs $185,000 including emergency service and temporary heat. The math wins the argument.
Never present a single total backlog number without context. Break it into Critical (fund now), Necessary (fund within 3 years), and Planned (include in 5-year capital budget). This gives the board a decision framework and makes the ask feel manageable.
Compare your campus FCI scores to APPA benchmarks (Good: below 0.05, Fair: 0.05–0.10, Poor: above 0.10). Boards understand percentile positioning. "We are in the bottom quartile of peer institutions" creates urgency that a dollar figure alone does not.
Frequently Asked Questions
What is the APPA standard for deferred maintenance cost calculation?
How do we conduct an asset condition assessment without hiring an external consultant?
Can deferred maintenance cost data support state or federal grant applications?
How often should we update our deferred maintenance cost model?
Your Backlog Is Larger Than Your Spreadsheet Shows
OxMaint gives facility directors and finance teams a live, board-ready deferred maintenance cost model — built from real asset condition data, updated with every inspection, and exportable in minutes. Stop defending estimates. Start presenting evidence. No implementation fees. No long onboarding. Your first building system inventory can be live within a week.