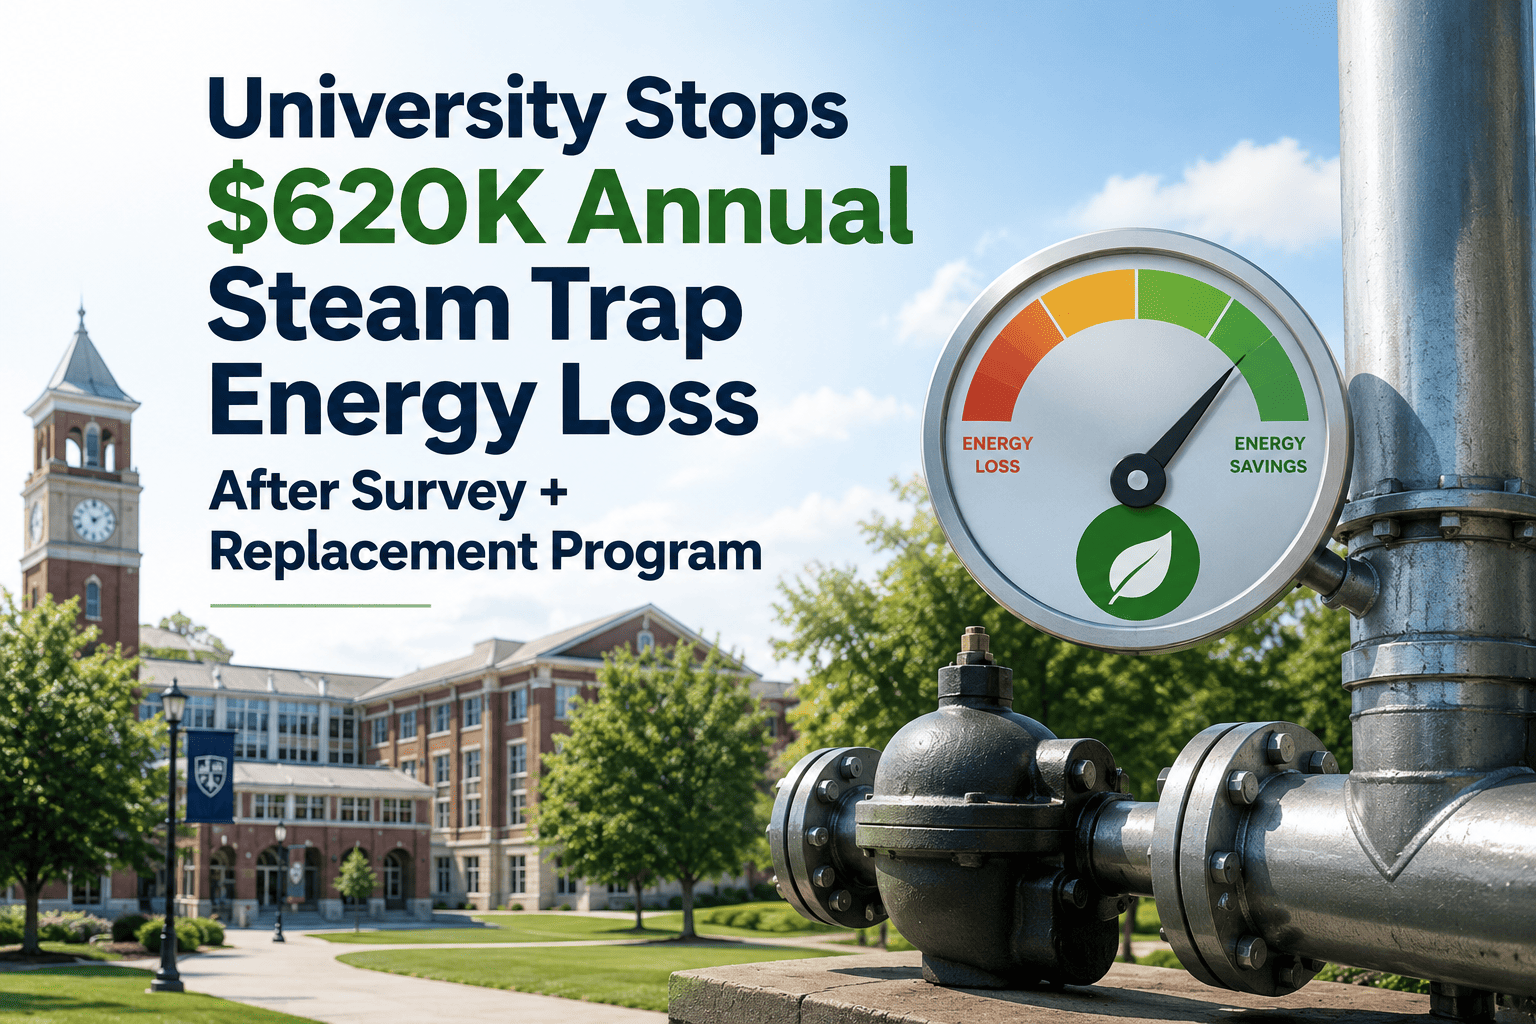
University central steam systems lose an average of 15–30% of generated BTUs through failed steam traps — a silent energy hemorrhage that costs mid-size campuses $180,000 to $420,000 annually in wasted fuel. Yet only 22% of higher education facilities departments conduct annual steam trap surveys, and fewer than 12% track trap condition, failure mode, and replacement history in a structured digital system. The math is straightforward: a single failed-open steam trap on a 150-psig distribution line wastes 75,000–150,000 BTUs per hour, 24 hours a day, 365 days a year. On a campus with 2,000+ traps, even a 10% failure rate represents a thermal loss equivalent to heating 40 dormitory rooms with no occupants. This guide covers the full scope of campus steam trap survey and replacement programs — from ultrasonic testing methodology to BTU-loss accounting, payback calculations, and CMMS-tracked replacement work orders that create permanent maintenance records. Campuses that implement structured trap programs with digital tracking report 18–26% reductions in steam system fuel costs within the first heating season. Ready to quantify your campus steam losses and build a replacement program with audit-ready documentation? Start a free trial or book a demo to see how Oxmaint manages trap surveys, replacement scheduling, and energy-loss reporting.
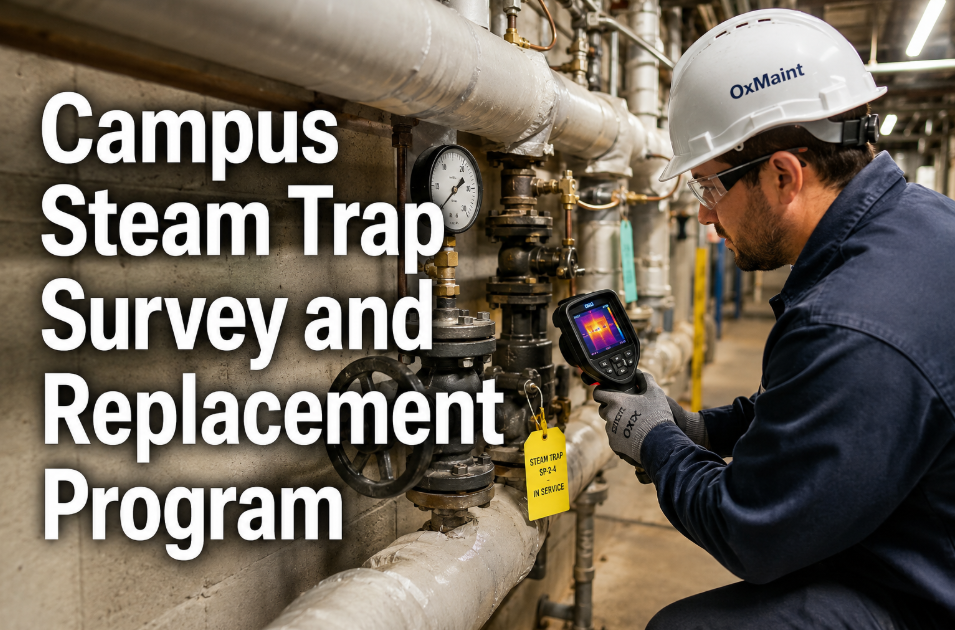
Campus Steam Trap Survey and Replacement Program
Ultrasonic testing protocols, BTU-loss accounting, payback math, replacement prioritization, and CMMS-tracked work orders — the operational guide for university energy and facilities managers.
Turn Steam Losses Into Capital Budget Wins
Oxmaint tracks every steam trap on campus — condition, failure mode, BTU loss estimate, replacement date, and payback period. See your trap inventory and energy savings in one dashboard during a 30-minute demo.
What Is a Campus Steam Trap Survey Program?
A campus steam trap survey program is a systematic process of locating, testing, documenting, and prioritizing every steam trap on a university's distribution and building systems. It combines field testing — primarily ultrasonic and temperature-based diagnostics — with engineering analysis that quantifies the BTU loss and dollar cost of each failed trap. The survey produces a prioritized replacement list ranked by energy loss, safety risk, and operational impact. When coupled with a CMMS, each trap becomes a tracked asset with a condition history, replacement schedule, and cost record that feeds energy reporting and capital budget requests. Without a survey program, campuses operate blind — replacing traps only when downstream equipment fails, water hammer damages piping, or condensate floods mechanical rooms. The reactive approach costs 3–5x more per trap when accounting for emergency labor, collateral damage, and wasted energy during the months or years the trap operated in a failed state.
Steam Trap Failure Modes and Their Campus Impact
Understanding failure modes is essential for prioritizing replacements. Each mode creates different operational, energy, and safety consequences across campus steam systems.
The trap passes live steam continuously into the condensate return system. This is the most expensive failure mode — a single 3/4-inch trap failed open at 150 psig wastes approximately 135,000 BTUs per hour, equivalent to $2,800–$4,200 per year in natural gas at current rates. Failed-open traps also overpressurize condensate return lines and can damage downstream equipment.
The trap does not open, causing condensate to back up into steam lines and heat exchange equipment. This creates water hammer — the violent shock when slugs of condensate impact pipe fittings at steam velocity. Water hammer has caused pipe ruptures, valve failures, and in severe cases, equipment explosions on campus systems. Failed-closed traps also reduce heating capacity, causing comfort complaints.
The trap passes some live steam while still removing some condensate — operating in a degraded state. Leaking traps are harder to detect than failed-open traps because they still provide partial function. However, they represent 30–40% of total campus steam losses because they can operate undetected for years. A trap leaking at 20% flow wastes $560–$840 per year.
A subset of failed-open conditions where the trap is blowing steam visibly or audibly to atmosphere through a vent or open discharge. This is the easiest failure to detect but often indicates the most severe condition. Blowing traps at campus tunnel access points and mechanical rooms also create safety hazards from steam burns and reduced visibility.
Survey Methodology: Ultrasonic Testing Protocol
Ultrasonic testing is the primary diagnostic method for campus steam trap surveys because it detects internal flow conditions without requiring system shutdown or trap removal. Here is the step-by-step protocol used by effective campus programs.
Locate and tag every trap on campus with a unique ID. Record trap type (thermodynamic, thermostatic, mechanical/float), size, manufacturer, application (drip leg, heat exchanger, tracer line), pressure rating, and building/tunnel location. Typical campuses have 1,500–4,000 traps.
Use an ultrasonic detector (contact probe on trap body) to listen for internal flow patterns. A functioning trap cycles — the ultrasonic signature shows intermittent flow. A failed-open trap shows continuous high-frequency noise. Supplement with infrared temperature readings: inlet-to-outlet temperature differential indicates trap condition. A working trap shows 10–30 degrees F differential; a failed-open shows near-zero.
For each failed trap, calculate energy loss using orifice size, operating pressure, and failure mode. Standard DOE steam trap loss tables provide BTU/hr estimates by trap size and pressure. Multiply by operating hours and fuel cost per million BTU to calculate annual dollar loss. A campus running 5,500 heating hours per year with natural gas at $8.50/MMBtu uses these inputs directly.
Rank failed traps by annual energy cost and generate replacement work orders in priority sequence. Schedule replacements during summer shutdown or scheduled building outages. After replacement, set recurring survey PM at 12-month intervals for each trap. Track replacement cost vs. energy savings to document program payback for budget justification.
BTU-Loss Accounting: The Payback Math
The financial case for steam trap programs is compelling when presented with real numbers. Here is a representative calculation for a mid-size campus, which demonstrates why this program consistently delivers the fastest ROI of any campus energy project. Energy managers who build these calculations into CMMS-generated reports secure capital funding 2.4x faster — build your own campus model with a start a free trial or walk through the reporting with a book a demo.
| Parameter | Value |
|---|---|
| Total campus traps | 2,200 |
| Failure rate (surveyed) | 14% (308 traps) |
| Average BTU loss per failed trap | 95,000 BTU/hr |
| Annual operating hours | 5,500 hrs |
| Total annual BTU loss | 161 billion BTU |
| Natural gas cost | $8.50 / MMBtu |
| Boiler efficiency | 82% |
| Annual fuel waste | $246,000 |
| Replacement cost (308 traps) | $185,000 |
| Simple payback | 9.0 months |
Manual Tracking vs CMMS-Managed Trap Programs
- Trap inventory in Excel — no condition history
- Survey results filed as PDF reports, not linked to assets
- No automatic reminder for next annual survey
- BTU-loss calculations done manually per trap
- Replacement work orders disconnected from survey data
- Payback reporting requires hours of manual compilation
- Each trap is an asset with full condition history
- Survey results logged directly on asset record with photos
- Annual survey PM auto-scheduled for every trap
- BTU-loss formulas embedded in inspection checklists
- Failed traps auto-generate prioritized replacement WOs
- Cumulative savings dashboard updates in real time
Campus Steam Trap Program Results
Frequently Asked Questions
How many steam traps does a typical university campus have?
How often should campus steam traps be surveyed?
What equipment is needed for ultrasonic steam trap testing?
Can Oxmaint calculate BTU losses automatically during trap surveys?
Stop Heating the Ground — Start Tracking Every Trap
Every failed steam trap on your campus is burning money 24 hours a day. Oxmaint turns your trap inventory into a managed asset program with survey scheduling, BTU-loss accounting, replacement work orders, and payback reporting — all in one platform. See your campus steam savings potential in a 30-minute demo.