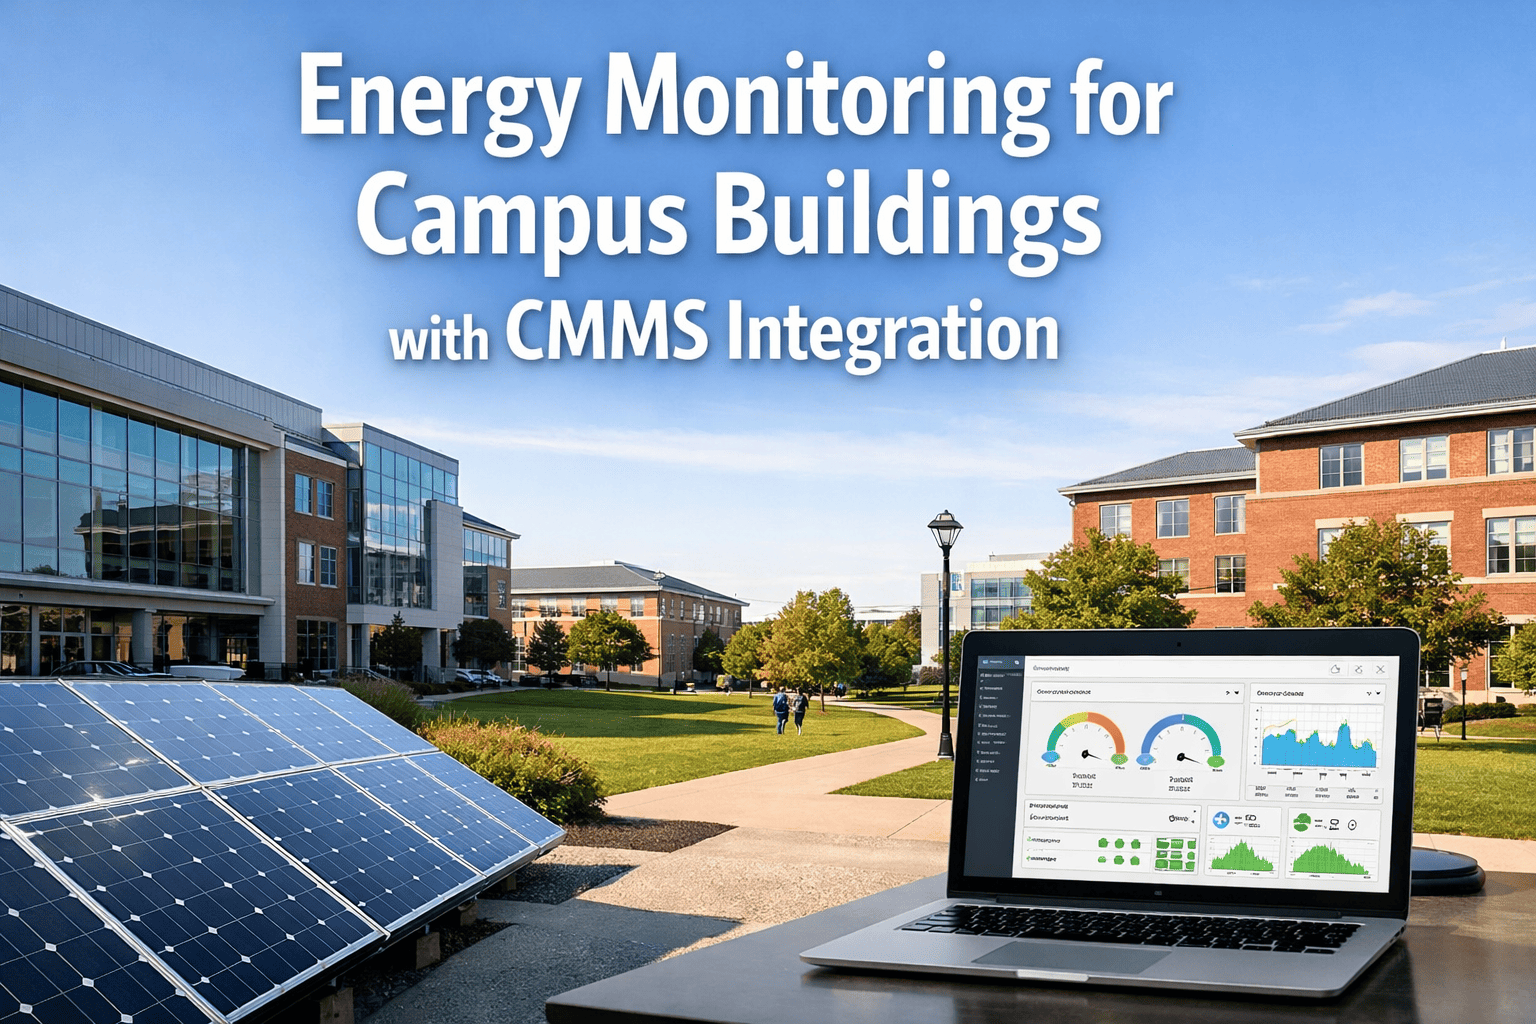
Universities in the United States spend an average of $2.10 per gross square foot annually on energy — and campuses with buildings ranging from 50 to 100+ years old frequently exceed $3.50 per square foot because aging mechanical systems, poor envelope performance, and absent submetering make it impossible to identify where energy is being wasted. The typical campus energy manager knows the total utility bill but cannot attribute consumption to individual buildings, systems, or operating schedules with any precision — because fewer than 22% of US university buildings have granular submetering beyond the main utility meter. Without submeter data, anomaly detection is guesswork, fault detection and diagnostics are impossible, and the energy manager's primary tool for reducing consumption is sending emails asking departments to turn off lights. Oxmaint changes this equation by connecting submeter data, CMMS work order routing, and asset-level maintenance records into a single operational platform — so that when a chiller plant runs 18% above baseline consumption on a Tuesday in October, the anomaly triggers a CMMS work order routed to the right technician before the monthly utility bill even arrives. If your campus energy program operates on monthly utility invoices instead of real-time submeter analytics, start a free trial or book a demo to see how CMMS-routed energy work orders work in practice.
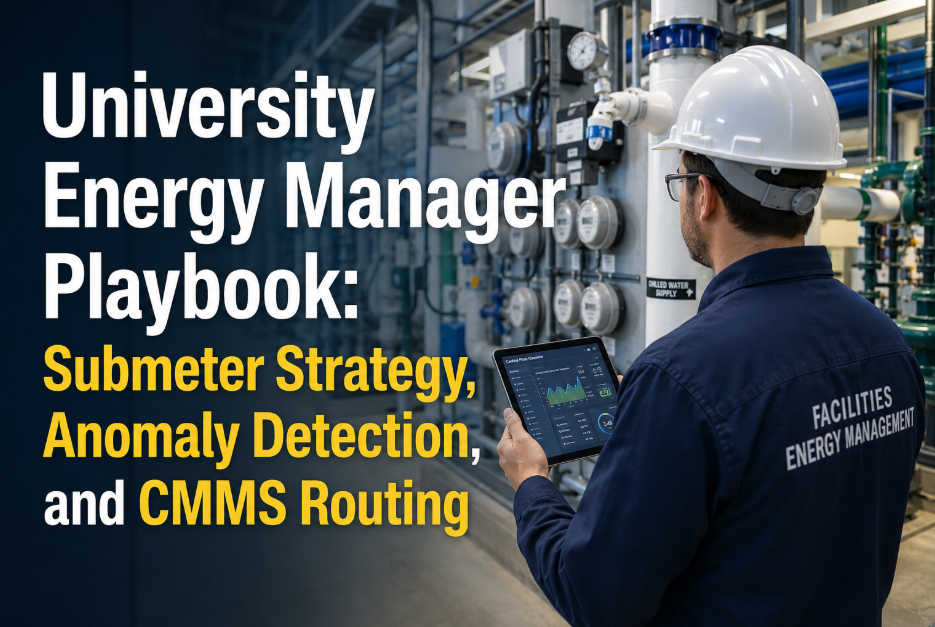
University Energy Manager Playbook: Submeter Strategy, Anomaly Detection, and CMMS Routing
Campus submeter deployment strategy, automated anomaly detection, fault detection and diagnostics integration, and CMMS-routed energy work orders that turn consumption data into maintenance action.
Energy Data Without Maintenance Action Is Just an Expensive Dashboard
Most campus energy management platforms excel at visualization — charts, trend lines, building comparisons — but fail at the critical last mile: converting an energy anomaly into a maintenance work order assigned to a specific technician on a specific piece of equipment. Oxmaint bridges this gap by integrating submeter data and FDD outputs directly into the CMMS work order workflow. When an anomaly is detected, a work order is created, prioritized, assigned, and tracked to resolution — with the energy impact documented in the asset's maintenance history. Ready to close the loop? Start a free trial or book a demo to see the submeter-to-work-order workflow.
Campus Submeter Deployment: Where to Meter, What to Measure
Submetering every circuit on campus is neither practical nor necessary. The goal is to deploy meters at points that provide actionable visibility — the specific buildings, systems, and load types where consumption data changes maintenance behavior. Research from ASHRAE and APPA indicates that 80% of campus energy waste is concentrated in 20% of buildings, and within those buildings, HVAC systems account for 45–65% of total consumption. A strategic submeter deployment targets these high-impact points first.
Every building over 10,000 sq ft should have a dedicated electrical meter and, where applicable, a thermal meter (chilled water BTU, steam condensate, or hot water). Building-level data enables EUI benchmarking, occupancy-normalized comparisons, and detection of buildings operating significantly above peer baselines. Cost: $2,000–$8,000 per meter installed.
Within high-consumption buildings, meter the major systems separately: central plant (chillers, boilers), air handling units, lighting panels, and plug load panels. System-level data isolates HVAC from lighting from plug loads — revealing whether high consumption is a mechanical fault, a scheduling issue, or an occupant behavior problem. Cost: $1,500–$5,000 per point.
For critical or high-consumption equipment — large chillers, cooling towers, lab exhaust fans, data center UPS systems — individual equipment meters enable performance trending, efficiency degradation tracking, and precise fault identification. Equipment-level metering supports kW/ton tracking for chillers, fan power per CFM for AHUs, and pump efficiency curves. Cost: $800–$3,000 per device.
Where cost allocation or behavioral incentives are objectives — auxiliary enterprises, student housing, leased spaces — tenant-level metering enables consumption-based billing and awareness programs. Studies show that buildings with visible consumption feedback reduce energy use by 8–15% from behavioral changes alone. Cost: $1,200–$4,000 per tenant boundary.
Six Energy Anomalies That Only Submeter Data Reveals
Energy anomalies are consumption patterns that deviate from expected baselines — and each one represents either wasted energy, equipment degradation, or a maintenance deficiency that a work order should address. Without submetering, these anomalies are invisible until they accumulate into a utility bill increase large enough to notice at the campus level — typically 30–90 days after the fault begins.
The single most common energy waste pattern in university buildings — reheat coils fighting cooling coils in the same air handling unit or adjacent zones. Submeter data shows heating and cooling energy both active in the same building during mild weather. This fault wastes 15–25% of total HVAC energy and is invisible without separate heating and cooling submeters. Oxmaint generates a CMMS work order to investigate BAS scheduling, economizer operation, and zone sensor calibration.
Buildings that consume 60–80% of their peak load during unoccupied hours — nights, weekends, breaks — indicate systems running without setback schedules, stuck valves preventing shutdown, or equipment cycling continuously. A 5% base load reduction across a 2-million-sq-ft campus saves $180,000–$300,000 annually. Submeter interval data reveals the exact hours and systems responsible.
A chiller operating at 0.85 kW/ton instead of its rated 0.55 kW/ton is consuming 55% more energy per ton of cooling — but this degradation occurs gradually over months and is invisible without equipment-level electrical submetering combined with thermal output metering. Oxmaint tracks kW/ton trending per chiller and generates PM work orders when efficiency drops below configurable thresholds.
Failed steam traps waste 10–20% of a campus steam distribution budget — and a single failed-open trap can waste $5,000–$15,000 in steam per year. Thermal submetering at building steam entry points detects consumption anomalies that indicate trap failure clusters. Oxmaint routes trap survey work orders to the appropriate zone and tracks replacement history per trap.
Laboratory buildings consume 4–8x more energy per square foot than office buildings, primarily due to exhaust ventilation. Fume hoods left open when not in use, VAV exhaust systems not reducing flow during unoccupied periods, and makeup air units running at full capacity during low-occupancy periods are detectable through electrical submetering of exhaust fan VFDs. Each anomaly generates a work order to verify sash position sensors, VAV damper operation, and BAS scheduling.
Lighting panel submeters reveal buildings where lighting consumption does not drop to near-zero during unoccupied hours — indicating failed occupancy sensors, overridden schedules, or zones where automated controls were never commissioned. Lighting represents 15–25% of campus electricity and after-hours waste is typically 8–12% of total lighting energy. CMMS work orders target specific panel zones for occupancy sensor repair or schedule correction.
Fault Detection and Diagnostics: From Algorithm to Work Order
Fault Detection and Diagnostics (FDD) platforms analyze BAS point data, submeter readings, and weather data to identify equipment operating outside normal parameters. The technology is mature — FDD systems can detect stuck dampers, failed sensors, valve hunting, economizer faults, and scheduling errors with high accuracy. But FDD platforms generate fault notifications, not maintenance action. The gap between "fault detected" and "technician dispatched" is where most campus energy programs lose value. Oxmaint closes this gap by receiving FDD fault outputs and automatically generating prioritized CMMS work orders with the fault diagnosis, affected equipment, and recommended corrective action included.
Interval data from electrical submeters, thermal meters, and BAS trend logs flows into the FDD platform continuously — 15-minute intervals for electrical, 5-minute for critical mechanical systems.
FDD algorithms compare real-time data against baseline models, weather-normalized expectations, and equipment performance curves. Deviations exceeding configurable thresholds generate fault diagnoses with confidence scores.
Oxmaint receives the fault diagnosis and automatically creates a work order assigned to the appropriate technician — with the fault description, affected asset, energy impact estimate, and recommended diagnostic steps included in the work order body.
The technician completes the repair, documents the corrective action, and Oxmaint verifies through post-repair submeter data that the anomaly is resolved. The entire sequence — detection, diagnosis, dispatch, repair, verification — is documented in the asset's maintenance history.
How Oxmaint Powers the University Energy Manager's Workflow
Oxmaint is not an energy analytics platform — it is the operational backbone that turns energy analytics into maintenance execution. Submeter data identifies the problem. FDD diagnoses the cause. Oxmaint dispatches the technician, tracks the repair, verifies the result, and documents the energy savings — all within the same platform that manages every other maintenance work order on campus. Energy managers who want to move from dashboards to action can start a free trial or book a demo to see the complete energy-to-work-order workflow.
Oxmaint integrates with IoT submeter platforms and SCADA/BAS systems via API, receiving real-time consumption data and fault signals that trigger automated work order creation without manual intervention.
Every energy-related work order includes the estimated energy waste in kWh or therms, the affected asset, and the diagnostic recommendation — giving technicians context and giving energy managers measurable outcomes per repair.
Track chiller kW/ton, boiler combustion efficiency, AHU fan power per CFM, and pump efficiency over time — linked to the maintenance events that affect performance. Identify whether a PM restored efficiency or whether deeper intervention is needed.
Export energy work order outcomes — kWh saved, therms avoided, carbon reduced — for AASHE STARS submissions, climate action plans, and board-level sustainability reporting. Every repair is quantified, not estimated.
Compare EUI, maintenance cost per square foot, and energy work order volume across buildings. Identify the buildings with the highest energy waste density and prioritize capital retrofits and operational improvements accordingly.
Use equipment efficiency trends and energy anomaly frequency to prioritize chiller replacements, boiler conversions, VFD retrofits, and lighting upgrades by projected ROI — feeding capital planning with operational data instead of consultant estimates.
Monthly Invoice Review vs. Real-Time Energy CMMS Workflow
Energy Program Outcomes Universities Report with CMMS-Routed Workflows
Universities with integrated submeter + CMMS workflows report 12–25% energy cost reduction within the first 18 months of operation
Down from 72+ hours with manual email-based fault communication — automated routing eliminates the energy manager bottleneck
Average documented energy savings from CMMS-routed fault resolution across a 2-million-sq-ft campus portfolio
Every energy fault detected, diagnosed, dispatched, repaired, and verified is documented in the CMMS — measurable, auditable, reportable
Frequently Asked Questions
Does Oxmaint replace our existing energy analytics or FDD platform?+
What submeter data formats does Oxmaint integrate with?+
How do you prioritize submeter deployment on a limited budget?+
Can Oxmaint track energy savings per maintenance work order?+
Stop Reviewing Energy Bills — Start Routing Energy Work Orders
The university energy manager who can show the CFO exactly which equipment faults wasted how many kWh, which technicians resolved them, and how much energy was saved per repair — that energy manager gets the capital budget for the next retrofit. Oxmaint makes that documentation automatic. No heavy implementation. First energy work orders routed in week one.