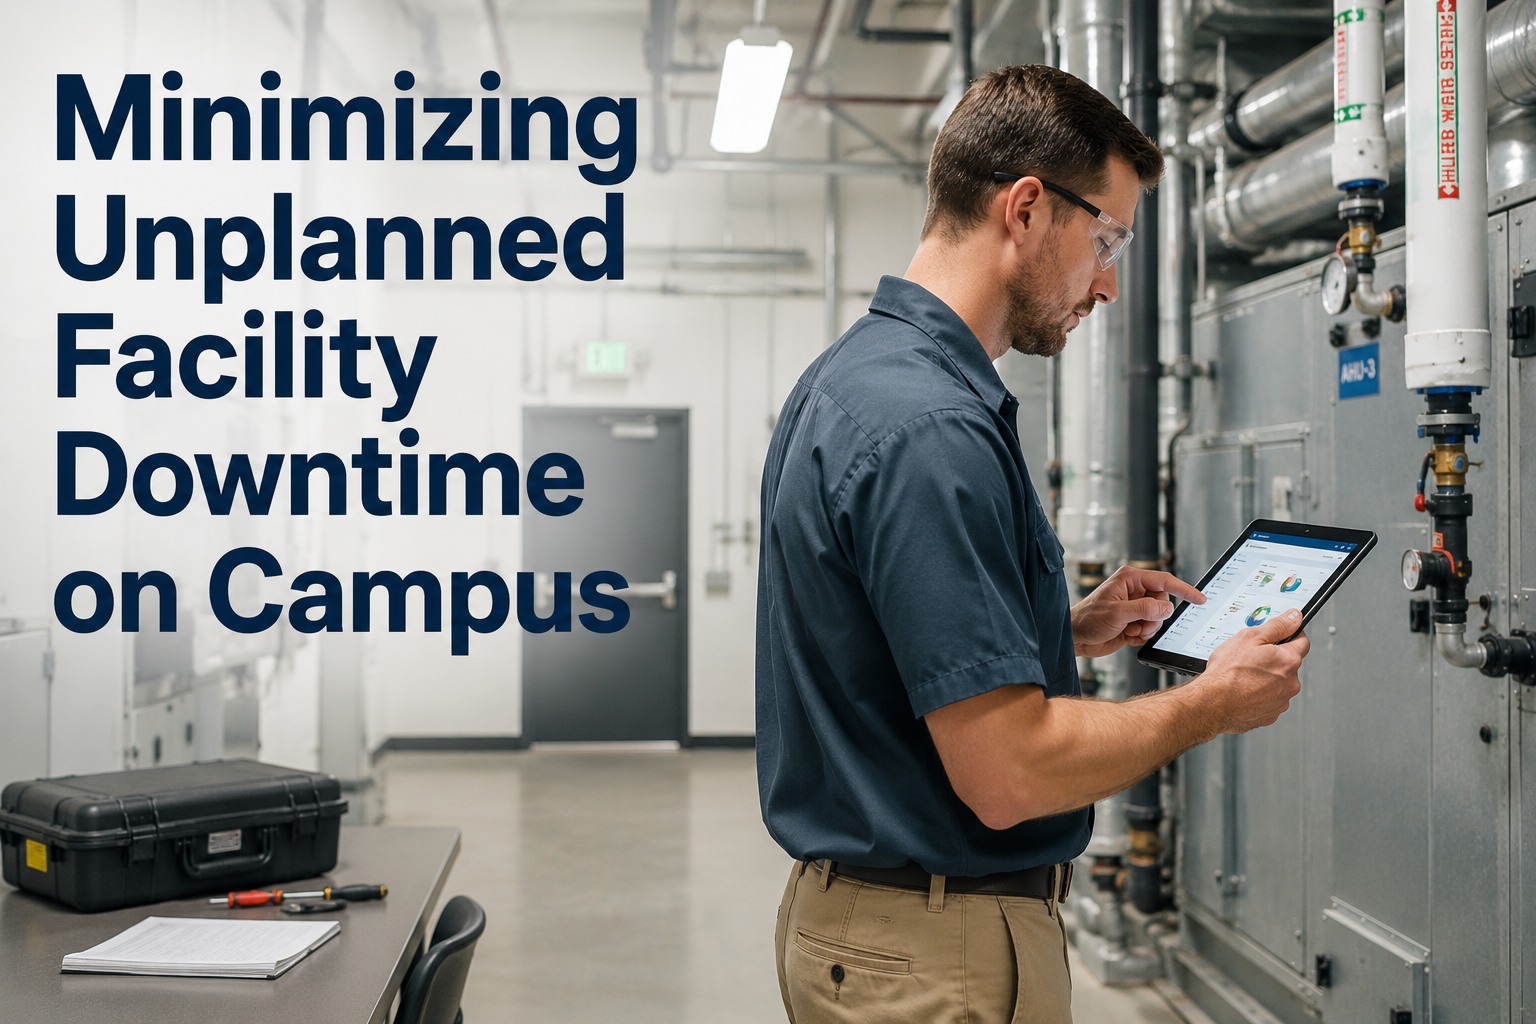
Unplanned facility downtime on a campus is rarely just a maintenance problem — it is an instructional, safety, and budget problem that compounds by the hour. A single chiller failure in August, a frozen sprinkler line in January, or a transformer trip during finals week can relocate hundreds of students, idle staff, and trigger emergency repair invoices that dwarf a quarter's preventive maintenance budget. This guide breaks down how to minimize unplanned facility downtime across a campus using reliability-centered maintenance, redundancy planning, PM discipline, and emergency response protocols that limit impact when something does fail. If you want to move from triage mode to uptime mode, Start Free Trial and put the work order, asset, and PM schedule on one platform.
What would 30 hours of unplanned downtime cost your campus next semester?
On a mid-size campus, a single HVAC or electrical failure can displace 400+ students, cancel lab sessions, and push emergency repair spend past $18,000 in 48 hours. Reliability-focused maintenance changes the math — fewer surprises, faster recovery, defensible budgets.
Why unplanned campus downtime is more expensive than the repair invoice
Education facilities lose roughly 9% of their annual operating time to unplanned outages, and the indirect cost — disrupted instruction, rescheduled exams, food spoilage, IT recovery — runs 3 to 5 times the direct repair cost. The first step in reducing facility downtime on campus is measuring all of it, not just the technician's bill.
A 1,200-student high school lost chilled water to its science wing for 22 hours in May. Direct repair: $6,400. Relocated labs, make-up exams, custodial overtime, and IT server-room cooling rental: $31,200. The principal saw the $6,400 invoice. The business office saw the real number nine weeks later.
Four levers that move a campus from reactive to reliable
ISO 55000-aligned asset management is not about fixing things faster — it is about failing less often and recovering predictably. These four levers, applied in order, typically cut unplanned downtime by 30–45% within two academic terms.
Rank every asset by instructional and safety impact
Tag each pump, air handler, switchgear, and door controller with a criticality score (A/B/C) and a failure mode analysis. A-tier assets — boilers, main electrical, life-safety, kitchen refrigeration — get condition monitoring and a documented redundancy path. C-tier assets get run-to-failure with a stocked spare. This single step typically reassigns 20–30% of PM hours toward assets that actually move the uptime needle.
Hit 90%+ PM compliance on critical assets every month
Campuses that complete 90% or more of scheduled preventive maintenance on A-tier assets see roughly half the unplanned failures of those below 60% compliance. That means filter changes, belt tension, lubrication, thermography, and coil cleaning done on calendar or runtime triggers — not when someone remembers. Automated PM scheduling with photo and signature capture closes the loop.
Pre-stage the fallback before you need it
For every A-tier system, document the redundancy path: N+1 on pumps and chillers, generator backup for life-safety and server rooms, cross-tied domestic water, portable AC and heater rentals on a standing PO. When a chiller trips at 2 a.m. in August, the question is never "who do we call?" — it is "execute Plan B."
Limit blast radius when failure still happens
Even with strong PM, failures occur. A written emergency response protocol — first responder, escalation tree, vendor call list, student relocation map, communications template — reduces time-to-mitigation by 40–60%. The goal is not zero failures; it is a 2-hour mitigation instead of a 9-hour cascade.
The high-PM-compliance checklist for campus critical assets
Run this 12-point checklist against each A-tier asset quarterly. Campuses that maintain 90%+ completion on these items consistently report fewer unplanned outages and lower emergency repair spend.
HVAC & Chillers
- Coil cleaning and filter swap on runtime trigger
- Belt tension and sheave alignment quarterly
- Refrigerant leak survey each season change
- Standby chiller auto-start tested monthly
Electrical & Power
- Infrared thermography on switchgear semi-annually
- Generator load test under 80%+ monthly
- UPS battery impedance test per schedule
- Transfer switch exercise and log
Plumbing & Domestic Water
- Backflow preventer annual test and tag
- Pressure-reducing valve inspection quarterly
- Sump and ejector pump float and alarm test
- Freeze-protection walk before first hard freeze
Life Safety & Doors
- Fire alarm panel signal and battery check
- Sprinkler riser and valve inspection per NFPA
- Magnetic door hold-opens and egress test
- Emergency lighting and exit sign load test
The facility uptime formula every campus should track
Uptime is not a feeling — it is a number. Track facility uptime per building per month using this straightforward calculation, then benchmark term-over-term. Most campuses are surprised to learn their real uptime is 91%, not the 99% they assumed.
| Scenario | Unplanned downtime / yr | Emergency repair spend | Avg. facility uptime | Students displaced / yr |
|---|---|---|---|---|
| Reactive (run-to-failure) | 96 hrs | $42,000 | 91.0% | 680 |
| Basic PM (60% compliance) | 62 hrs | $29,500 | 94.3% | 410 |
| Disciplined PM (90%+ compliance) | 34 hrs | $16,200 | 96.9% | 180 |
| Reliability-centered + redundancy | 18 hrs | $9,500 | 98.3% | 70 |
A two-hour mitigation timeline for campus failures
When failure happens, speed of mitigation matters more than the repair itself. This is the timeline a disciplined campus team follows — from first signal to controlled fallback — to keep a single failure from cascading across the building.
Detect and acknowledge
BMS alarm, work-order trigger, or staff report is acknowledged in the CMMS. Criticality tier auto-populates. Tier-A failures page the on-call lead and facilities director simultaneously.
Assess and isolate
Technician on site confirms failure mode, isolates the affected system, and verifies redundancy path is available. Photos and readings logged to the work order for vendor escalation.
Activate fallback and comms
Standby equipment engaged, rental equipment dispatched if needed, and the principal's office receives a one-paragraph impact brief with relocation plan for affected classes.
Stabilize and log
Affected zone stabilized at fallback capacity. Vendor ETA confirmed. Root-cause investigation work order opened. Updated posted to the operations dashboard for the next 24 hours.
Stop firefighting. Start tracking uptime like a KPI.
Bring PM schedules, asset criticality, emergency protocols, and downtime tracking onto one platform — and see your campus uptime number move within the first term.
Campus downtime questions, answered
What counts as unplanned facility downtime on a campus?
Any unscheduled loss of a building system that interrupts instruction, operations, or occupancy — an HVAC outage, burst pipe, power trip, elevator failure, or life-safety system fault. Scheduled maintenance, holidays, and planned shutdowns do not count. The key metric is hours of unplanned interruption per building per month, tracked against scheduled operating hours.
How much can we realistically reduce unplanned downtime?
Campuses moving from reactive maintenance to disciplined PM at 90%+ compliance typically cut unplanned downtime by 30–45% within two terms. Adding redundancy planning and a written emergency response protocol pushes the reduction toward 55–65% and shrinks time-to-mitigation from hours to under two hours. You can Start Free Trial to baseline your current uptime and track improvement month over month.
Which assets should we prioritize first?
Start with A-tier assets that directly affect safety, instruction continuity, and large populations: central chillers and boilers, main electrical switchgear, life-safety systems, kitchen refrigeration, and server-room cooling. Rank by combined criticality score (population affected × cost of failure × recovery time), not just asset value, and apply PM and redundancy to the top 20% first.
Do we need a full CMMS to make this work?
A spreadsheet can track PM compliance for 50 assets, but it breaks down past that — no photo capture, no automated triggers, no downtime rollup. A purpose-built maintenance platform pays for itself the first time it prevents a single chiller failure during exam week. Most campuses see positive ROI within 60–90 days of full rollout.
How do we get buy-in from leadership for the investment?
Lead with the indirect cost number, not the repair invoice. Show the 3:1 indirect-to-direct ratio, the students-displaced count, and the make-up exam and overtime spend from your last major failure. Pair it with the uptime formula and a 90-day pilot on two buildings. Book a walkthrough at Book a Demo to build the business case together.
Bring campus uptime above 98% this academic year
Asset criticality, PM compliance, redundancy planning, and emergency response — all on one platform built for education facilities. See your uptime number within the first 30 days.
Free 14-day trial · No credit card