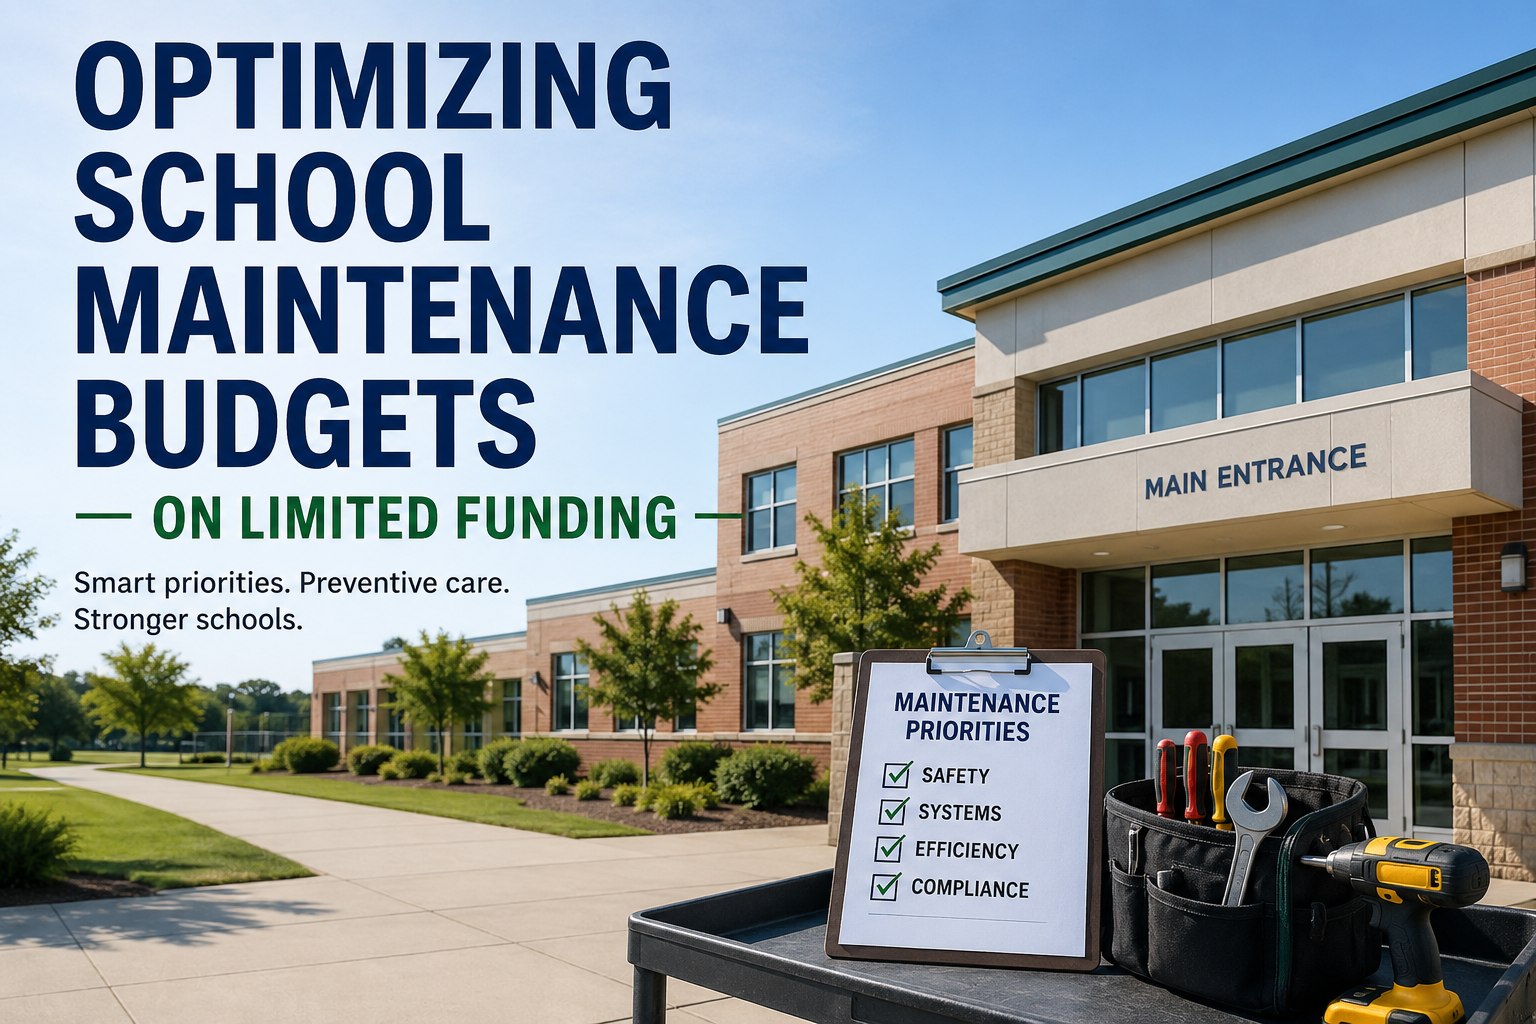
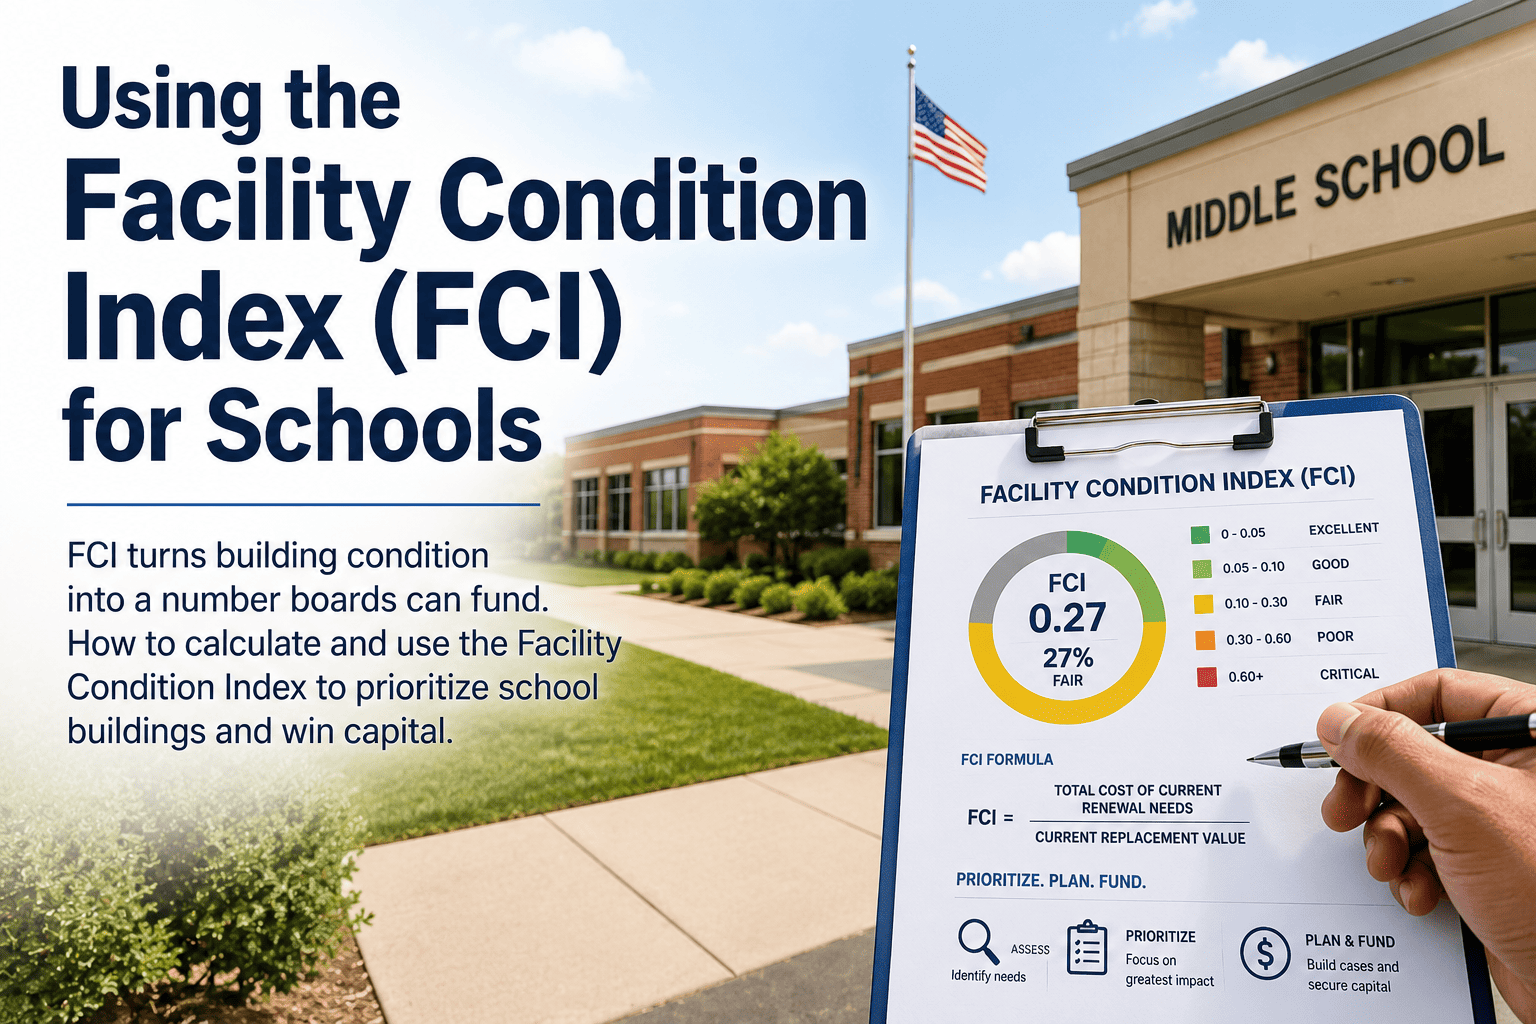
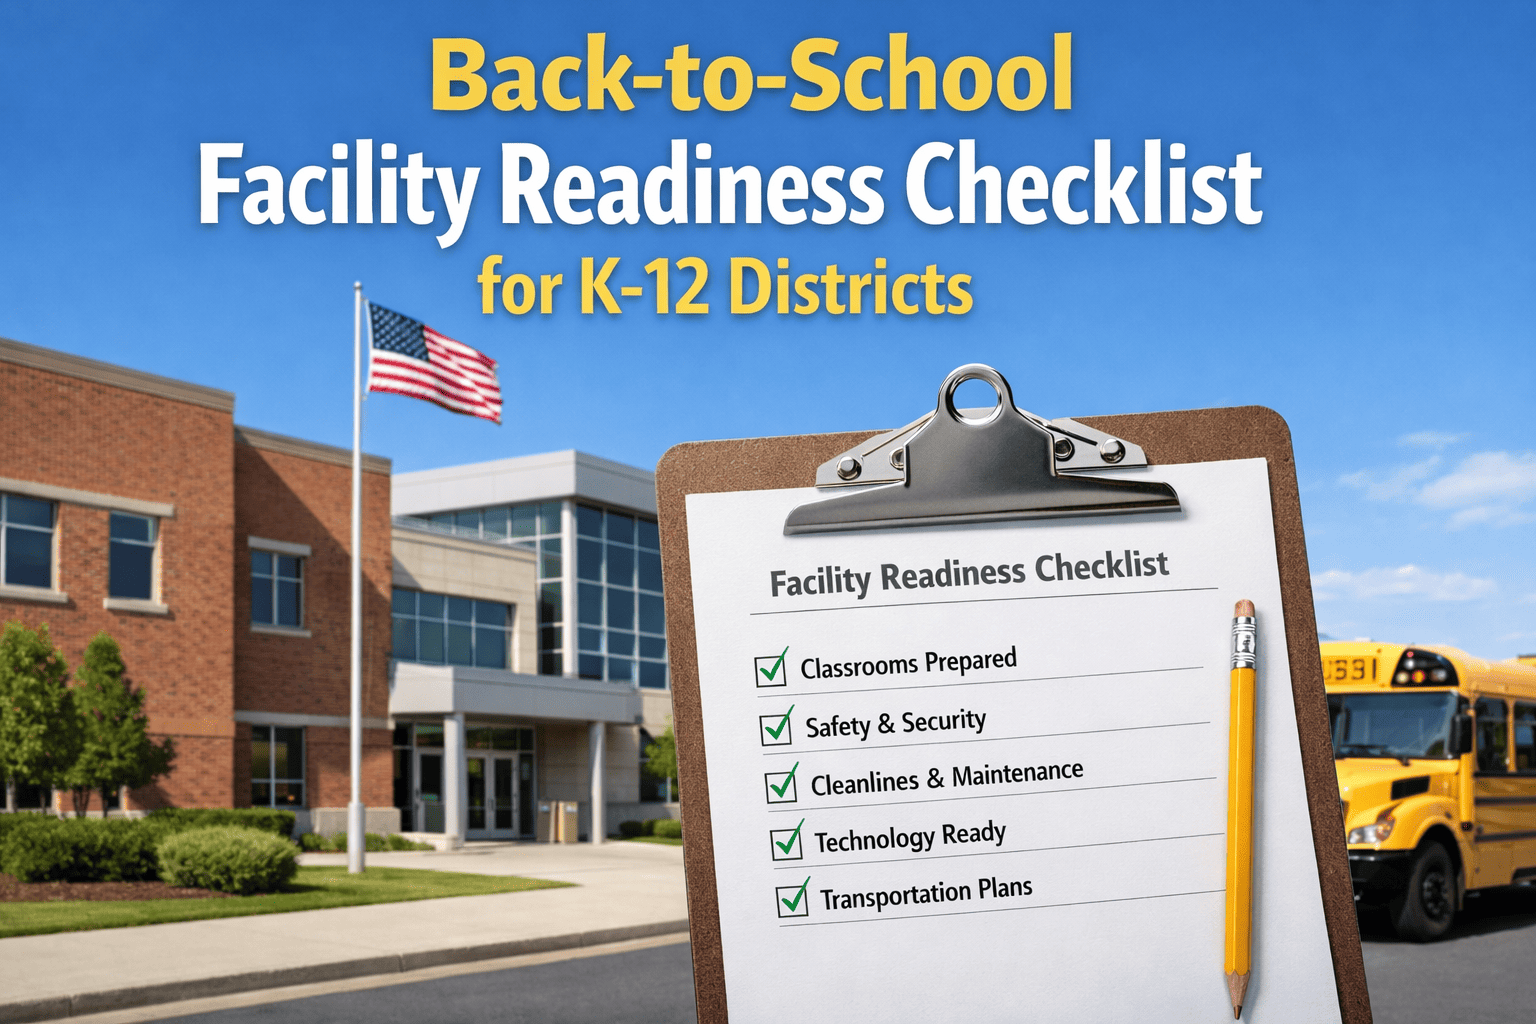
School maintenance budgets are almost always tight, yet districts that stretch them furthest run preventive, data-driven programs instead of reactive ones. With facilities receiving only about 10% of education spending — well below the 7% best-practice benchmark — every dollar must work harder. This guide walks through optimizing school maintenance budgets on limited funding: preventive maintenance versus reactive spend targets, high-ROI reliability moves, deferred maintenance triage, and the budget defense strategies that keep facility funding from being the first line cut every year. When you're ready to put these methods into practice, you can Start Free Trial and begin tracking every work order, asset, and dollar in one place.
School Facility Budget Guide
Can your maintenance budget do more with less — without cutting corners on student safety?
Districts running preventive, data-driven maintenance programs spend up to 40% less on emergency repairs than reactive peers. The gap between surviving and thriving on limited funding comes down to how you prioritize, defend, and execute.
40%
Lower emergency repair spend achieved by preventive-first districts versus reactive peers — a benchmark every facility team can target within 12–18 months.
The Funding Reality
Why school maintenance budgets keep losing ground
U.S. K–12 districts spend roughly $50 billion annually on maintenance and operations — but facility needs are estimated at $85 billion, leaving a structural shortfall that compounds every year maintenance is deferred.
10%
Share of district budgets reaching facilities — far below the 7% benchmark already considered bare minimum by facility standards bodies.
$270B
Estimated deferred maintenance backlog across U.S. public schools, growing each year budgets are trimmed to protect classroom spend.
3×
Typical cost multiplier for emergency/reactive repairs versus planned preventive work on the same asset class.
14 yrs
Average age of U.S. school buildings — assets past their design midpoint need PM intensity, not less of it.
PM vs. Reactive Spend
Target the 60/40 ratio, not the 80/20 trap
Best-in-class facility teams aim for 60% of labor hours and dollars in preventive maintenance and only 40% in reactive — most underfunded districts sit inverted at 20/80, which is exactly why they feel broke.
| Budget Profile | PM : Reactive Ratio | Cost per Work Order | Downtime / Yr | Outcomes |
|---|
| Reactive (most underfunded districts) | 20 / 80 | $420 avg | 380+ hrs | Frequent overtime, asset churn, safety complaints |
| Mixed (average district) | 40 / 60 | $290 avg | 220 hrs | Predictable but still high emergency backlog |
| Preventive (best-in-class) | 60 / 40 | $150 avg | 90 hrs | Lower overtime, longer asset life, fewer disruptions |
| Predictive (rare, well-funded) | 70 / 30 | $110 avg | 40 hrs | Condition-based PM, minimal surprise failures |
The math is unforgiving: a district processing 2,500 work orders per year at $420 reactive cost is spending $1.05M. Shifting that same volume toward a 60/40 mix drops blended cost to roughly $246 per order — saving $435K annually without cutting a single task. That recovered funding can retire deferred-maintenance items, upgrade HVAC controls, or restore staffing.
High-ROI Reliability Moves
Five moves that pay back in under 12 months
You don't need a capital bond to move the needle. These five reliability upgrades typically return 3–7× their first-year cost in avoided emergency repairs, energy savings, and extended asset life.
01
Quarterly HVAC filter + coil program
A 120,000 sq ft school running quarterly coil cleanings and MERV-11 filter swaps cuts chiller runtime by 12–18% and avoids the $8K–$14K compressor replacements that hit reactive districts every summer.
ROI: 4–6×
02
CMMS-driven PM scheduling on life-safety assets
Tagging fire suppression, AEDs, elevators, and emergency lighting in a CMMS with auto-generated PM triggers reduces missed inspections to near-zero and protects against the $25K–$50K per-incident liability gap when an inspection lapses.
ROI: 5–8×
03
Boiler seasonal startups + teardowns
Documented fall startup and spring shutdown procedures extend boiler life from 18 to 25+ years and trim gas consumption 6–9%. A single emergency boiler replacement runs $60K–$120K — the PM labor is a rounding error by comparison.
ROI: 6–10×
04
Roof drain + gutter clearing cadence
Biannual roof inspections catch membrane defects before water intrusion. Roof replacements cost $12–$18 per sq ft; a $400 inspection catches the leak that prevents a $300K premature replacement.
ROI: 7–12×
05
Predictive vibration + IR scans on motors
A $1,200 infrared scan on electrical panels and a vibration route on supply fans catches bearing failures 30–90 days early. Bearing replacements run $600; a seized motor rewind is $4,500 plus downtime.
ROI: 3–5×
Deferred Maintenance Triage
Not every red tag is a fire — triage by risk, not by age
When the backlog hits $4M–$20M for a mid-sized district, trying to fix everything by age guarantees the wrong assets get funded. A risk-based triage frames each item by consequence and likelihood, so limited dollars flow to true safety and continuity threats first.
Life safety · code compliance · regulatory
- Failed fire dampers, sprinkler faults, AED battery lapses
- Locking hardware on egress doors not functioning
- Boiler pressure-relief valves out of test date
Operational continuity · high-cost failure risk
- Chiller / boiler over 20 yrs with rising repair frequency
- Roof sections with active membrane leaks
- Elevator controllers showing intermittent faults
Aging but functional · cosmetic · low-risk
- Flooring wear, paint, ceiling tile staining
- Parking lot crack-sealing and striping
- Non-critical signage and site furniture
Worked Example
A 12-school district with $6.2M deferred backlog
Facing flat funding, the facilities director triaged 240 open items: 28 Tier-1 safety items ($510K), 64 Tier-2 high-consequence items ($3.4M), and 148 Tier-3 manage-and-monitor items ($2.3M). By funding all Tier-1 immediately, sequencing Tier-2 over three years using a combination of operating budget and an energy performance contract, and deferring Tier-3 with documented re-inspection dates, the district cut emergency repair spend 31% in year one and avoided a single failed boiler replacement that would have cost $94K. The board kept facility funding intact because every deferred dollar had a defensible risk score attached.
Budget Defense Playbook
Make facilities the last budget line cut, not the first
When central office looks for cuts, maintenance is an easy target because its impact is invisible until something breaks. The fix is to translate every dollar of facility spend into academic, safety, and risk dollars the superintendent already cares about.
Quantify avoided cost, not just spend
Report "avoided $1.2M in emergency capital" alongside actual spend. Boards understand a 4:1 return faster than a PM completion percentage.
Tie PM to academic outcomes
Studies show classroom temperature and air quality correlate with 5–7% swings in student performance. Frame HVAC PM as an academic investment, not a facilities cost.
Show a 3-year deferred-maintenance curve
Graph the backlog with and without proposed funding. A line going from $6M to $11M in three years is the single most persuasive slide in a budget hearing.
Run a CMMS audit trail
When every work order, PM, and asset has a timestamped record, the facilities team looks disciplined. Auditors and board members trust data over anecdotes.
"The districts that keep their maintenance funding aren't the loudest — they're the ones who walk into budget season with a risk-ranked backlog, an avoided-cost number, and a CMMS report showing 94% PM completion."
Stop reacting. Start defending your maintenance budget with data.
OxMaint turns work orders, PMs, and asset histories into the reports your superintendent will actually read — and the dashboard that keeps your team ahead of failures.
Frequently Asked Questions
School maintenance budget questions, answered
What percentage of a school district's budget should go to facilities maintenance?
Industry benchmarks suggest 7–10% of total district operating spend should reach facilities, but most U.S. districts sit closer to 10% of total spend yet still fall short because the absolute dollar need is far higher. The more useful target is a Maintenance Cost Ratio of 1.0–1.5% of asset replacement value — that frames the conversation around the assets you actually own, not a generic percentage that ignores building age and condition.
How do I optimize a limited school maintenance budget without adding headcount?
Shift labor from reactive to preventive work — a 60/40 PM-to-reactive ratio typically frees 25–35% of technician hours that were being consumed by emergency calls. Combine that with CMMS-automated PM scheduling, quarterly HVAC and roof cadences, and a risk-ranked deferred-maintenance list so the highest-consequence assets get attention first. You can
start a free OxMaint trial to operationalize the scheduling and reporting immediately.
How should I prioritize a multi-million dollar deferred maintenance backlog?
Use a three-tier risk triage: Tier 1 covers life-safety and code-compliance items that must be funded immediately; Tier 2 covers high-consequence operational risks like aging chillers or leaking roofs, sequenced across 2–3 budget cycles; Tier 3 covers aging-but-functional and cosmetic items that can be deferred with documented re-inspection dates. Score every item by consequence and likelihood so the board sees a defensible ranking, not a wish list.
What's the fastest way to show ROI on a school maintenance software investment?
Track avoided emergency repair cost in the first 90 days. Most districts see a 15–25% drop in emergency work orders within one quarter of moving PM scheduling into a CMMS, because life-safety assets finally get inspected on cadence. Pair that with PM completion rate and mean time-to-repair to build a three-metric dashboard that translates directly into dollars saved.
Book a demo and we'll map the numbers to your district's asset count.
How do I keep maintenance from being the first budget line cut every year?
Reframe facilities spend in language the superintendent and board already use: avoided capital cost, academic performance impact of indoor air quality and temperature, regulatory and liability exposure, and a 3-year deferred-maintenance curve showing what happens if funding stays flat. Walk into budget season with a CMMS-generated audit trail, a risk-ranked backlog, and an avoided-cost number — the data does the defending for you.
Your Budget, Defended
Turn limited maintenance funding into measurable impact
Join the districts using OxMaint to cut emergency spend, defend their budgets with data, and give every asset the attention it deserves — without adding headcount.
Free 14-day trial · No credit card