School CapEx budgets are difficult to defend when the request is based on age, opinion, or last year’s spending. CFOs, school boards, and bond committees need credible data: which assets are failing, how much they cost to maintain, what condition they are in, and what happens financially if replacement is delayed. Without that proof, capital requests get pushed back, bond referendums lose confidence, and facility teams keep spending operating dollars on assets that should have been replaced years earlier. CMMS data changes the conversation. OxMaint turns work orders, repair history, asset condition scores, and lifecycle projections into 5–10 year CapEx forecasts that help districts build funding proposals with numbers instead of assumptions. If your district needs stronger capital planning evidence, start a free trial or book a demo to see how CMMS data builds a school CapEx budget.
How-to Guide · School CapEx Planning
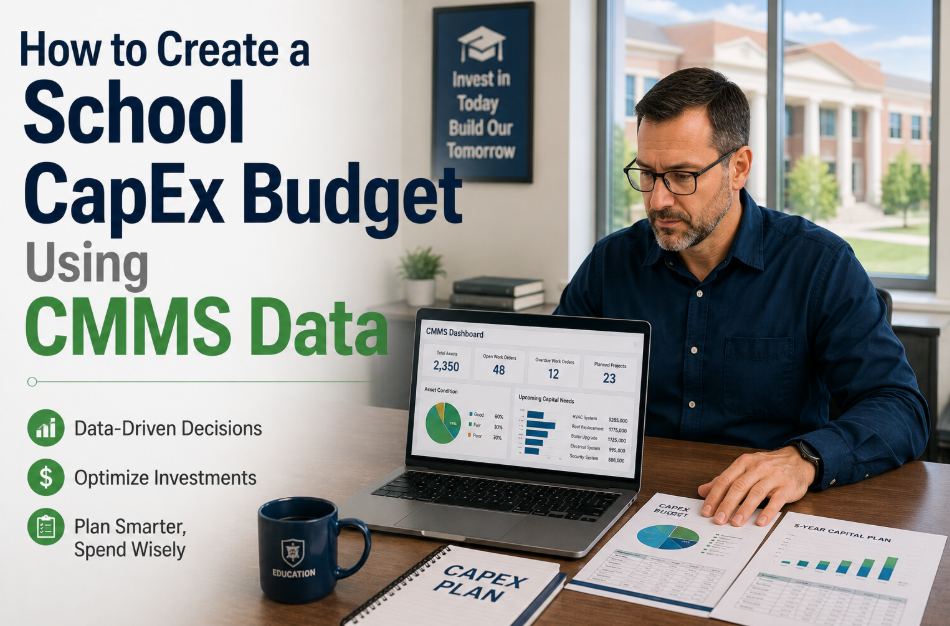
How to Create a School CapEx Budget Using CMMS Data
A practical framework for Directors of Facilities and CFOs to build school capital budgets using asset condition scores, maintenance cost history, lifecycle risk, and 5–10 year forecasting models.
Need Board-Ready Capital Data This Budget Cycle?
OxMaint helps districts convert maintenance records into replacement timelines, risk scores, and funding-ready reports. See how your top 50 assets translate into a 5-year capital plan.
5–10 yr
Forecast window districts need for credible capital planning
4.8x
Higher cost of emergency repairs compared with planned work
30–50%
Higher operating cost from poorly maintained buildings
60–80%
Of major facility risk often concentrated in critical assets
What Is a CMMS-Driven School CapEx Budget?
A CMMS-driven CapEx budget is a capital plan built from actual facility data instead of estimates. It uses asset age, repair frequency, condition scores, maintenance cost history, downtime risk, compliance exposure, and replacement cost to decide which assets should be funded first.
For school districts, this matters because capital requests compete with academic programs, staffing, transportation, technology, and security. A request for a $450,000 chiller replacement is much stronger when it shows 7 failures in 18 months, $82,000 in repairs, a 3/10 condition score, and a projected $140,000 emergency risk if replacement is delayed. OxMaint connects these data points into capital planning reports that facility and finance leaders can both trust. To turn your maintenance history into a school CapEx budget, start a free trial or book a demo.
The 6-Part Framework for Building a School CapEx Budget
A strong capital plan starts with asset truth. These six steps help districts move from scattered maintenance records to a funding proposal that boards and CFOs can evaluate with confidence.
Step 01
Create a capital asset inventory
Identify major assets by district, campus, building, system, asset, and component. Start with HVAC, roofs, boilers, chillers, elevators, electrical systems, fire systems, generators, and plumbing infrastructure.
Step 02
Score asset condition from 1–10
Use inspections, age, failure history, repair frequency, and technician input. A 3/10 asset with repeated failures should rank higher than a 15-year-old asset still performing reliably.
Step 03
Calculate maintenance cost history
Pull 12–36 months of work order costs by asset. Include labor, parts, contractor spend, emergency callouts, downtime impact, and repeat corrective work.
Step 04
Rank assets by risk and urgency
Prioritize assets based on safety, learning disruption, compliance exposure, energy impact, repair cost, and probability of failure within 12–24 months.
Step 05
Build a 5–10 year funding timeline
Spread replacements across budget years to avoid emergency spikes. Forecasting helps CFOs plan bond requests, capital reserves, and phased funding proposals.
Step 06
Prepare board-ready evidence
Translate facility data into charts, risk tiers, cost projections, photos, condition summaries, and replacement justifications that non-technical stakeholders can understand.
Why School Capital Requests Fail Without CMMS Data
Most weak capital proposals fail because the facility need is real but the evidence is incomplete. These are the six gaps that make boards hesitate, delay, or reduce funding.
Risk 01
Requests rely on age alone
Age matters, but it is not enough. A 22-year-old boiler with low repair cost may be less urgent than a 12-year-old unit failing every quarter.
Risk 02
Repair history is scattered
When costs live in invoices, emails, spreadsheets, and paper files, the district cannot prove the full financial burden of keeping an asset alive.
Risk 03
Condition scores are missing
Boards need a clear way to compare assets. A standard 1–10 condition score makes replacement priority easier to explain and defend.
Risk 04
Emergency risk is not quantified
If delaying replacement could trigger $90,000 in emergency repairs, that risk should be visible. CMMS history helps model cost of deferral.
Risk 05
Bond proposals lack credibility
Voters and boards question broad facility claims. Asset-level evidence improves trust because each request is tied to condition, cost, and risk.
Risk 06
Finance sees surprises too late
Emergency replacements disrupt budgets. A 5–10 year CapEx forecast gives finance time to prepare funding instead of reacting after failure.
How OxMaint Turns Maintenance Data into CapEx Forecasts
OxMaint helps facilities and finance teams work from the same evidence. Instead of presenting isolated repair stories, teams can show asset condition, lifecycle cost, and replacement timing across the full district.
Feature 01
Asset hierarchy for district portfolios
Organize assets by district, campus, building, system, asset, and component. Every repair and inspection connects to the correct capital asset.
Feature 02
Condition scoring
Track asset health with consistent scores. Low-scoring assets can automatically move into capital review when repair frequency or risk rises.
Feature 03
Maintenance cost history
See total cost by asset, building, system, work type, labor, parts, and contractor spend. This exposes assets consuming disproportionate budget.
Feature 04
5–10 year CapEx forecasting
Model replacement timing using age, condition, repair cost, failure history, and estimated replacement value across multiple budget years.
Feature 05
Board-ready reporting
Generate clear reports showing asset risk, recommended funding year, maintenance cost trend, and justification in language finance leaders understand.
Feature 06
Mobile inspection evidence
Technicians capture photos, notes, readings, and signatures during inspections so capital requests include field evidence, not just spreadsheet numbers.
OxMaint gives school leaders a repeatable process for turning daily maintenance activity into capital planning intelligence. If you need a stronger bond package or board funding proposal, start a free trial or book a demo.
Before vs. After: School CapEx Planning with CMMS Data
The difference between traditional capital planning and CMMS-driven forecasting is credibility. One depends on assumptions. The other shows evidence by asset, cost, condition, and risk.
| Planning Area |
Without CMMS Data |
With OxMaint CMMS Data |
| Asset Inventory |
Incomplete lists across spreadsheets and binders |
Centralized asset registry by district, campus, building, system, and component |
| Replacement Priority |
Based on age, complaints, and leadership pressure |
Based on condition score, repair history, safety risk, and cost trend |
| Maintenance Cost History |
Hard to assemble from invoices and work notes |
Automatically linked to each asset and available for reporting |
| Bond Justification |
Broad claims about aging infrastructure |
Asset-level evidence with photos, cost history, and failure risk |
| Budget Timing |
Emergency replacements create funding shocks |
5–10 year forecast spreads capital needs across planning cycles |
| Board Communication |
Technical explanations are difficult to validate |
Clear rankings, risk tiers, and cost projections improve decision confidence |
| Deferred Maintenance |
Hidden until failure or inspection crisis |
Visible as backlog, condition decline, and rising repair cost |
| Finance Alignment |
Facilities and finance work from different data |
Shared dashboards align facility need with funding strategy |
CapEx Planning Metrics Every District Should Track
A credible capital budget needs more than a replacement list. These four metrics help facilities and finance teams defend the timing and size of each funding request.
3/10
Condition score trigger for capital review
Assets at or below this level should be evaluated for repair-versus-replace decisions.
30%+
Annual repair-to-replacement cost threshold
If yearly repairs exceed 30% of replacement cost, capital replacement often deserves review.
12–36 mo
Maintenance history window
A strong proposal uses at least 1–3 years of cost and failure records to show trends.
5–10 yr
Capital forecast horizon
Long-range forecasting prevents emergency funding requests and supports bond planning.
90-Day Plan to Build a CMMS-Based CapEx Budget
You do not need every asset fully documented to begin. Start with the equipment most likely to create safety risk, learning disruption, or major unplanned expense.
Days 1–15
Identify top capital assets
Select the top 100–300 assets by replacement value and risk. Include HVAC, roofs, boilers, chillers, electrical systems, fire systems, elevators, and generators.
Days 16–30
Add condition scores
Use inspections, technician input, age, failure frequency, and visible deterioration to score each asset from 1–10.
Days 31–60
Attach cost history
Link work orders, labor, parts, contractor invoices, emergency callouts, and repeat repairs to each capital asset.
Days 61–90
Build the forecast
Rank assets by risk, assign recommended funding years, estimate replacement values, and create a board-ready 5-year capital plan.
Frequently Asked Questions
How does CMMS data improve a school CapEx budget?
CMMS data improves capital budgeting by connecting replacement requests to real maintenance evidence. Instead of requesting funds based only on age or opinion, districts can show repair history, labor cost, parts cost, emergency frequency, condition scores, inspection photos, and failure risk. This makes capital requests easier for CFOs, boards, and bond committees to evaluate.
What assets should be included in a school CapEx forecast first?
Start with high-value, high-risk facility assets: HVAC systems, roofs, boilers, chillers, elevators, generators, electrical distribution, fire safety systems, plumbing infrastructure, pumps, and building automation systems. These assets usually drive the largest maintenance costs and the highest disruption risk if failure occurs.
How far ahead should school districts forecast CapEx needs?
Most districts should maintain a rolling 5–10 year CapEx forecast. A 5-year view supports near-term budgeting and board planning, while a 10-year view helps with bond referendums, reserve planning, phased replacements, and long-term facility strategy.
Can OxMaint support school bond and board funding proposals?
Yes. OxMaint helps districts produce asset-level evidence for funding proposals, including condition scores, cost history, failure trends, inspection records, photos, and recommended replacement timelines. This gives boards and bond committees clearer proof of need and helps facilities teams defend capital requests with data.
Build a Capital Budget That Boards Can Trust
Capital funding decisions should not depend on guesswork. OxMaint gives Directors of Facilities and CFOs the CMMS data needed to prioritize replacements, defend bond requests, and forecast school facility needs over the next 5–10 years. Start with your highest-risk assets and turn maintenance history into a funding-ready capital plan.