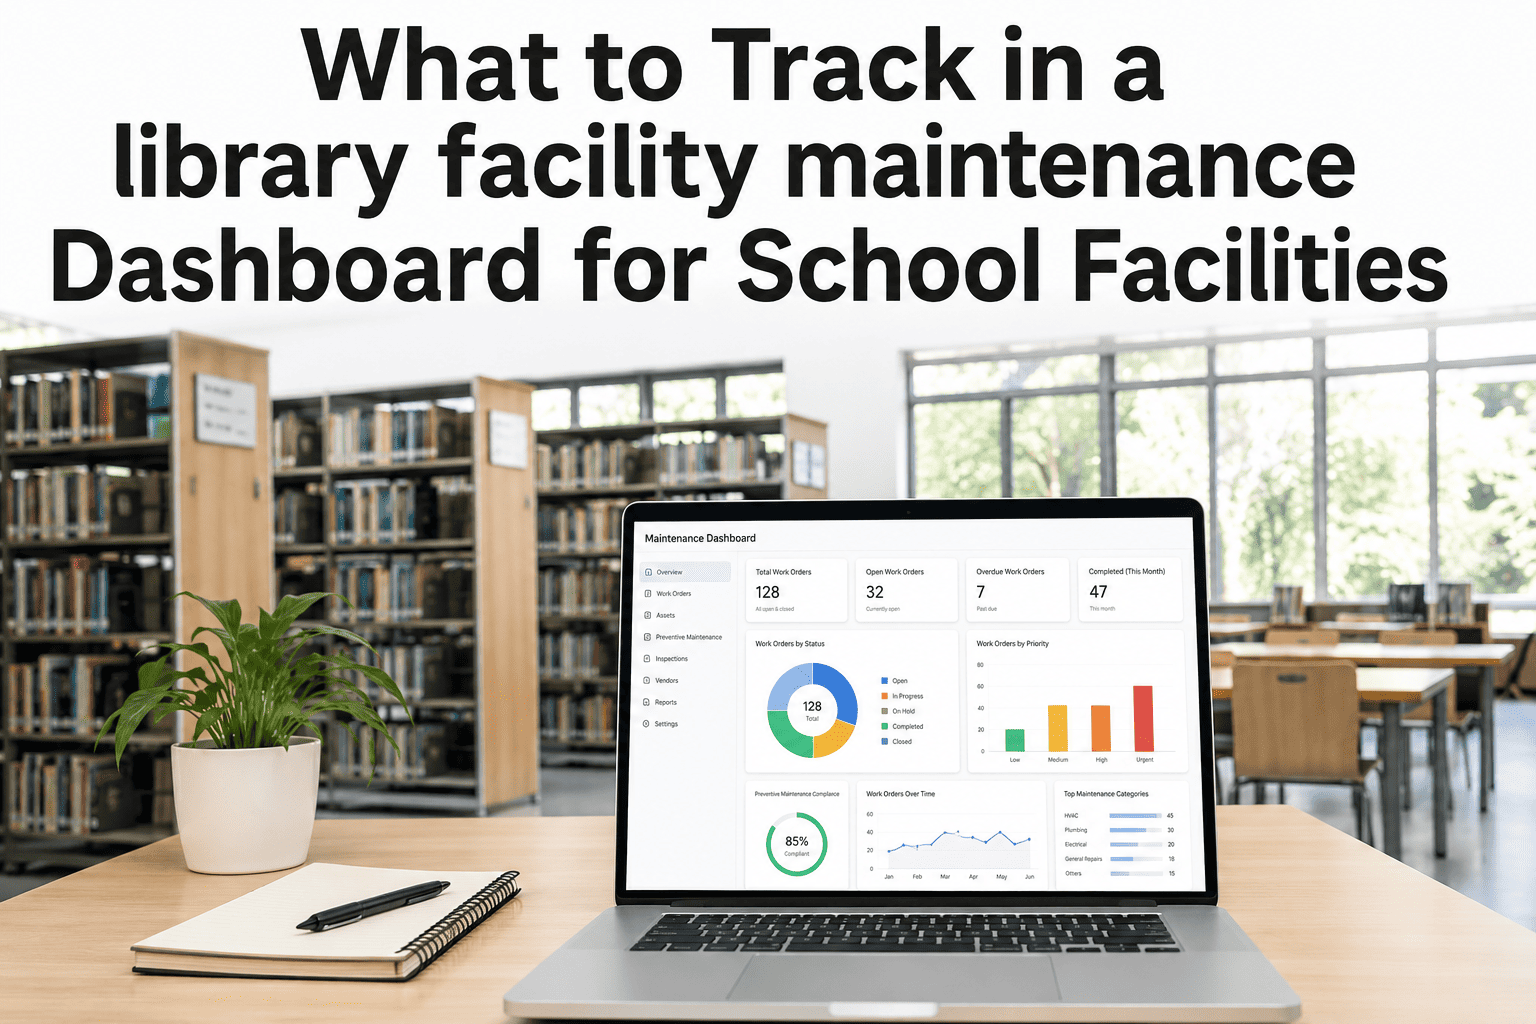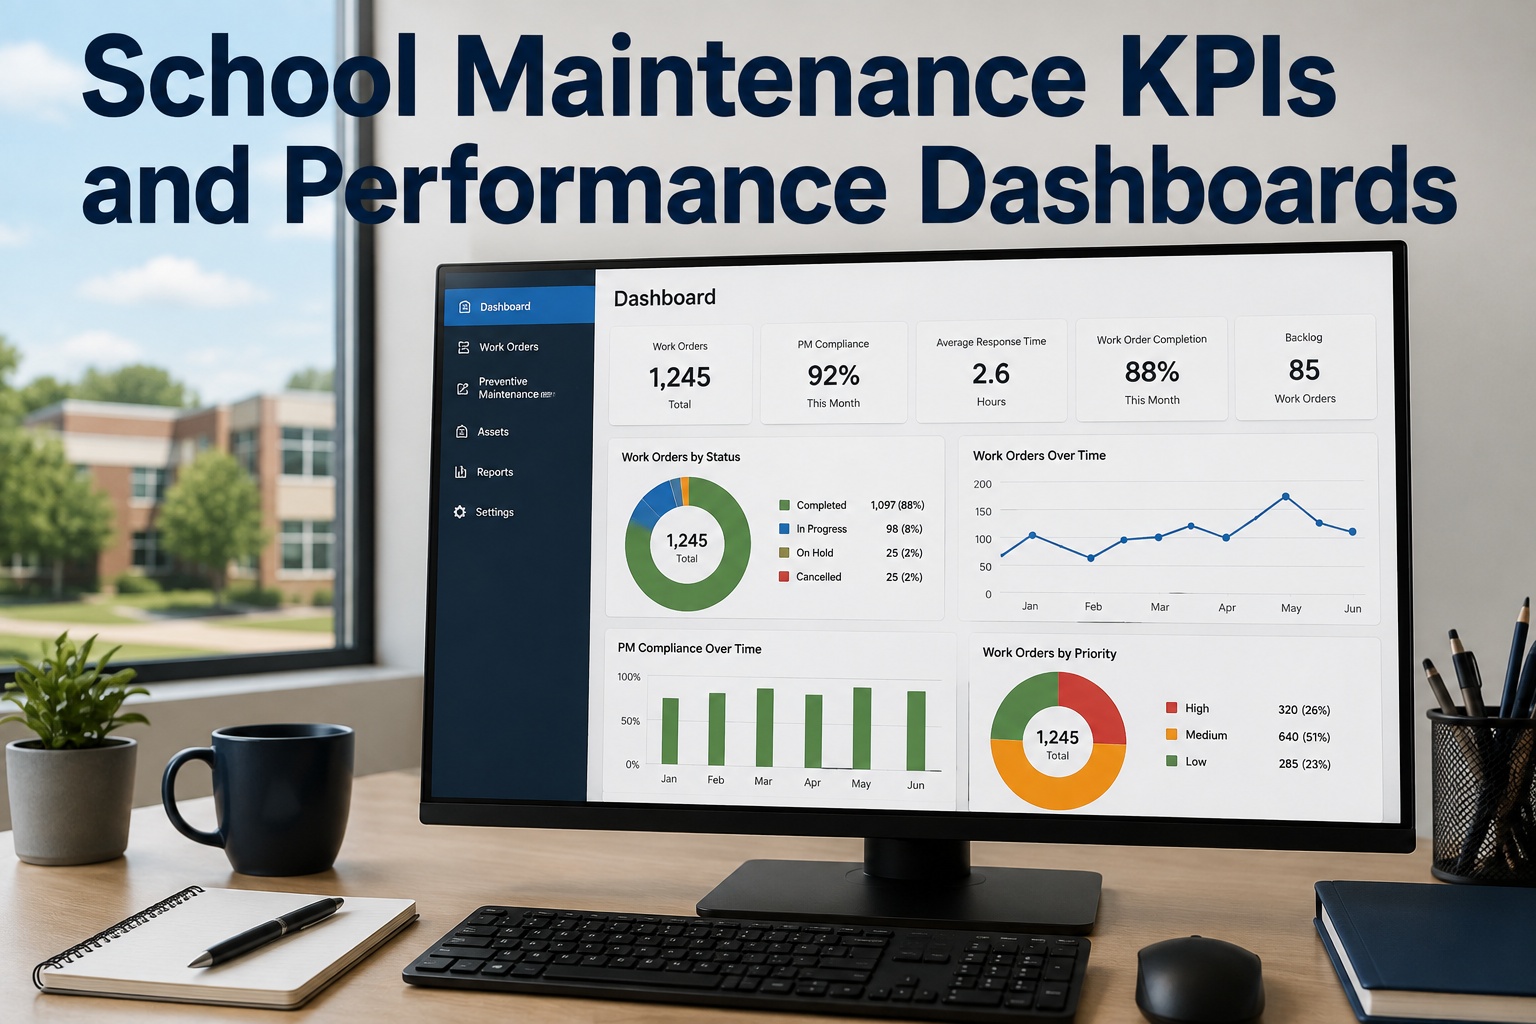
School maintenance KPIs are the measurable signals — PM compliance, work order age, response time, cost per square foot, and energy intensity — that tell a facilities director whether the campus is being maintained or merely reacted to. Without them, most school maintenance operations run on the loudest complaint, and budget requests get denied because there's no data to defend them. This guide breaks down the essential school maintenance metrics, how to build tiered performance dashboards, and the review cadence that turns numbers into actual reliability. If you're ready to stop guessing, you can Start Free Trial and see your own dashboard in days.
What gets measured gets funded. What doesn't, gets cut.
Most school facility teams track work in spreadsheets and inboxes — which means no response-time data, no PM compliance rate, and no cost-per-square-foot benchmark when the budget committee asks. Here's how to build a school maintenance KPI dashboard that changes the conversation.
The 5 essential school maintenance KPIs every facility dashboard needs
You don't need 40 metrics — you need five that a superintendent, a board member, and a lead technician can all read in 30 seconds. These are the school facility KPIs that correlate most directly with building reliability, budget defensibility, and student safety.
PM Compliance Rate
Percentage of scheduled preventive maintenance tasks completed on time. Below 80% means you're drifting reactive; above 90% means the plan is actually running. This is the single best predictor of future breakdowns.
Average Work Order Age
How long open work orders sit before completion. A rising average age signals understaffing or parts delays before the backlog becomes visible. Track it weekly by priority tier — emergency, urgent, routine.
Response Time
Time from request submission to technician acknowledgment. This is the KPI teachers and principals actually feel. Schools that measure it typically cut it 40–60% within a semester simply by making it visible.
Maintenance Cost per Square Foot
Total maintenance spend divided by gross square footage. The industry range for K-12 runs roughly $1.50–$3.00/sq ft annually depending on building age. This is the number that wins — or loses — budget hearings.
Energy Use Intensity (EUI)
kBtu per square foot per year. Poorly maintained HVAC systems drive EUI up 15–30%. Tracking EUI alongside maintenance activity proves that PM isn't a cost — it's an energy savings program.
Reactive vs. Planned Ratio
The percentage of work orders that are unplanned/reactive. Best-in-class school districts run 70%+ planned work. If you're above 50% reactive, every dollar is buying less than it should — reactive repairs cost 3–5x more than planned ones.
What a school maintenance KPI dashboard reveals in practice
Consider a mid-sized district: 8 schools, 620,000 sq ft, 4 technicians, $1.1M annual maintenance budget. Before dashboards, the facilities director described the operation as "busy." After 90 days of tracking, the data told a different story.
| Metric | Before Tracking | After 2 Semesters | What Changed |
|---|---|---|---|
| PM Compliance | Unknown (est. 55%) | 92% | Scheduled PMs auto-assigned weekly |
| Avg. Work Order Age | 19 days | 6 days | Backlog triaged by priority tier |
| Emergency Response Time | Not measured | 4.2 hours | Mobile alerts to nearest technician |
| Reactive Work % | ~70% | 38% | PM compliance pushed planned work up |
| Cost per Sq Ft | $1.77 (rising) | $1.58 (stable) | Fewer emergency callouts & overtime |
The budget impact: an 11% reduction in cost per square foot across 620,000 sq ft freed roughly $118,000 — enough to fund a fifth technician or a boiler replacement reserve. That's the argument a dashboard makes for you.
How to structure a maintenance KPI dashboard for schools: 3 tiers that work
One dashboard can't serve a technician, a facilities director, and a school board. The districts that succeed build three views from the same underlying data — each answering a different question.
Technician View — "What do I do today?"
Open work orders by priority, today's PM tasks, overdue items, and parts availability. Updated in real time, mobile-first, zero charts. This is the execution layer — if it's cluttered, it gets ignored.
Facilities Director View — "Are we on track?"
Weekly PM compliance, average work order age, backlog trend, response time by building, and reactive-vs-planned ratio. Reviewed every Monday in a 15-minute ops meeting. This is where staffing and scheduling decisions happen.
Board / Superintendent View — "Is the investment working?"
Quarterly cost per square foot, EUI trend, capital renewal backlog, and year-over-year comparisons. Three to five numbers, one page. This is the view that defends budgets and justifies bond measures.
The review rhythm that turns school maintenance metrics into performance
A dashboard nobody reviews is wallpaper. High-performing school facility teams run a fixed cadence — short, consistent, and tied to decisions. Here's the schedule that works:
Check assigned work orders and PM tasks on mobile. Flag blockers (parts, access, safety) before leaving for the first job.
Review PM compliance, work order age, and backlog trend. Reassign resources, escalate stalled jobs, adjust next week's schedule.
Analyze cost per square foot by building, reactive ratio, and energy intensity. Identify the worst-performing building and dig into root cause.
Present trend lines, not anecdotes. Show cost avoidance, EUI improvement, and capital needs — the numbers that unlock next year's budget.
How OxMaint turns school maintenance KPIs from spreadsheet chores into live dashboards
Every KPI in this guide requires clean, continuous data — which is exactly what spreadsheets and paper work orders can't produce. OxMaint captures it automatically as your team works, then builds the dashboards for you.
Automated PM Scheduling & Compliance Tracking
Recurring PMs auto-generate and auto-assign by asset, building, or technician. Compliance rate is calculated live — no manual tallying. Districts typically move from ~55% to 90%+ within one semester.
Real-Time Work Order Aging & Response Metrics
Every work order is timestamped from submission to close. Average age, response time, and backlog by priority update continuously — so you see a problem building weeks before it becomes a crisis.
Cost-per-Sq-Ft & Budget Analytics
Labor, parts, and contractor costs roll up by building, asset, or district. Generate the one-page board report in minutes instead of assembling it from three spreadsheets over a weekend.
Mobile-First Technician View
Technicians see today's work orders, PM checklists, and asset history on their phone — no paper, no radio calls, no end-of-day data entry. Adoption is the #1 reason school CMMS rollouts fail; OxMaint is built to be used.
See your school's KPIs on a live dashboard — in 30 minutes
Book a demo and we'll build a sample dashboard with your buildings, your assets, and your KPIs — so you can see exactly what your board report would look like.
School maintenance KPIs: frequently asked questions
What are the most important maintenance KPIs for schools?
The five that matter most are PM compliance rate, average work order age, emergency response time, maintenance cost per square foot, and energy use intensity (EUI). Together they cover reliability, responsiveness, cost efficiency, and building performance — the four things boards and superintendents actually ask about.
What is a good PM compliance rate for a school district?
Aim for 90% or higher on-time completion. Below 80% means preventive tasks are being skipped and the operation is drifting reactive — which costs 3–5x more per repair. Most districts that start tracking discover they're at 50–65%, which is normal and fixable within one or two semesters.
How much should a school spend on maintenance per square foot?
K-12 facilities typically spend $1.50–$3.00 per square foot annually on maintenance and operations, depending heavily on building age and deferred maintenance backlog. The number matters less than the trend — a rising cost per square foot with a rising reactive ratio means you're paying more for worse outcomes. Start Free Trial to benchmark your buildings automatically.
How do I build a maintenance dashboard for my school without a big IT project?
You don't build one — you adopt a CMMS that generates it from daily work. When technicians close work orders on a mobile app, every KPI (compliance, aging, response time, cost) populates automatically. A 30-minute demo shows you a live dashboard with sample school data before you commit to anything.
How often should school maintenance KPIs be reviewed?
Daily at the technician level (5 minutes, work queue only), weekly at the director level (15 minutes, compliance and backlog), monthly for cost and trend analysis, and quarterly for board reporting. Consistency matters more than depth — a 15-minute weekly review beats a 2-hour monthly one that keeps getting postponed.
Stop defending your budget with anecdotes
OxMaint gives your school district live KPI dashboards — PM compliance, work order aging, cost per square foot — built automatically from the work your team is already doing.
Free 14-day trial · No credit card · Set up in under an hour