Higher education facilities directors are under more scrutiny than ever. Boards want data. Accreditors want documentation. Sustainability officers want energy numbers. And deferred maintenance backlogs across U.S. universities now exceed $112 billion — a figure that makes every capital budget conversation a high-stakes negotiation. The directors who win those conversations walk in with KPI dashboards, not anecdotes. They track Facility Condition Index scores, PM compliance rates, energy use intensity, and custodial APPA levels — and they use those numbers to defend budgets, justify headcount, and prioritize capital projects. If your facilities team is still reporting in narrative form, you are leaving budget dollars and strategic credibility on the table. Platforms like Oxmaint's higher ed CMMS give facilities directors real-time access to every KPI on this list — automatically tracked, dashboard-ready, and exportable for board presentations. Want to see how it works? Start a free trial or book a demo with our team today.
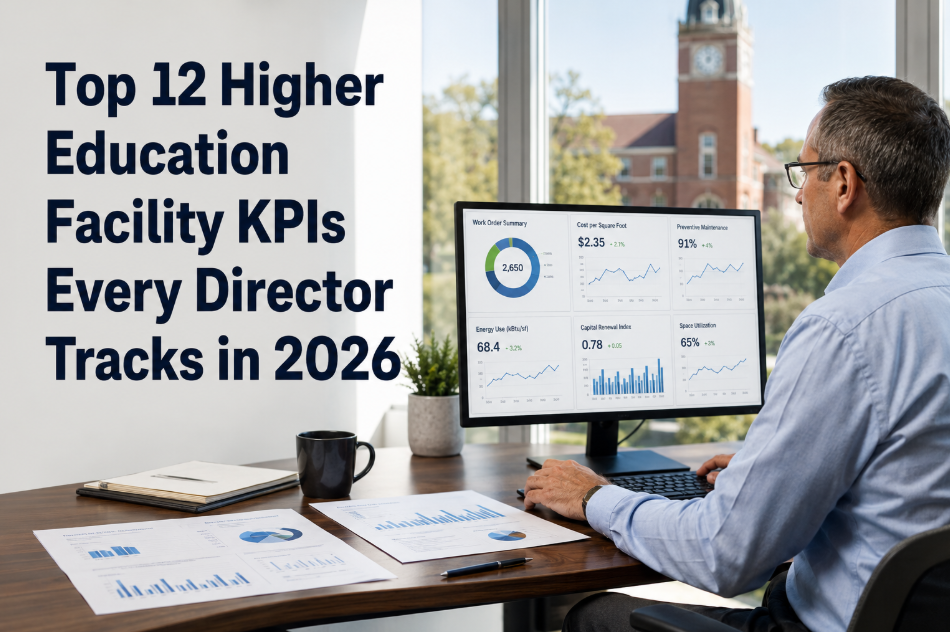
Top 12 Higher Education Facility KPIs Every Director Tracks in 2026
The metrics that defend budgets, justify capital requests, and prove operational excellence to boards, accreditors, and sustainability committees — all in one reference guide.
Why KPIs Are Now Non-Negotiable in Higher Ed Facilities
University facilities teams manage some of the most complex built environments on earth — research labs, dormitories, sports complexes, dining halls, historic buildings, and utility plants — often across hundreds of acres and dozens of buildings. The operational complexity is matched only by the stakeholder scrutiny: boards demand fiscal accountability, accreditors assess environmental health and safety, sustainability officers chase carbon targets, and state legislatures tie funding to performance metrics.
In this environment, a facilities director who reports in narrative form — "we fixed a lot of HVAC units this quarter" — is at a structural disadvantage compared to one who walks in with a dashboard showing FCI scores by building, PM compliance trending up to 91%, and deferred backlog reduced by $2.4M. The 12 KPIs below are what the best-performing higher ed facilities teams track — and what Oxmaint surfaces automatically. Start a free trial or book a demo to see your own dashboard come to life.
The 12 KPIs Every Higher Ed Facilities Director Tracks
Each KPI below includes a benchmark range, what it measures, and how Oxmaint automates its tracking.
FCI = Deferred Maintenance Cost divided by Current Replacement Value. It is the single most universally recognized measure of building health. Boards use it. Accreditors reference it. Capital planners build 10-year forecasts from it. Oxmaint calculates FCI automatically from your asset condition scores and deferred work order backlog, producing building-level and portfolio-level FCI without manual calculation.
PM compliance measures the percentage of scheduled preventive maintenance tasks completed on time. Below 70%, deferred PMs accumulate into a backlog that compounds equipment deterioration and emergency repair costs. At 90%+, facilities operate in a proactive regime — failures become rare events rather than weekly crises. Oxmaint schedules PMs against academic calendar constraints, auto-assigns technicians, and flags overdue tasks in real time.
Deferred maintenance is not just an operational problem — it is a capital liability. U.S. universities average $50–$100 per square foot in deferred maintenance backlog. Each year a repair is deferred, its cost grows by 10–15% as secondary damage accumulates. Tracking backlog in dollar terms — not just work order count — gives boards a number they can act on. Oxmaint's backlog reporting shows aging by building, system type, and priority level.
EUI measures energy consumption per square foot per year — the standard metric for campus sustainability reporting and ENERGY STAR benchmarking. It is also a leading indicator of HVAC and building envelope maintenance health. Universities with strong PM programs consistently track 15–25% lower EUI than peer institutions. Oxmaint links maintenance activity to energy performance, surfacing correlations between PM completion rates and energy cost trends.
MTTR tracks the average time from work order creation to repair completion. In higher ed, slow MTTR means classrooms out of service, lab environments compromised, and occupant complaints escalating to the provost's office. CMMS-driven dispatch, parts visibility, and technician routing cut MTTR by 40–60% compared to phone-and-paper workflows. Oxmaint timestamps every stage of the work order lifecycle.
The APPA Level of Service scale (1–5) standardizes custodial performance assessment across higher education — Level 1 being pristine, Level 5 being unkempt. Tracking APPA levels by zone and building allows directors to demonstrate custodial service quality to administration with objective data rather than subjective reports. Oxmaint's digital inspection forms capture APPA-aligned scores during custodial rounds.
The backlog ratio compares total open work orders to the team's weekly capacity — expressed in weeks of work outstanding. A 2–4 week backlog indicates healthy throughput. Beyond 8 weeks, deferred repairs age into more expensive failures. This KPI helps directors make the staffing or contractor case to administration: "We have 11 weeks of backlog and 6-week capacity — we need 2 additional technicians or 200 contractor hours."
This ratio reveals how much of your maintenance spend is invested in prevention versus firefighting. Each percentage point shift from reactive to planned saves approximately $3–$5 per square foot annually in higher ed environments. Tracking this ratio monthly shows the trajectory of your maintenance program maturity. Oxmaint classifies every work order as planned or reactive automatically, producing the ratio without manual categorization.
Uptime rate tracks the percentage of time critical assets — HVAC chillers, boilers, elevators, emergency generators, lab equipment — are fully operational. For research universities, a chiller failure during a grant-funded experiment can destroy months of work. For student housing, a failed boiler in January is a crisis. Uptime KPIs by building system allow directors to direct preventive investment to the highest-risk assets first.
Cost per square foot is the universal benchmark for comparing facilities performance across peer institutions, APPA survey data, and year-over-year internal trends. It breaks down total maintenance spend — labor, parts, contractors — by building area to identify outlier buildings consuming disproportionate resources. Directors use it to justify decommissioning decisions, renovation investment, and staffing levels. Oxmaint produces this metric automatically from work order cost data.
Fire suppression inspections, emergency lighting tests, elevator certificates, fume hood certifications, and air quality monitoring are not optional — they are regulatory requirements with legal liability attached. Tracking compliance rates for life safety and IAQ PMs separately from general maintenance ensures zero items fall through. In states with strict building safety codes (California, New York, UK HSE standards), a missed fire suppression test can trigger facility closure orders.
Capital Renewal Funding Ratio measures annual capital reinvestment against the campus's total current replacement value. Industry guidance recommends 2–4% of CRV annually to prevent backlog growth. Most universities fund 0.5–1.5% — a chronic underfunding that explains the $112B national backlog. Tracking this ratio gives directors the precise funding gap number for board presentations: "We need $18M annually; we received $7M — the gap is driving FCI deterioration in our oldest buildings."
KPI Performance Benchmarks at a Glance
How does your institution stack up? This table shows the spread across higher ed facilities programs — and where CMMS-driven teams consistently land.
| KPI | Manual Tracking Average | CMMS-Driven Average | Top Quartile |
|---|---|---|---|
| FCI Score | 0.28 (Fair–Poor) | 0.14 (Fair) | 0.07 (Good) |
| PM Compliance Rate | 42% | 78% | 94% |
| Planned Maintenance Ratio | 38% planned | 63% planned | 84% planned |
| MTTR (Critical Assets) | 18 hours | 9 hours | 4 hours |
| Maintenance Cost/sq ft | $19.40 | $13.80 | $9.20 |
| Energy Use Intensity (EUI) | 198 kBtu/sq ft | 155 kBtu/sq ft | 97 kBtu/sq ft |
| Life Safety Compliance | 81% | 96% | 100% |
| Asset Uptime (Critical Systems) | 91% | 96% | 99% |
Why Most Higher Ed Facilities Teams Struggle With KPI Tracking
The data exists — it is just buried in spreadsheets, work order printouts, and disconnected systems that were never designed to talk to each other.
Each building often has its own maintenance log, spreadsheet, or legacy system. Rolling up FCI or cost-per-square-foot across a 200-building campus becomes a manual, error-prone quarterly exercise.
By the time KPIs are manually compiled, the data is 4–6 weeks old. Directors make capital decisions based on lagging information, missing trend shifts before they become expensive failures.
At 67% of institutions, PM compliance is estimated rather than measured. Without a system that timestamps completion against schedule, the actual compliance rate is unknown — and almost always lower than assumed.
Work order counts tell you how many things are deferred — not what they cost to fix now versus later. Boards respond to dollar figures, not task counts. Without dollar-denominated backlog, capital requests lack the evidence needed to secure funding.
Life safety and IAQ compliance records are often assembled in the weeks before an accreditor visit — a process consuming 150–300 staff hours. Missing records from years prior are often discovered only during this frantic compilation.
Sustainability officers track EUI in one system; facilities tracks HVAC maintenance in another. The correlation — that a 15% drop in PM compliance predicts a 12% rise in energy intensity — is invisible without integration.
How Oxmaint Turns These 12 KPIs Into a Live Dashboard
Oxmaint's higher ed CMMS is built to surface every KPI on this list — automatically, in real time, without manual compilation. Here is how each capability maps to the metrics that matter.
Every asset is logged with condition score, replacement cost, and installation date. FCI and Capital Renewal Ratio are calculated automatically — no spreadsheet, no manual formula.
PMs are scheduled around class schedules, exam periods, and semester breaks — not just calendar intervals. Compliance rate climbs because maintenance happens when it should, not when it is convenient.
Labor hours, parts, and contractor costs are captured per work order and rolled up by building. Cost-per-square-foot is always current — not a quarterly estimate.
Every open work order carries an estimated cost. Oxmaint aggregates these into a live deferred backlog dollar figure — broken down by building, priority, and aging — ready for board presentations on demand.
Life safety and IAQ PMs are tagged as mandatory compliance items. Overdue alerts go to the director and compliance officer automatically. Compliance reports are generated on demand — not assembled pre-audit.
Roll up every KPI from individual assets to buildings to the full campus portfolio. Export board-ready PDF reports showing FCI trends, PM compliance progress, energy intensity, and backlog reduction — all in one click.
Technicians complete work orders, log APPA custodial scores, and capture photos on mobile — including offline in basement mechanical rooms. MTTR data is captured without any extra paperwork step.
Asset condition scores and replacement cost data feed directly into rolling 5-year capital forecasts. Directors present funding gap analyses to boards with asset-level data backing every line item — not estimates.
Manual Tracking vs Oxmaint: The Real Difference
This is what KPI reporting looks like before and after implementing a CMMS built for higher education.
What Institutions Achieve With KPI-Driven Facilities Management
Frequently Asked Questions
How often should higher ed facilities teams report on these KPIs?
What is a realistic FCI improvement timeline after implementing a CMMS?
Can Oxmaint integrate with existing university ERP systems like Banner, Workday, or SAP?
How do we build the case internally to get a CMMS approved by administration?
Stop Estimating. Start Tracking Every KPI in Real Time.
Your institution's FCI, PM compliance rate, deferred backlog, and cost-per-square-foot data already exists — it is just scattered across spreadsheets, paper logs, and disconnected systems. Oxmaint brings every KPI on this list into a single live dashboard, with board-ready reporting built in. Most higher ed facilities teams are up and tracking within their first week.