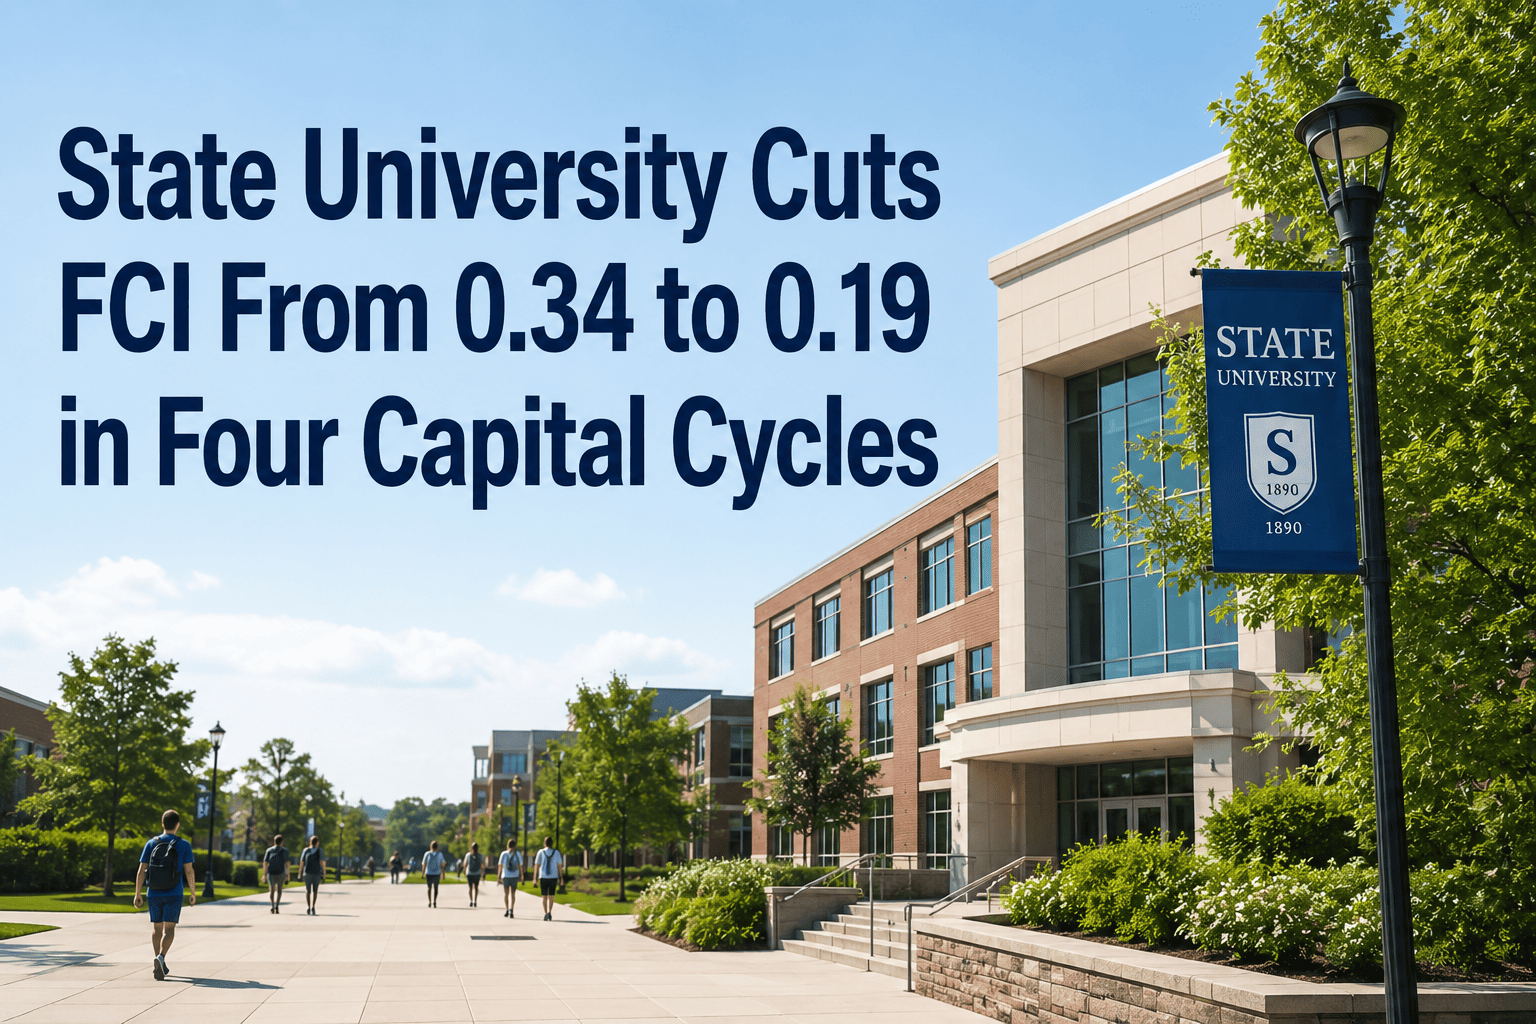
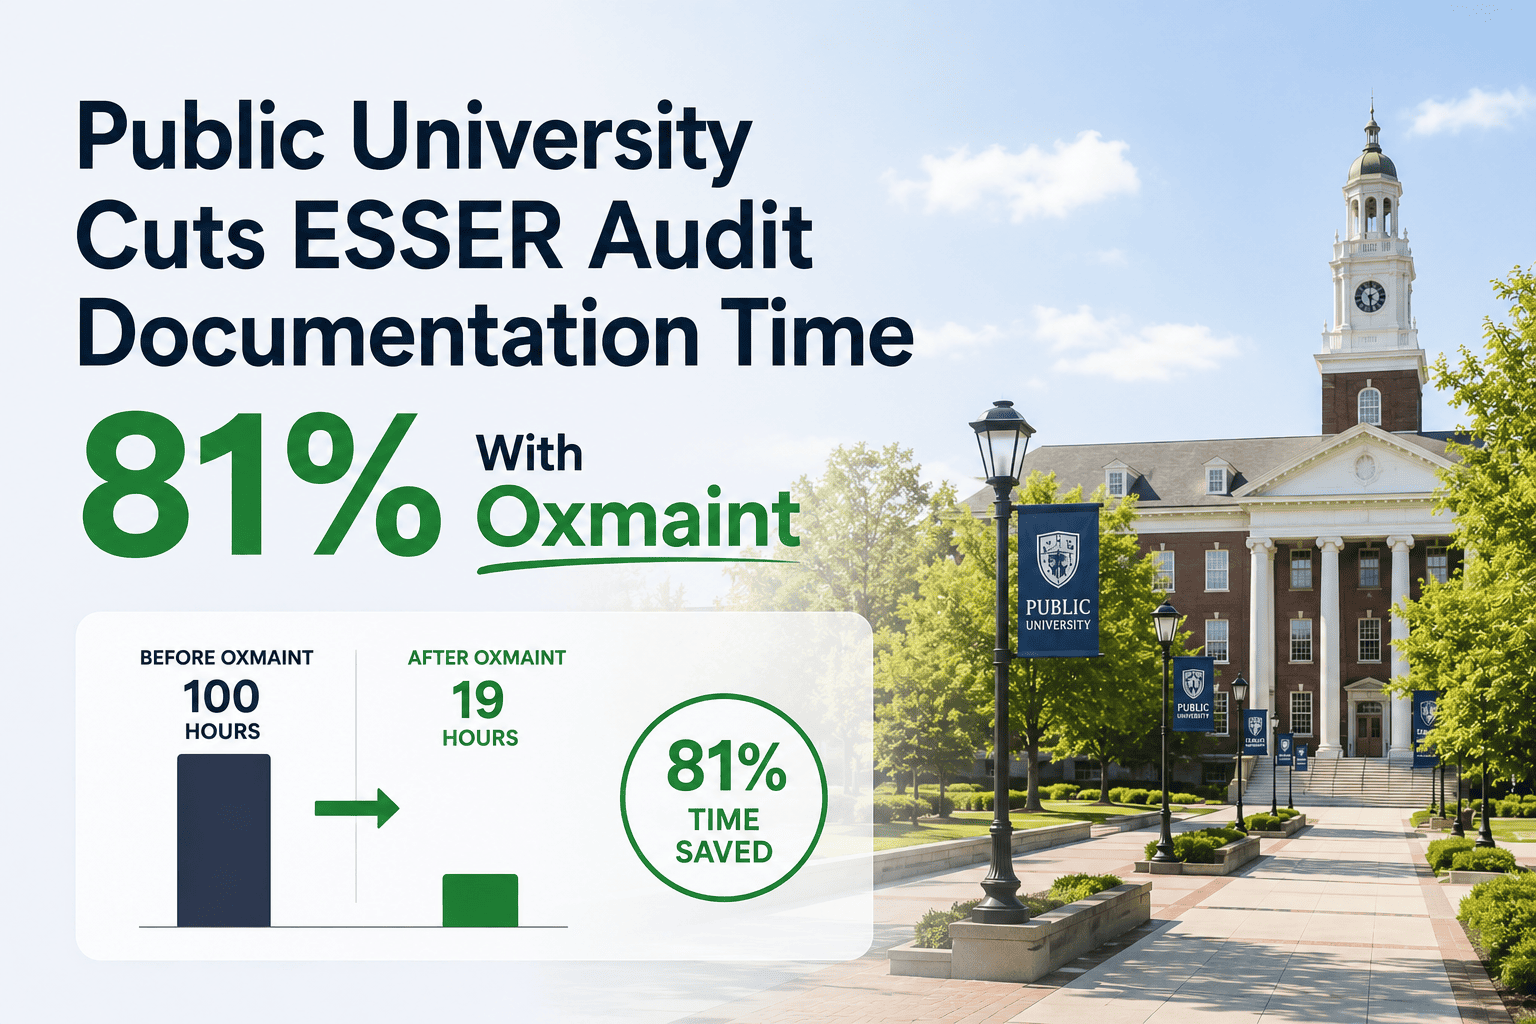
A mid-size state university carrying 6.8 million gross square feet across 94 buildings opened fiscal year one with a Facilities Condition Index of 0.34 — a number that told the board of trustees it had a deferred maintenance liability larger than two years of its total capital budget. The number was real, but it was useless for decision-making: no one could say which buildings were driving it, which deficiencies were accelerating, or how a dollar invested in one structure compared to the same dollar invested in another. Capital requests were written from memory and inspection anecdotes, scored by seniority of the requestor as much as by condition data, and approved — or rejected — without a defensible evidence base. Four capital planning cycles later, the same university carries an FCI of 0.19. The reduction did not come from a one-time infusion of deferred maintenance funding. It came from replacing estimation with evidence. Oxmaint's asset condition tracking, inspection management, and capital planning dashboards gave the facilities division the data infrastructure to turn each capital cycle into a measurable step toward a sustainable portfolio. Sign Up Free to start building your facility condition baseline today.
From FCI 0.34 to 0.19 — Four Capital Cycles, Verified by Data
See how Oxmaint turns condition inspections into evidence-based capital asks that boards approve.
The Challenge: A $340M Liability No One Could Prioritize
0.34
Opening FCI — classified as "poor" condition by industry benchmarks
$340M
Estimated deferred maintenance backlog at baseline — spread across 94 buildings
0 of 94
Buildings with current, digitized condition records in a CMMS at program start
$0
Verifiable ROI data available to support any of the prior cycle's capital requests
The university's capital planning process had three structural problems that no amount of budget could fix on its own. First, condition data lived in paper inspection binders and personal spreadsheets — it was fragmented, undated, and non-comparable across buildings. Second, there was no systematic link between inspection findings and work order history: a roof that had absorbed five emergency repairs over six years looked identical on paper to a roof that had never been touched. Third, capital requests competed without a shared scoring framework. A dean who advocated loudly for a humanities building could displace a quietly deteriorating mechanical system in a research facility — because no one had the data to prove which risk was larger. When the university engaged Oxmaint, the goal was not simply to digitize what already existed. It was to build a condition data infrastructure that made each capital cycle smarter than the last.
The Solution: Oxmaint as the Condition Data Layer
01
Asset Registry and Condition Baseline
Every major building system — roofing, envelope, mechanical, electrical, plumbing, life safety, and finishes — was entered as a discrete asset in Oxmaint with install year, expected useful life, replacement value, and initial condition score. The 94-building portfolio produced 1,840 tracked asset records in the first 90 days.
02
Structured Inspection Management
Oxmaint's inspection management module replaced paper walk-throughs with standardized digital checklists mapped to each asset class. Inspectors completed condition assessments on mobile, captured photo documentation, and scored each system on a consistent 1–5 scale. Results fed directly into asset records — creating a time-stamped, auditable condition history for every system across the portfolio.
03
Work Order Integration with Asset History
Corrective and preventive work orders were linked to asset records in Oxmaint, so every repair cost, labor hour, and parts expenditure became part of the asset's lifetime maintenance record. For the first time, capital planners could see total cost of ownership by system — not just replacement cost.
04
FCI Dashboard and Capital Prioritization
Oxmaint's analytics and reporting module calculated building-level and portfolio-level FCI dynamically as inspection data updated. Capital planners could filter by FCI band, asset class, building age, or renewal year — and export a ranked list of deficiencies with replacement cost, condition score, and maintenance history attached to each line item.
Implementation: Four Capital Cycles, Each Sharper Than the Last
Cycle 1
Build the Baseline (Year 1)
The first cycle focused entirely on data collection. Facilities staff used Oxmaint's mobile inspection app to complete condition assessments on all 94 buildings over 14 weeks. The resulting FCI calculation — 0.34 — was the first portfolio-level number the university had ever produced from actual inspection data rather than engineering estimates. Capital requests for the first cycle were scored against this baseline: the 11 buildings with FCI above 0.45 were prioritized, and three systems with imminent life-safety implications were fast-tracked regardless of building FCI. Total capital deployed: $28.4M. Work orders for approved projects were created and tracked in Oxmaint from award through closeout.
Cycle 2
Measure the Impact (Year 2)
Year two introduced re-inspection of all buildings where capital work had been completed — the first time the university could verify that investment had actually moved condition scores. Oxmaint's inspection history showed an average FCI improvement of 0.06 in the 11 prioritized buildings. This data became the proof-of-concept that unlocked additional capital: the board approved a 12% increase in facilities capital allocation based on demonstrated FCI movement per dollar invested. Portfolio FCI moved from 0.34 to 0.29. Capital deployed: $31.8M.
Cycle 3
Predictive Prioritization (Year 3)
With two years of inspection data and work order history in Oxmaint, the facilities team began using asset age curves and maintenance cost trends to identify systems approaching end of useful life before condition scores fell into the critical range. Preventive replacements — executed before failure — cost an average of 34% less than reactive replacements in the prior two cycles. Fourteen mechanical systems were replaced in year three that would have reached critical condition by year five, avoiding an estimated $4.1M in emergency and reactive premium costs. Portfolio FCI moved from 0.29 to 0.24. Capital deployed: $29.2M.
Cycle 4
Portfolio Optimization (Year 4)
By cycle four, the university had a four-year condition history for every asset in the portfolio. Capital planners used Oxmaint's analytics to model FCI trajectory under three funding scenarios, presenting the board with a clear cost curve: the per-FCI-point improvement cost was declining each cycle as reactive spend dropped and preventive spend increased. The board approved the highest capital allocation in the university's history — $38.6M — based on a 10-year FCI projection model built entirely from Oxmaint data. Portfolio FCI reached 0.19 at fiscal year close.
Results: Four Cycles of Verified FCI Progress
0.34
→
0.19
Portfolio FCI — baseline to end of cycle four
$340M
→
$189M
Deferred maintenance backlog — $151M liability retired in four cycles
$0
→
$4.1M saved
Reactive repair premium avoided in cycle three alone through predictive scheduling
Estimated
→
Verified
Capital ROI reporting — every project now closes with measured FCI impact in Oxmaint
Key Business Impact
| Area |
Before Oxmaint |
After Four Cycles |
Impact |
| Portfolio FCI |
0.34 (poor) |
0.19 (fair — approaching good) |
44% FCI reduction |
| Condition data coverage |
0 of 94 buildings digitized |
94 of 94 — 1,840 asset records current |
Full portfolio visibility |
| Capital request scoring |
Advocacy-based, no shared framework |
FCI-ranked, data-scored, board-ready exports |
Defensible, auditable prioritization |
| Reactive maintenance share |
~61% of maintenance spend |
~38% of maintenance spend |
23-point shift toward planned work |
| Capital allocation growth |
Flat — no data to justify increases |
+36% over four cycles |
Verified ROI per cycle unlocked additional board commitment |
| Emergency repair cost |
High — untracked, unplanned |
$4.1M avoided in cycle three alone |
Predictive scheduling replaced reactive premiums |
We used to walk into the capital committee with a spreadsheet and a prayer. Now we walk in with four years of condition history, a ranked deficiency list, and a ten-year FCI model. The board does not debate the list anymore — they debate the funding level.
— Associate Vice President for Facilities, State University
Build a Capital Program Your Board Will Approve Every Cycle
Oxmaint gives facilities teams the condition data infrastructure to move FCI systematically — not accidentally. Book a Demo to see how it works for a university portfolio.
Frequently Asked Questions
What is a Facilities Condition Index and what does an FCI of 0.34 mean?
FCI is the ratio of deferred maintenance cost to current replacement value. An FCI of 0.34 means deferred maintenance equals 34% of replacement value — industry benchmarks classify this as "poor." Most capital planning frameworks target an FCI below 0.10 (good) for a well-maintained portfolio.
Sign Up Free to start calculating your building-level FCI in Oxmaint.
How does Oxmaint calculate FCI for a multi-building university portfolio?
Oxmaint calculates FCI dynamically from inspection condition scores, asset replacement values, and work order cost data. Each completed inspection updates the asset condition record; Oxmaint aggregates those records into building-level and portfolio-level FCI that updates in real time as work is completed and new inspections are logged.
How long does it take to complete a baseline condition assessment for 90+ buildings?
This university completed its 94-building baseline in 14 weeks using existing facilities staff and Oxmaint's mobile inspection app. Scope and team size determine timeline — smaller portfolios typically complete a baseline in 4–8 weeks.
Book a Demo for a deployment timeline estimate specific to your campus.
Can Oxmaint support the APPA or APPA FPI condition rating frameworks used in higher education?
Yes. Oxmaint's inspection checklists are configurable to map to APPA condition categories, FCI bands, or any custom rating scale your institution uses. Output reports can be formatted to align with APPA reporting requirements and state facilities reporting mandates.
Does Oxmaint integrate with existing BAS, ERP, or financial systems?
Oxmaint supports integration with SAP, accounting software, and other enterprise systems. Capital project costs tracked in financial systems can sync with Oxmaint asset records — keeping total cost of ownership data current without manual re-entry.
Sign Up Free to explore integration options for your environment.
How does Oxmaint help justify capital budget increases to university boards and trustees?
Oxmaint's analytics module produces board-ready FCI trend reports, deficiency ranking exports, and cost-per-FCI-point ROI calculations. Each capital cycle closes with verified before/after condition data — giving facilities leadership documented evidence of return on investment that supports requests for sustained or increased capital allocation.
Your FCI Has a Number. Make It Move.
Oxmaint gives higher education facilities teams the asset condition tracking, inspection management, and capital prioritization data to reduce FCI systematically — one verified cycle at a time.