University facilities teams face a persistent challenge: turning thousands of asset inspection records into a defensible capital plan that administrators, boards, and accreditors will trust. The Facility Condition Index (FCI) is the industry-standard metric for this — it quantifies deferred maintenance as a ratio of repair cost to replacement value, giving every building and asset a score that drives 5-year capital forecasting. But most institutions still build their FCI models in disconnected spreadsheets, without the asset history, PM records, or replacement cost data needed to make those scores accurate. When capital plans are built on unreliable FCI scores, funding requests get denied, critical repairs get deferred another cycle, and facilities leadership loses credibility with finance. Sign Up Free to see how Oxmaint structures asset condition data into audit-ready FCI reports, or Book a Demo to walk through a university facilities use case.
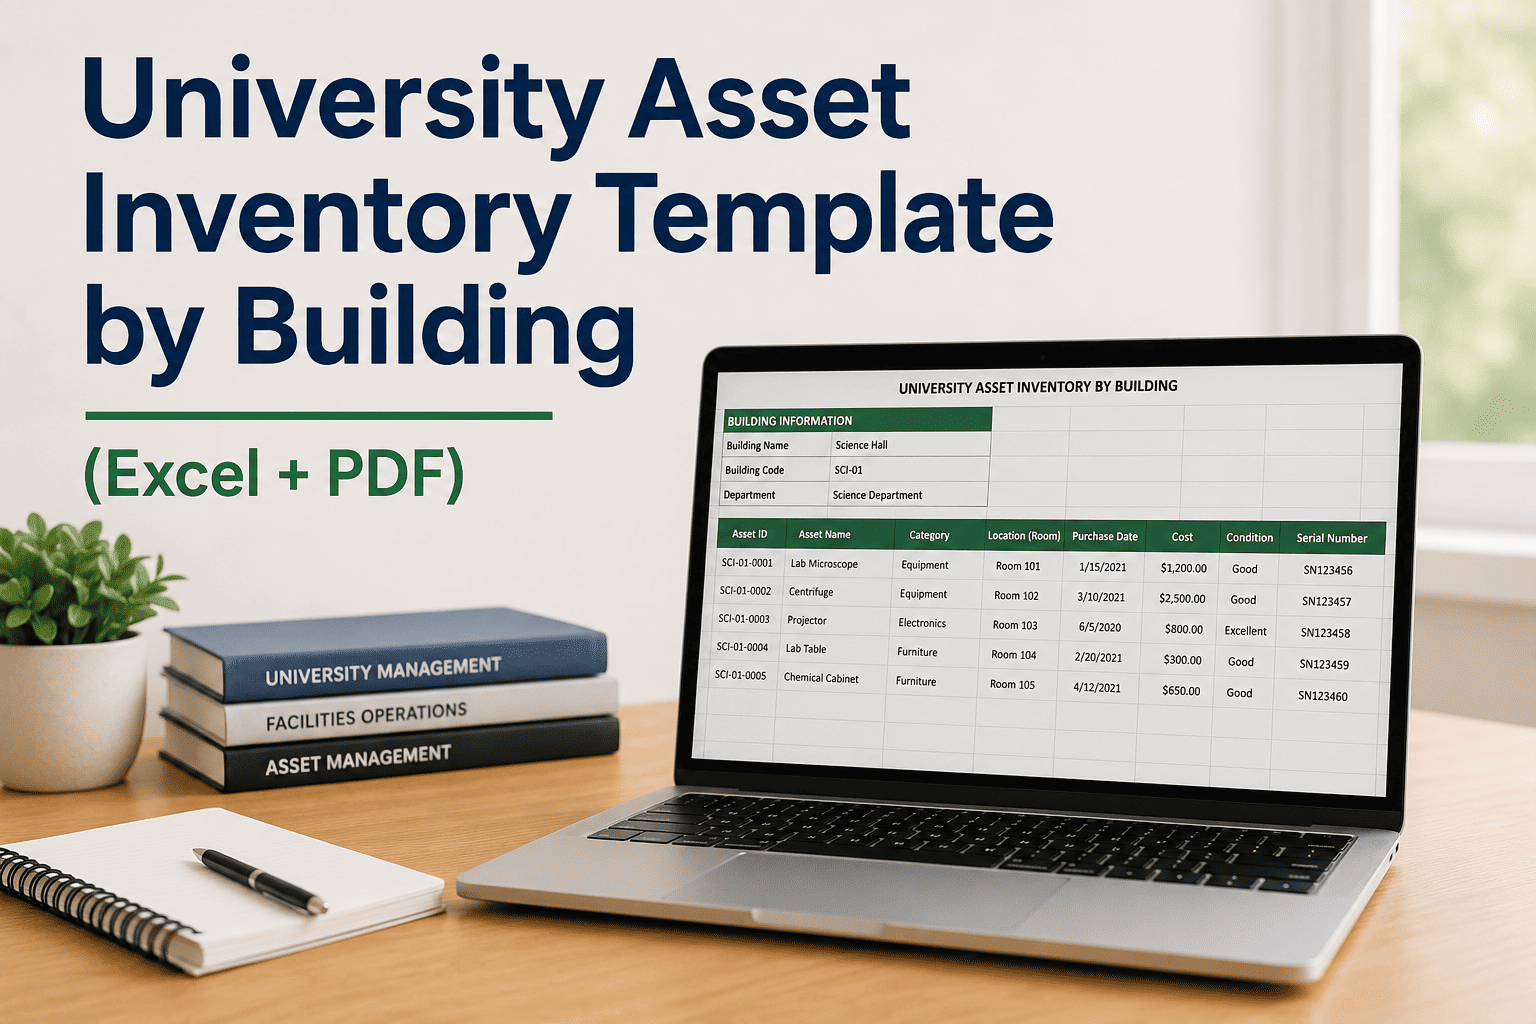
Asset list, condition ratings, FCI calculation, replacement cost columns, and 5-year capital forecast — structured for university facilities teams.
Understanding the Facility Condition Index for University Capital Planning
The FCI formula is straightforward: deferred maintenance cost divided by current replacement value. The resulting score — typically 0.00 to 1.00 — places every building on a condition spectrum that guides capital prioritization. What makes it difficult in practice is the data collection, consistency, and lifecycle forecasting required to produce scores that hold up under review.
Minimal deferred maintenance. Routine PM sufficient. Low capital priority.
Moderate deferred backlog. 3–5 year capital planning window. Monitor lifecycle.
Significant deferred maintenance. Near-term capital investment required.
Replacement may be more cost-effective than repair. Immediate executive attention.
What the University FCI and 5-Year Capital Plan Template Includes
This template is structured for university and college facilities departments conducting condition assessments, preparing deferred maintenance reports, or building 5-year capital plans for board presentation or accreditation documentation.
Building-by-building asset list with system classification (HVAC, roofing, electrical, plumbing, envelope), condition rating scale (1–5), inspector, and last assessment date. Structured for APPA or Uniformat II classification if required by institutional standard.
Per-asset deferred maintenance cost entry with RSMeans-referenced unit cost columns, scope description, urgency classification (immediate / 1-year / 3-year / 5-year), and automatic deferred backlog totals by building and system category.
Building CRV calculation using gross square footage, construction type, and cost per square foot benchmarks. Supports both institutional appraisal value input and formula-based CRV estimation for buildings without recent appraisals.
Automatic FCI calculation (DM ÷ CRV) with color-coded condition bands, portfolio-level FCI rollup, and sortable priority ranking. Dashboard view suitable for executive summary or board facilities committee presentation.
Year-by-year capital investment schedule organized by building, project type, and funding source. Includes inflation escalation factor, total 5-year spend summary, and annual budget requirement by fiscal year — formatted for submission to VP-level or board review.
System-level lifecycle tracking using install year and standard useful life benchmarks. Generates year-by-year replacement forecast to align capital spending with asset end-of-life cycles rather than reactive failure events.
Building a Defensible FCI Score Step by Step
List every building in the portfolio with gross square footage, construction year, and occupancy type. Then enumerate major systems within each building: roof, HVAC equipment, electrical distribution, plumbing, building envelope, life safety, and interior finishes. Use Uniformat II level 2 or APPA categories for consistency across assessors.
Rate each system on the 1–5 scale (5 = excellent, 1 = failed). For any system rated 3 or below, document the estimated repair or replacement cost to restore it to acceptable condition. This becomes the deferred maintenance cost input for FCI calculation.
Enter or calculate the CRV for each building. If institutional appraisals exist, use those values. If not, the template calculates CRV using gross square footage multiplied by construction-type cost benchmarks from RSMeans or local cost data, with an age-based depreciation adjustment toggle.
The FCI summary tab calculates scores automatically and ranks buildings by condition. Filter by FCI band to identify critical and poor-condition assets. Assign urgency codes to deferred maintenance line items to build the prioritized project list that feeds the 5-year capital forecast.
Assign prioritized projects to fiscal years based on urgency, FCI score, and available budget. The capital plan tab totals annual spending requirements, applies inflation escalation, and produces a 5-year funding summary formatted for VP of Administration or board facilities committee submission.
When maintenance history, inspection results, and asset condition data live in Oxmaint, your FCI scores update as work orders close — not once a year when someone rebuilds the spreadsheet. Sign Up Free to connect your PM program to your capital plan, or Book a Demo to see how university facilities teams use Oxmaint for FCI reporting.
FCI Benchmarks and Useful Life Standards for University Facilities
Accurate FCI scoring depends on consistent useful life benchmarks and replacement cost references. The following table provides standard values for major university building systems used in the template's lifecycle and deferred maintenance calculations.
| Building System | Standard Useful Life | Typical Replacement Cost Range | FCI Weight in Campus Portfolio | Recommended Inspection Frequency |
|---|---|---|---|---|
| Roofing (membrane / flat) | 20–25 years | $15–$28/sf | High | Annual |
| HVAC — Central Plant Equipment | 20–30 years | $18–$40/sf served | High | Semi-Annual |
| HVAC — Terminal Units (VAV, FCU) | 15–20 years | $800–$2,400/unit | Medium | Annual |
| Electrical Distribution (panels, switchgear) | 30–40 years | $12–$22/sf | High | Every 3 Years |
| Plumbing (domestic water, sanitary) | 30–50 years | $10–$18/sf | Medium | Every 3 Years |
| Building Envelope (windows, cladding) | 25–40 years | $30–$90/sf façade | Medium-High | Every 5 Years |
| Elevators | 20–25 years | $80,000–$180,000/cab | Medium | Annual (code) |
| Life Safety (fire suppression, alarms) | 20–25 years | $4–$8/sf | Critical | Annual (code) |
| Interior Finishes (flooring, ceilings, paint) | 10–20 years | $8–$20/sf | Low-Medium | Every 5 Years |
| Site Infrastructure (parking, walkways, utilities) | 20–30 years | Varies by scope | Low | Every 3–5 Years |
How Oxmaint Replaces the Manual FCI Spreadsheet Cycle
This template is designed to produce a credible FCI model from a single assessment cycle. The operational limitation of any spreadsheet-based FCI model is that it becomes stale the moment the assessment is complete. Oxmaint addresses this by making condition data a continuous output of the maintenance program — not a separate annual project.
Every building system registered in Oxmaint with install date, useful life, replacement cost, and condition score — the same data the template's asset inventory tab requires, maintained continuously instead of rebuilt annually.
Inspection work orders in Oxmaint capture condition ratings, deficiency photos, and repair cost estimates at the asset level — feeding FCI calculations with timestamped, inspector-attributed data instead of undocumented spreadsheet entries. Sign Up Free to structure your next condition assessment in Oxmaint.
Deferred work orders in Oxmaint carry cost estimates that roll up to a live deferred maintenance backlog by building and system. When a project is completed, the FCI score updates — no manual reconciliation between the maintenance log and the capital spreadsheet.
When facilities leadership submits a capital request, Oxmaint provides the documented maintenance history, inspection records, and condition trend data that turns an FCI score into a defensible funding case — the kind of documentation that survives budget committee scrutiny. Book a Demo to see how capital reporting works in Oxmaint.
Oxmaint calculates remaining useful life from actual equipment install dates and standard lifecycle benchmarks — generating year-by-year replacement forecasts that align capital spending with real asset end-of-life rather than estimated ages.
Portfolio FCI summaries, building condition dashboards, and deferred maintenance reports generated directly from Oxmaint work order and asset data — formatted for VP-level review, board facilities committees, and accreditation documentation requests. Book a Demo to preview the reporting output.
Five FCI Scoring Errors That Undermine University Capital Plans
Tax or insurance assessed values often understate CRV by 30–50% for older campus buildings. Using assessed value inflates FCI scores, making buildings appear in worse condition than they are and distorting portfolio prioritization.
FCI measures the cost to restore existing systems to serviceable condition — not the cost to upgrade or expand. Including renovation, code upgrade, or program improvement costs inflates the deferred maintenance numerator and produces misleading FCI scores.
When different assessors apply different interpretations of "fair" versus "poor," portfolio FCI comparisons become unreliable. The template includes rating definitions and a calibration example to reduce inter-assessor variance.
Building-level FCI scores obscure which systems are driving the deferred backlog. A building with a 0.12 FCI may have a perfect envelope and a failed HVAC system — system-level scoring is required to produce an actionable capital plan.
An FCI score that was accurate in year one is misleading in year three. Capital requests based on stale FCI data lose credibility when reviewers ask when the last assessment was conducted and what has changed since.
Frequently Asked Questions — University FCI and Capital Planning
What is a good FCI score for a university building?+
How often should universities conduct FCI assessments?+
What is the difference between deferred maintenance and capital improvement in FCI?+
Can the FCI template be used for accreditation documentation?+
How does Oxmaint improve on a spreadsheet-based FCI model?+
What is Current Replacement Value (CRV) and how is it calculated?+
Use the FCI template to structure your next condition assessment. When your institution is ready to move beyond annual spreadsheet cycles, Oxmaint connects your PM program to your capital planning process — with asset history, inspection records, and deferred maintenance tracking that make every FCI score defensible.