School facilities teams are drowning in work orders — not because they lack effort, but because most dashboards show everything and prioritize nothing. A work order triage dashboard tells your team what needs attention right now, what can wait, and what is silently building toward a costly emergency. Districts running reactive maintenance spend 3.2x more per square foot than those using structured triage. When an HVAC unit fails during a state exam or a roof leak closes three classrooms mid-semester, the cost is not just the repair — it is the disruption, the liability, and the delayed learning. OxMaint's Analytics and Reporting module gives school facilities directors a real-time triage view: open work orders by urgency tier, response time performance, overdue PM tasks, and asset-level failure trends — all in one dashboard built for school maintenance workflows. If your team is still triaging by email threads and sticky notes, start a free trial or book a demo to see triage-focused school maintenance reporting in action.
What to Track in a School Work Order Triage Dashboard
Most school maintenance dashboards show you data. A triage dashboard tells you what to act on — right now. Here is exactly what to track and why it matters for K-12 and campus facilities teams.
Why School Maintenance Dashboards Fail at Triage
A typical school CMMS shows a list of open work orders. A triage dashboard shows which of those work orders will become emergencies by Friday. The difference is not the data — it is the structure. Without urgency scoring, response time targets, and asset-level risk signals, every work order looks equally important until something breaks during a school day.
All work orders land in one queue. A leaking roof and a broken cabinet handle compete for the same attention — and often the cabinet gets fixed first because it is easier.
Teams do not know which open tickets have already breached their SLA target. A 3-day-old Priority 1 looks identical to a 3-hour-old Priority 3 in an unstructured list view.
Overdue preventive maintenance tasks are invisible in reactive dashboards. The HVAC unit 14 days past its filter change does not appear urgent — until it fails and takes the whole wing offline.
When a boiler generates its fourth work order in 60 days, that pattern signals imminent failure. Without asset-level reporting, each ticket looks like a one-off instead of a repeating failure pattern.
Exactly What to Track in Your School Work Order Triage Dashboard
These seven metrics form the triage core. Each one answers a question your facilities director needs to answer before 8 AM every school day.
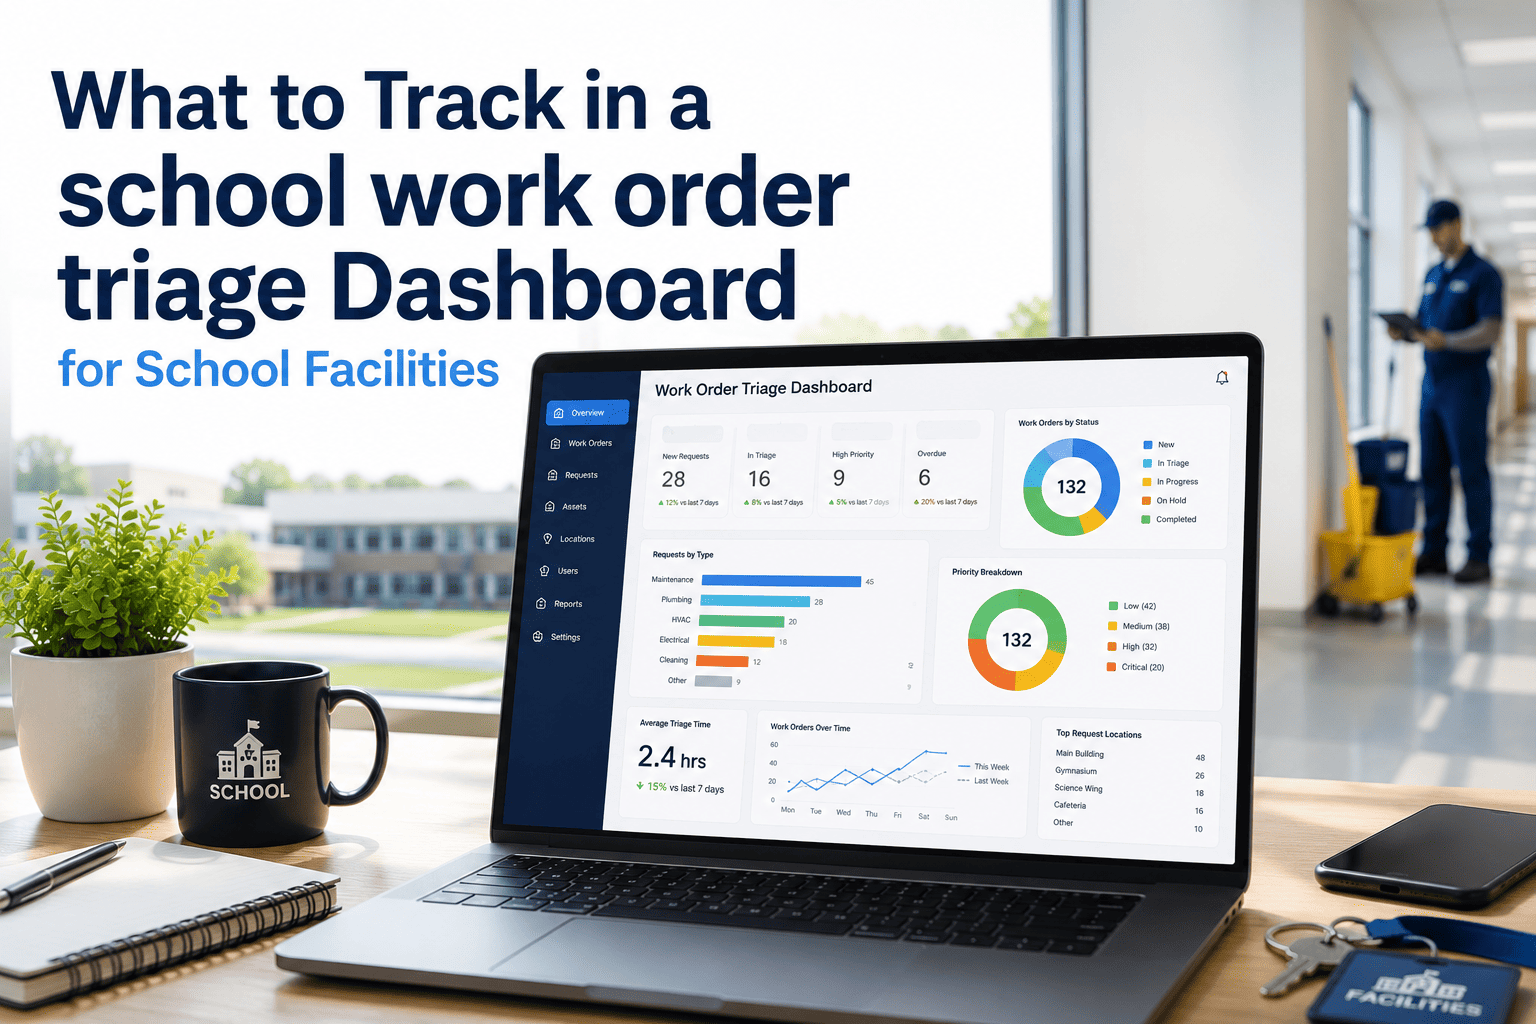
The foundational triage view. Work orders must be tiered: Safety/Emergency (P1), Instructional Impact (P2), Operational Nuisance (P3), and Planned (P4). Your dashboard should show counts at each tier — not a flat list. A P1 count above zero means someone should be on-site right now.
Every priority tier needs a defined response window: P1 within 2 hours, P2 within 1 school day, P3 within 3 days. Your dashboard should show current average response time vs. those targets — in real time. This single metric reveals whether your staffing matches your open work order volume.
PM tasks that missed their scheduled date are the single strongest predictor of emergency work orders within 30 days. Track overdue PM count by building, by system type (HVAC, plumbing, electrical), and by days overdue. An HVAC filter change 10 days overdue in a high-occupancy building is a triage item, not a paperwork issue.
Any asset generating 3 or more work orders in 90 days is a replacement or major repair candidate — not a maintenance task. This metric prevents teams from spending small amounts of money repeatedly on assets that need a capital decision. Track this by asset ID, building, and system category.
Stalled work orders due to parts delays or vendor scheduling are invisible in most dashboards — they appear "in progress" but nothing is happening. Track the count and age of stalled orders separately. A week-old stalled P2 in a classroom is a compliance risk that needs escalation, not patience.
A building with 12 open work orders may need a dedicated day of focused response — or it may signal deferred capital needs. Track open order count per building, normalized by square footage and age. High-density buildings should trigger a building condition review, not just more technician dispatches.
When one technician has 23 open assignments and another has 4, response time suffers system-wide. Track open assignments per technician against their available hours. Unbalanced workloads are the most common reason P2 tickets become P1 emergencies — not lack of staff, but poor distribution.
Ready to Build a Triage Dashboard That Actually Works for Your Schools?
OxMaint's Analytics and Reporting module gives you every one of these seven triage metrics — configured for K-12 and campus facilities, with mobile access for technicians in the field and real-time visibility for directors in the office.
The School Facility Work Order Priority Matrix
Triage only works when every team member assigns priority consistently. This matrix removes ambiguity — if a situation matches the criteria, the priority is set, and the response time clock starts.
| Priority | Criteria | Response Target | Examples | Dashboard Alert |
|---|---|---|---|---|
| P1 Safety | Immediate risk to health, safety, or structural integrity | 2 hours | Gas leak, roof collapse, exposed electrical, flooding | Red — immediate notification to director |
| P2 Instructional | Directly impacts classroom use or learning environment | 1 school day | HVAC failure, projector down, broken door lock, no hot water | Orange — escalates if unassigned after 4 hours |
| P3 Operational | Nuisance issue, no direct impact on instruction | 3 school days | Broken blinds, non-urgent plumbing drip, damaged furniture | Yellow — no escalation unless breaches target |
| P4 Planned | Scheduled PM or improvement, no urgency | Within 2 weeks | Seasonal HVAC service, floor waxing, exterior painting | Blue — batch processed weekly |
5 Dashboard Signals That Predict Emergency Work Orders
Emergency work orders rarely appear without warning. These five dashboard signals appear 2 to 6 weeks before a failure becomes a facility closure — if you are looking for them.
Facilities completing less than 80% of scheduled PMs in any 30-day window show a statistically significant spike in emergency work orders within 45 days. OxMaint flags this threshold automatically.
The third work order on the same asset in 60 days triggers an automatic replacement recommendation. Most teams do not see this pattern until it is too late because each ticket lives in isolation.
A 20% increase in average response time over two consecutive weeks signals that open work order volume is outpacing team capacity — and the backlog is beginning to compound.
Buildings accumulating many P2 and P3 orders without resolution are at high risk for cascade failures — multiple systems under stress simultaneously. This pattern demands a scheduled building blitz day.
Work orders stalled on parts or vendor for more than 5 school days have a high rate of becoming P1 emergencies — either because the problem worsens or because the root issue was underclassified at intake.
How OxMaint Delivers School Work Order Triage
OxMaint's facilities director view shows open work orders sorted by priority tier, color-coded by response time status, and filterable by building, system, and technician. No manual sorting — the triage structure is built in.
Set response time targets per priority tier. OxMaint automatically escalates any work order that breaches its target window — sending alerts to supervisors before problems become complaints from principals or parents.
Every work order is linked to a specific asset. OxMaint surfaces assets with repeat failures automatically — so your triage dashboard shows not just what is broken today, but what is about to break next week.
Technicians see their prioritized assignments on mobile — with asset history, building location, and parts requirements attached. No radio calls, no clipboard, no wasted trips to the wrong building on the wrong floor.
Frequently Asked Questions
What is the difference between a work order list and a triage dashboard?+
How many priority tiers should a school facilities dashboard use?+
How does OxMaint help school facilities teams see overdue PM tasks alongside work orders?+
Can OxMaint handle work order triage across multiple school buildings in a district?+
What reports should a school facilities director review weekly from the triage dashboard?+
Stop Triaging by Instinct. Start Triaging by Data.
OxMaint gives school facilities directors the exact dashboard metrics that separate reactive teams from predictive ones. Real-time priority tiers, response time tracking, PM backlog visibility, and asset-level failure trends — all in one place, built for schools.