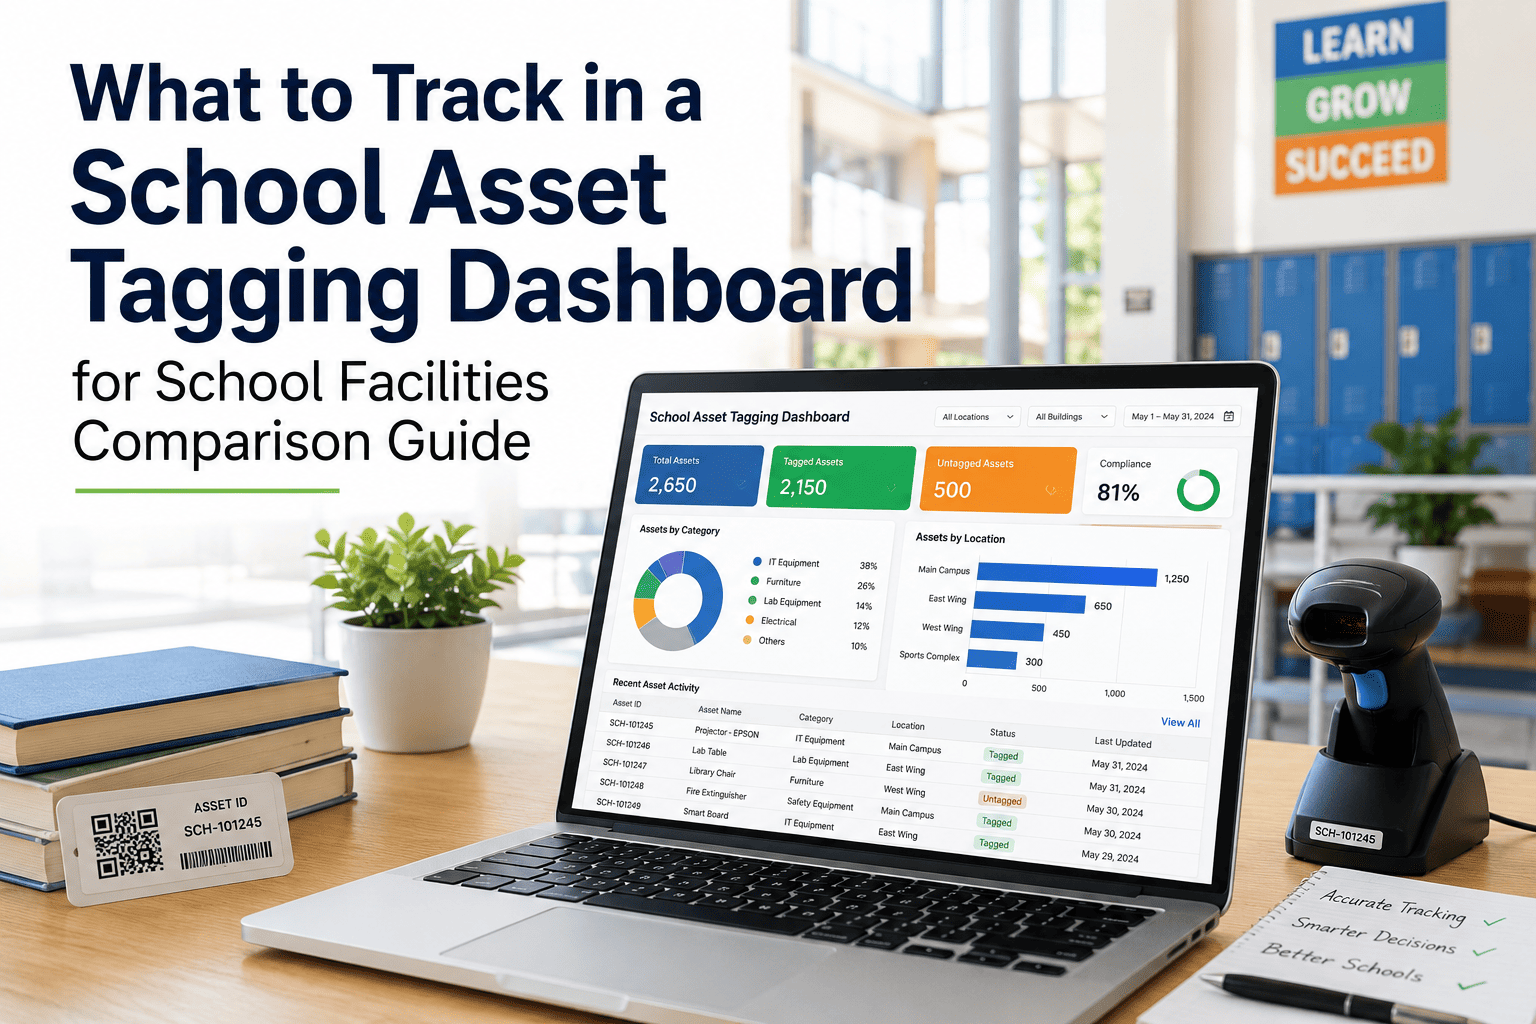
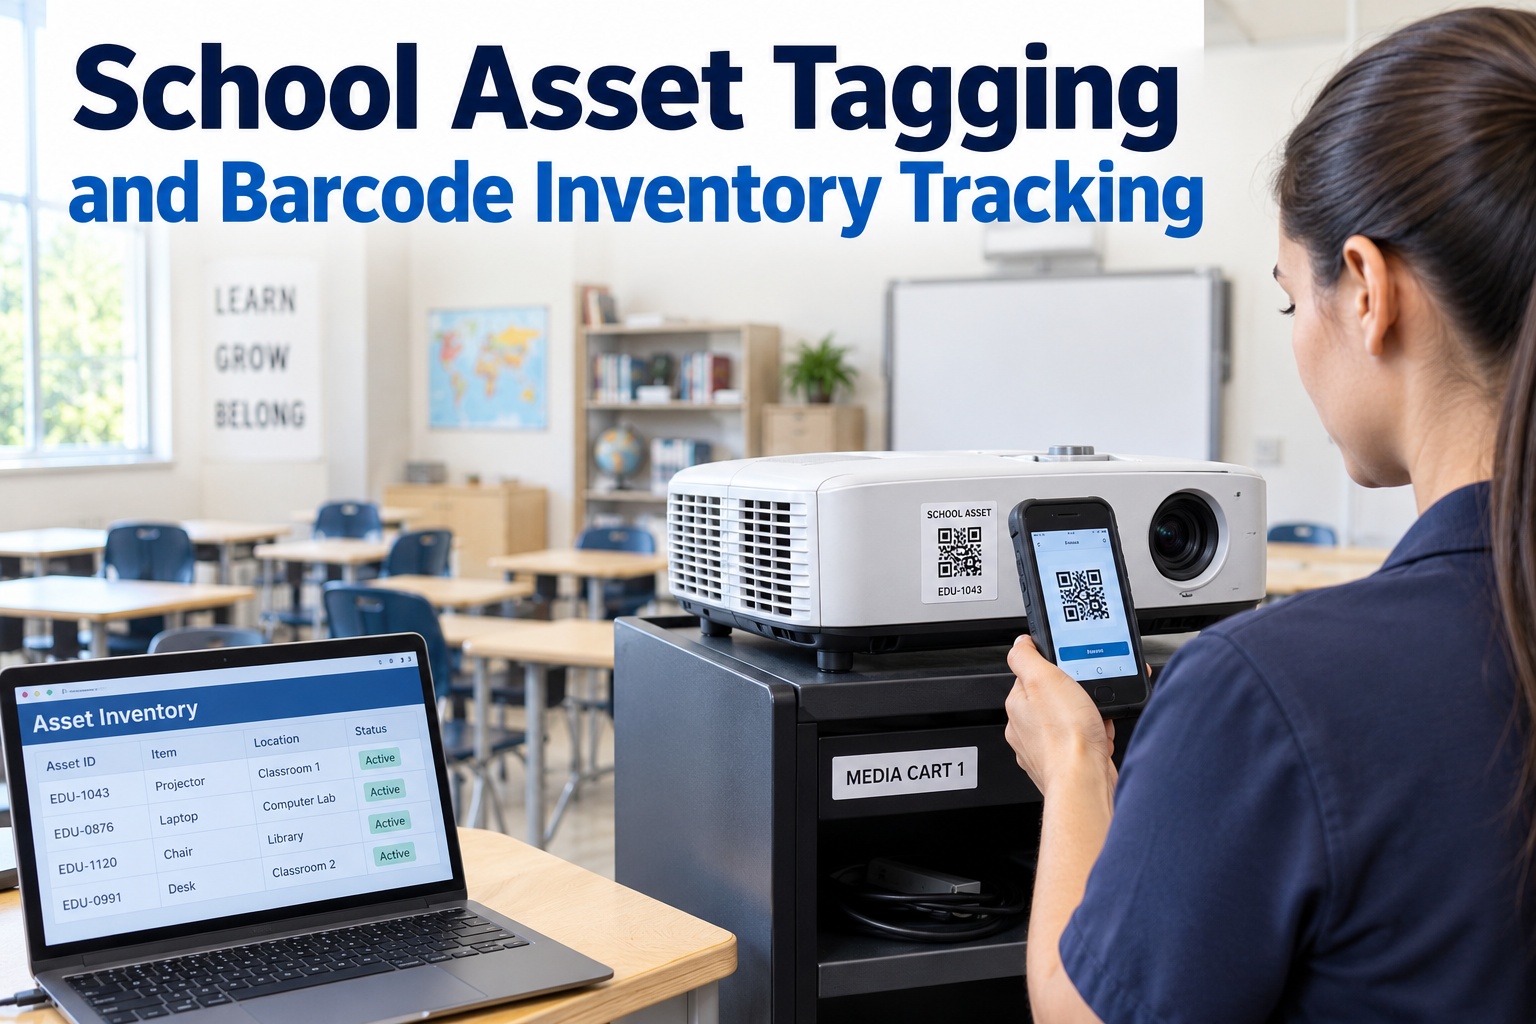
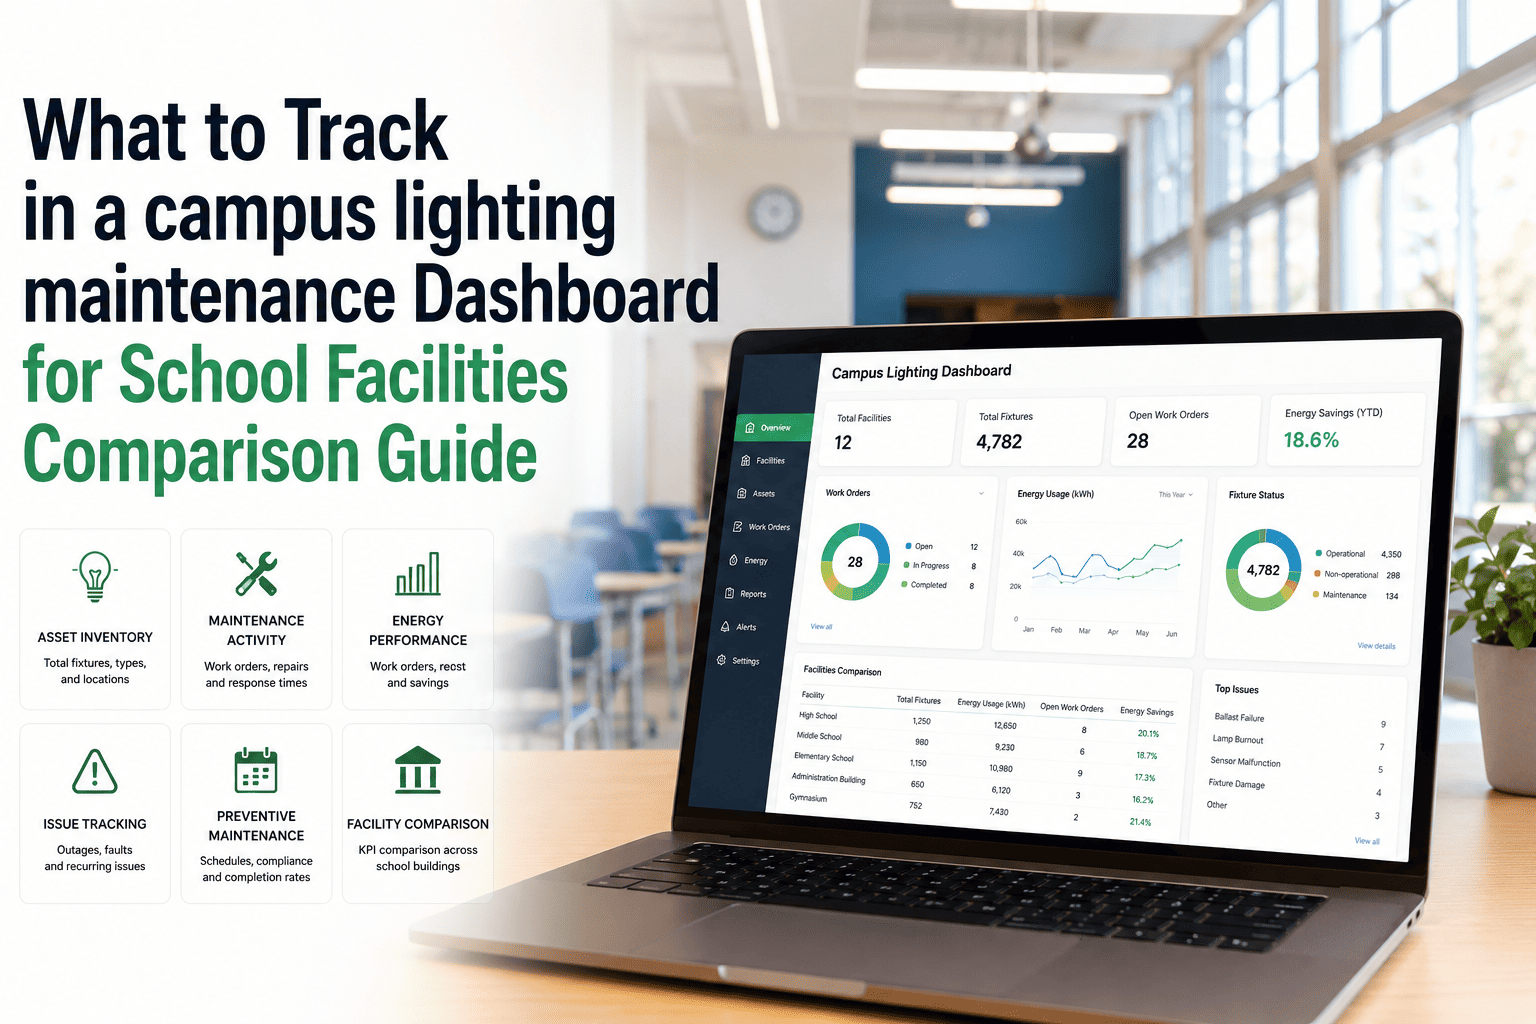
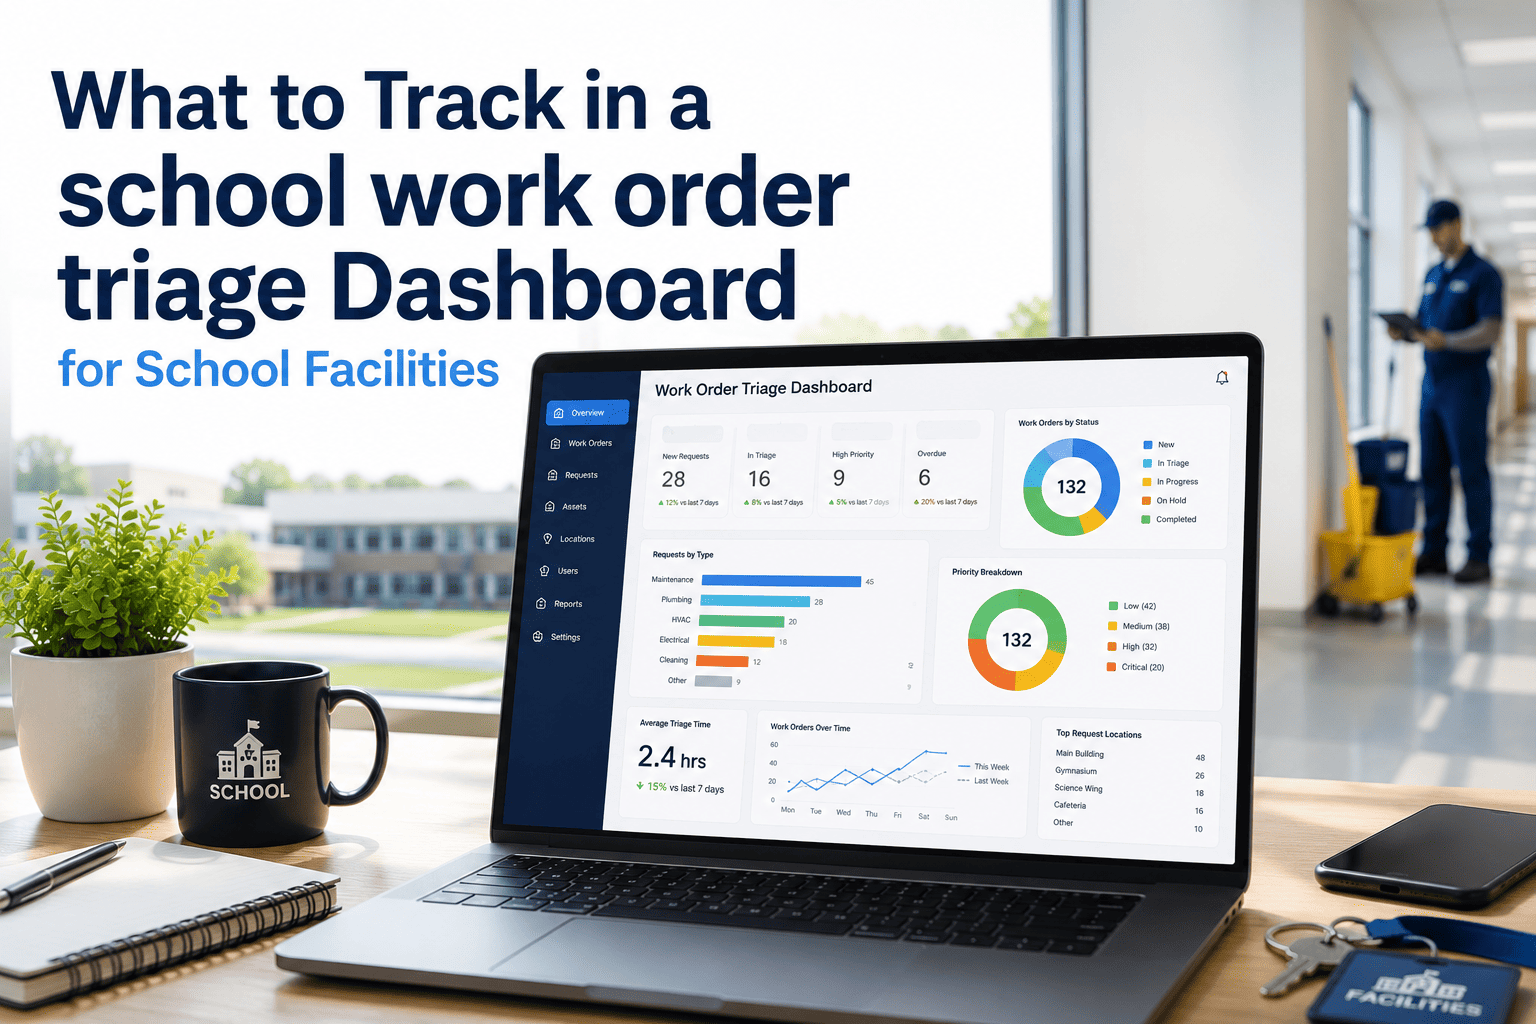
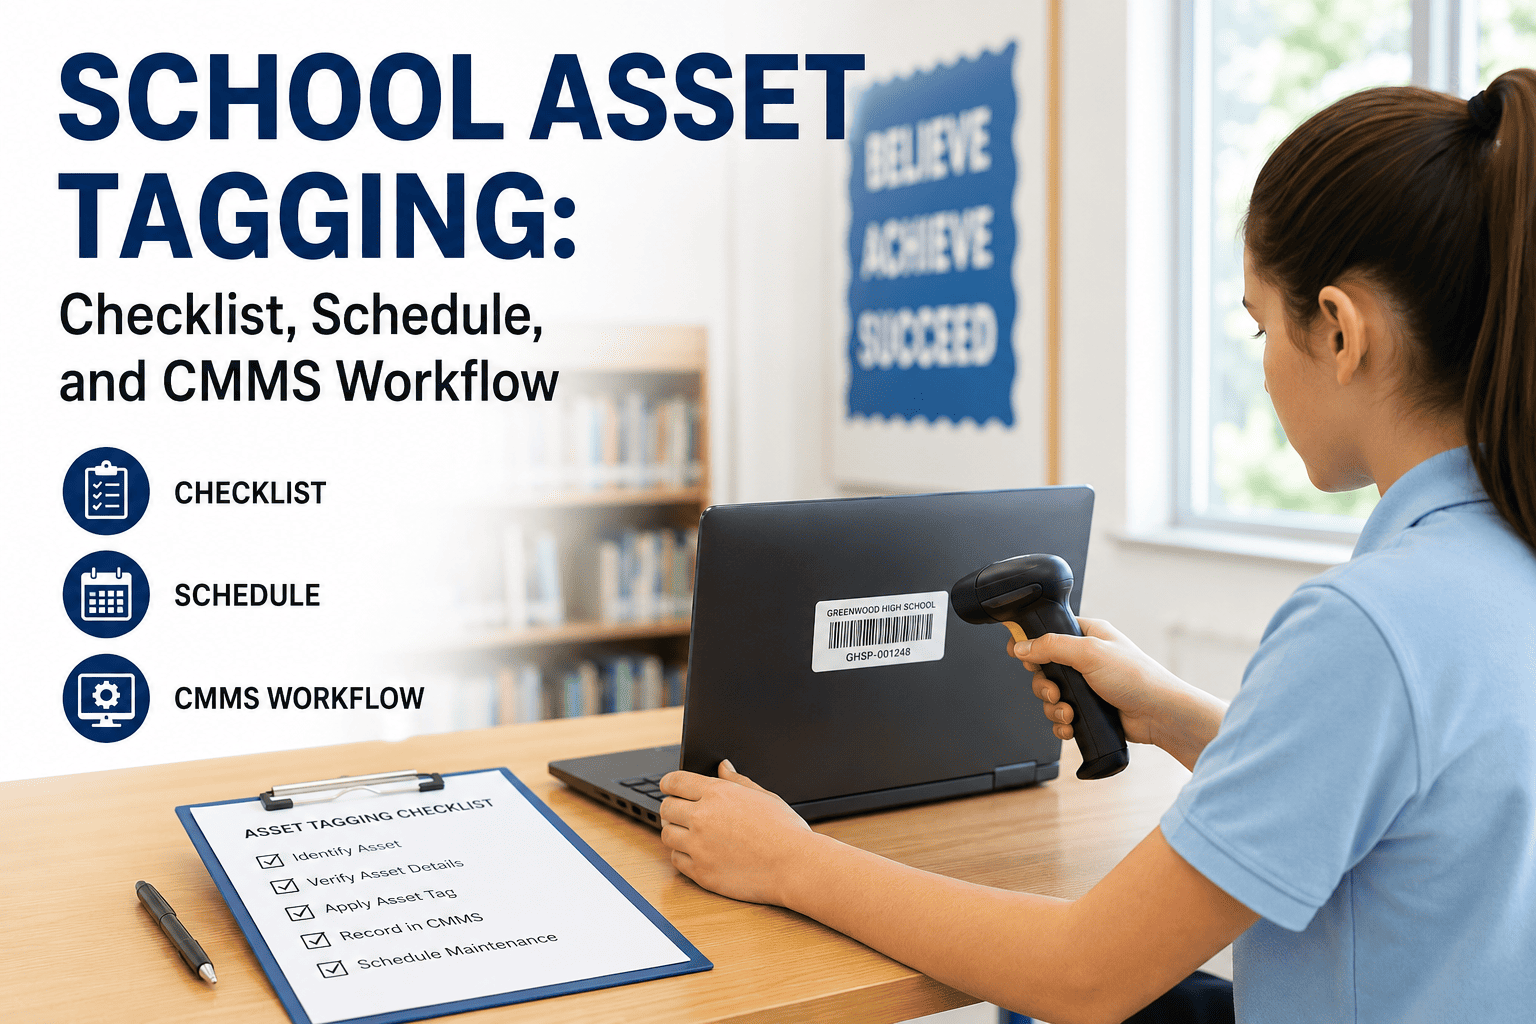
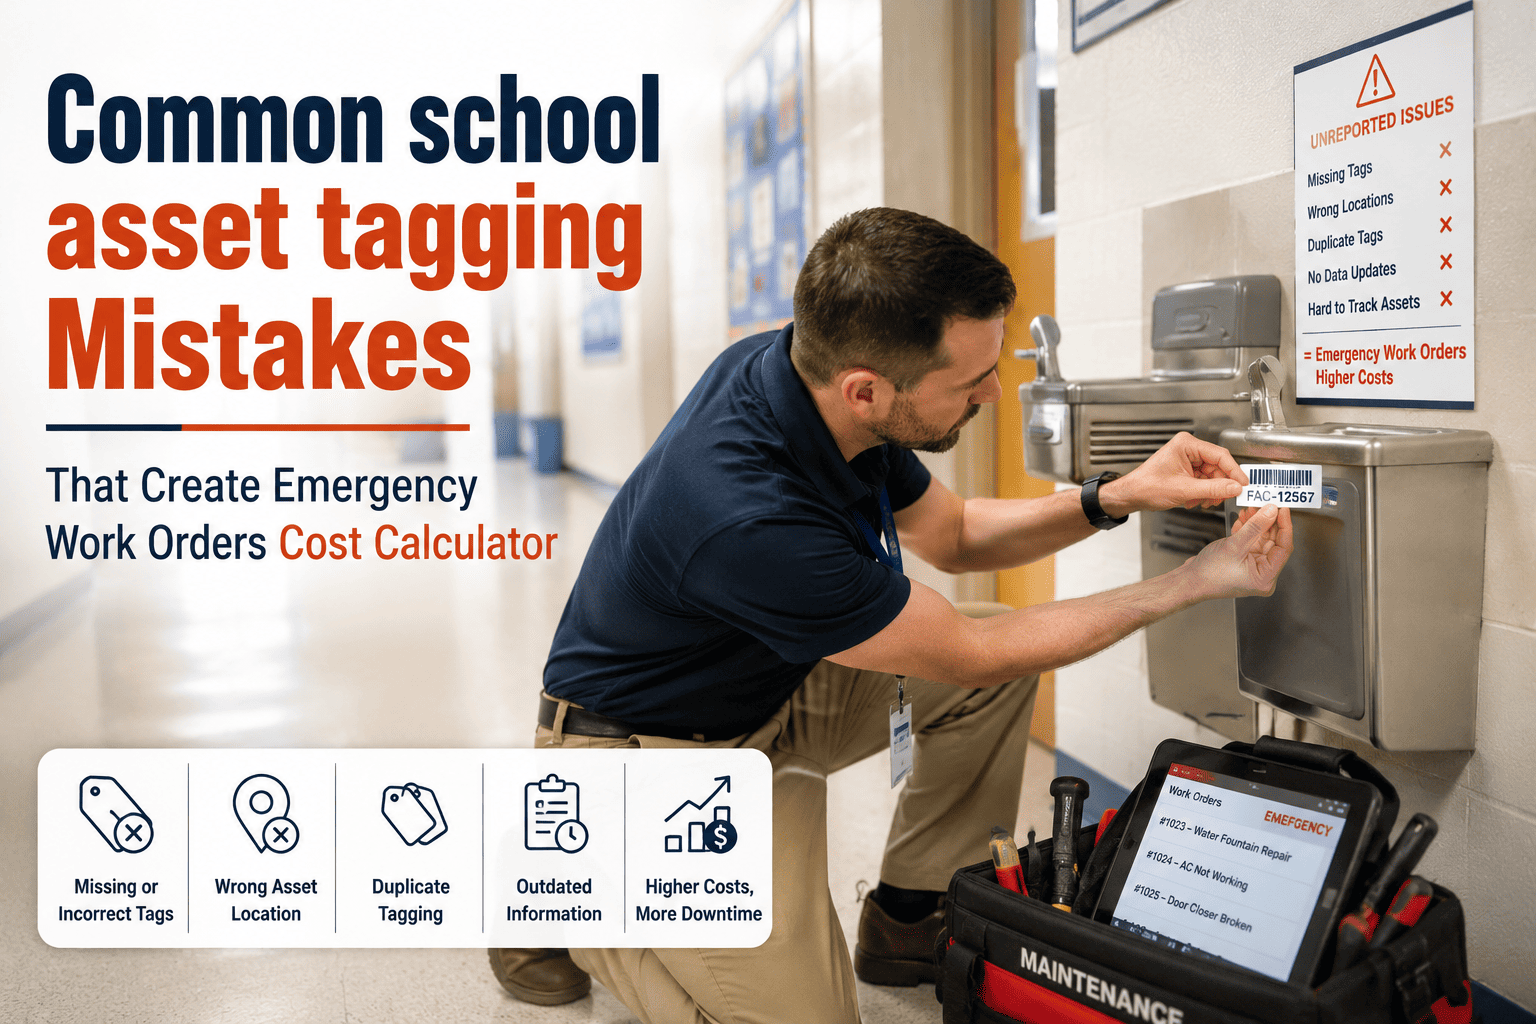
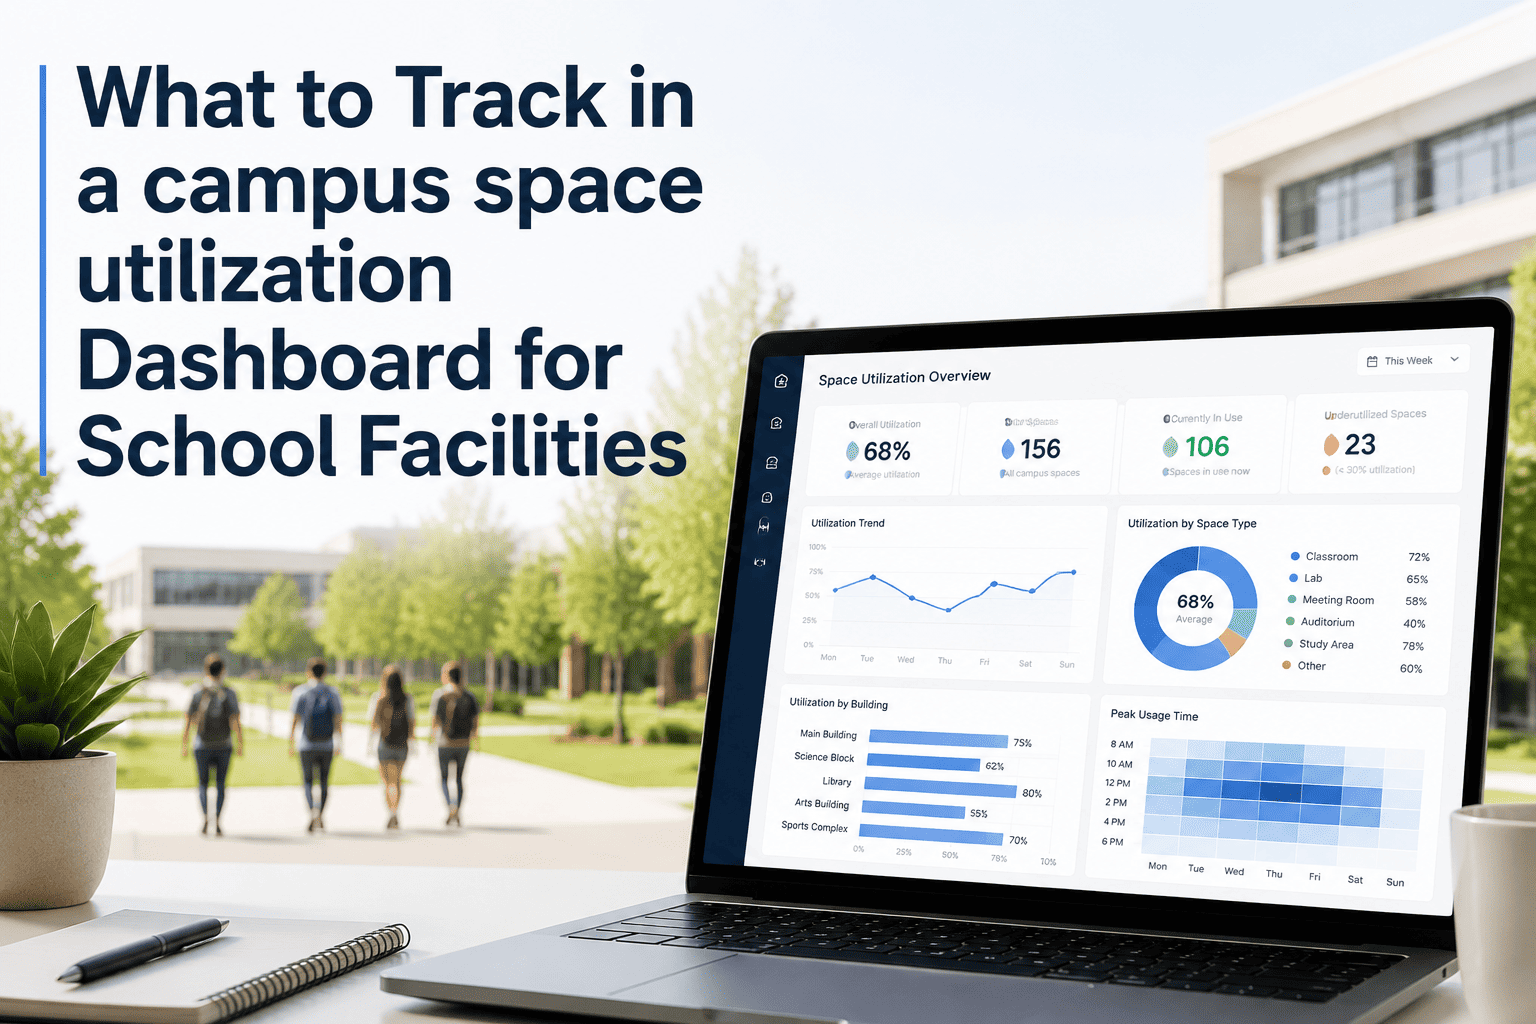
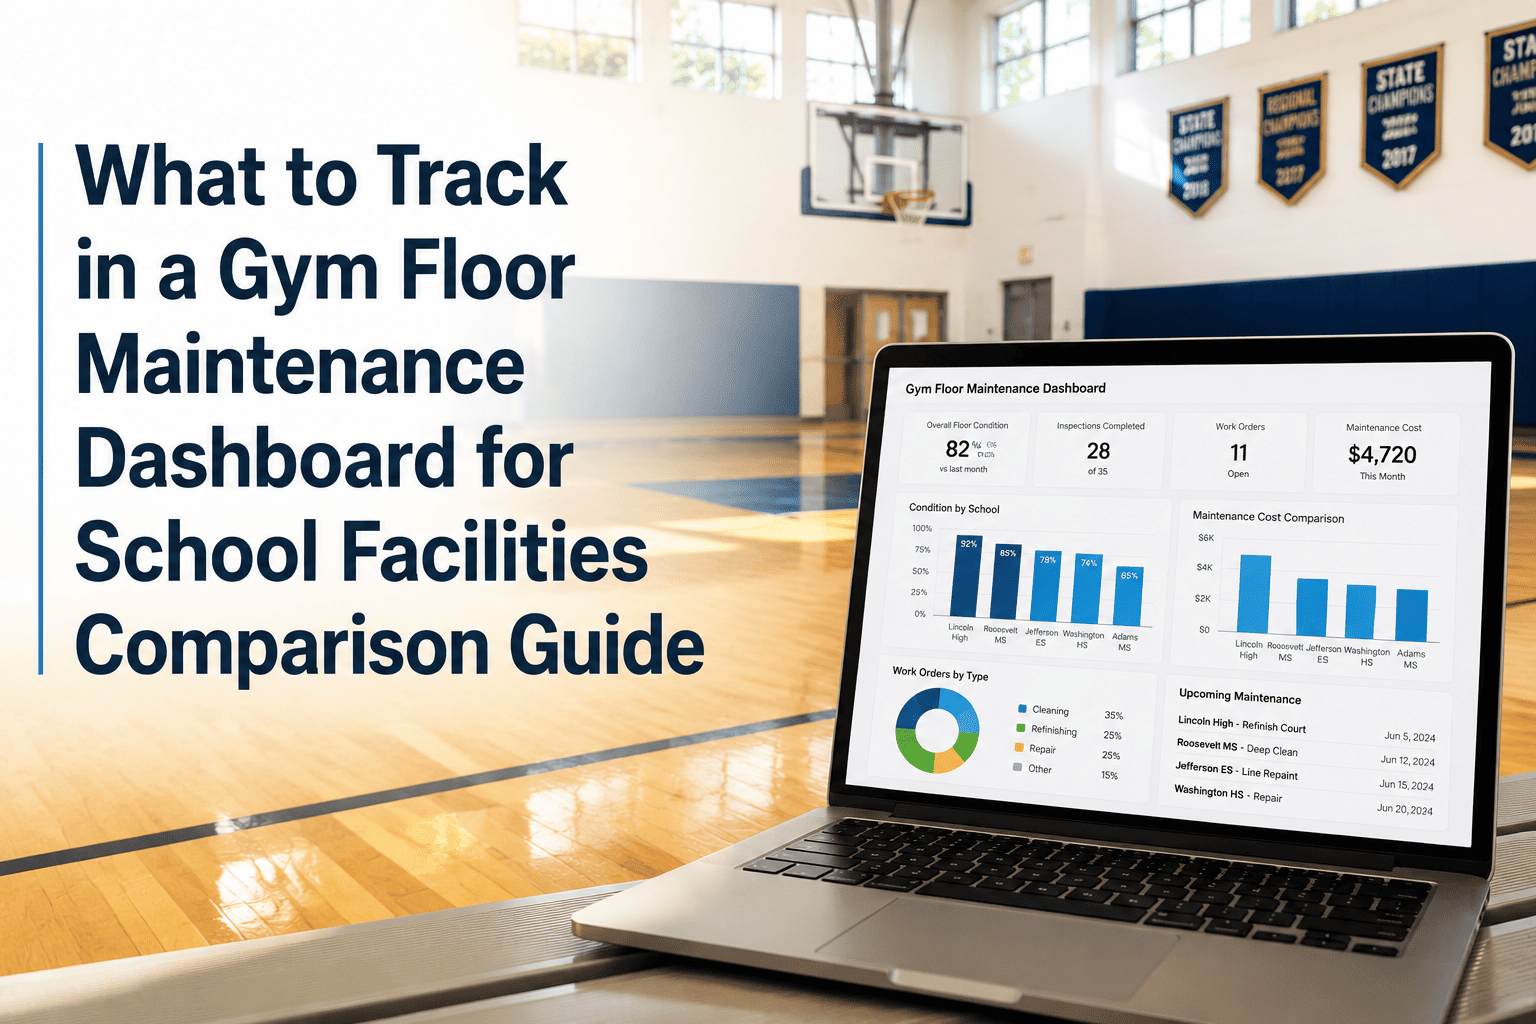
A school asset tagging dashboard is only as useful as the fields it tracks. Most districts start with a name and a barcode, then discover at audit season that they cannot prove which assets were grant-funded, where a transferred projector ended up, or which HVAC units are overdue for replacement. A dashboard built for school facilities tracks far more than location — it ties every asset to its funding source, condition, service history, and refresh timeline so finance, IT, and facilities all read from one record. This comparison guide breaks down exactly what a school dashboard should track and how a basic inventory view stacks up against a comprehensive one. Districts ready to upgrade their view can Sign Up Free and build a dashboard their auditors and board will actually trust.
School Facilities · IT · Finance Teams
Track What Auditors, Boards, and Budgets Actually Ask For
OxMaint's asset dashboard goes beyond a barcode and a room number — funding source, condition, service history, depreciation, and refresh timing in one filterable view. When your superintendent asks for total cost of ownership or your auditor wants a funding-tagged report, you produce it in seconds.
The Six Field Groups Every School Dashboard Needs
Each group answers a question someone in your district will eventually ask. Track all six and most audit, budget, and insurance requests answer themselves.
01
Identity & Tag
Unique ID, serial number, tag type, and category. The anchor every other field links back to, preserved even when a physical tag is replaced.
02
Location
Campus, building, room, and assigned owner — plus home location versus current location to catch unlogged transfers between sites.
03
Funding Source
General fund, grant, bond, or restricted gift. The field that turns an audit request into a filtered report instead of a week of searching.
04
Condition & Status
Active, loaner, in repair, surplus, or retired — with condition rating, so you flag end-of-life by incident rate and age, not age alone.
05
Service History
Linked work orders and repairs reveal which models fail repeatedly and when replacement beats another repair.
06
Lifecycle & Cost
Purchase date, depreciation, warranty, and projected refresh year — the foundation for a defensible capital replacement plan.
Book a Demo to see lifecycle tracking.
Basic Inventory View vs. Comprehensive Dashboard
A spreadsheet answers "do we have it." A real dashboard answers "what does it cost, who funded it, and when do we replace it."
Basic Inventory View
Item name and barcode only
One static location field
No funding-source tagging
No service or repair history
Manual annual count, days of staff time
Single-user spreadsheet view
Comprehensive Dashboard
Identity, serial, tag type, category
Home vs. current location, transfer logs
Funding tagged for audit-ready reports
Linked work orders and failure patterns
Scan-based audits finished in hours
Shared view for IT, finance, and facilities
Match Reports to the Person Asking
The same dashboard should slice differently for each stakeholder. If it cannot, it is an inventory list, not a decision tool.
Superintendent
Total cost of ownership by category and 10-year capital replacement outlook.
Auditor
Funding-tagged asset list proving grant and bond equipment is still in use.
Finance
Accurate location and condition data for clean depreciation schedules.
Facilities
Repeat-failure assets and refresh timing to plan PM and budgets.
Why the Right Fields Pay Off
40-55%
fewer unplanned equipment failures for districts that track condition and lifecycle, not just location
3-5 yrs
longer average asset lifespan from condition-based planning and timely preventive work
52%
lower emergency replacement spend when refresh is planned from dashboard data
Hours
not days — scan-based audits replace manual counts with funding-tagged accuracy
Build a Dashboard That Answers Every Question
From Barcode to Board-Ready in One Filterable View
Your auditor needs funding tags, your finance team needs depreciation, your superintendent needs a replacement plan, and your facilities team needs failure history. OxMaint tracks all of it against every asset, so one dashboard serves four stakeholders without four spreadsheets.
Frequently Asked Questions
What's the most important field besides location?
Funding source. Tagging assets by grant, bond, or fund turns an audit request into a filtered report in seconds and protects the district from penalties tied to misallocation.
Why track home location and current location separately?
It prevents duplicate purchases and catches unlogged transfers. Knowing where an asset belongs versus where it actually is lets central teams reallocate equipment across campuses.
How does service history help budgeting?
Linking tickets to asset records shows which models fail repeatedly and when replacement is more economical than repair, so refresh decisions rest on data instead of guesswork.
Can one dashboard serve finance, IT, and facilities?
Yes. A comprehensive dashboard slices the same records into depreciation views, device reports, and failure history, so every team reads from one source of truth.
Sign Up Free to set it up.
How often should the dashboard be audited?
Quarterly for high-turnover and high-value assets, annually for fixed items, with every transfer or repair updating the record on trigger to keep counts accurate between audits.
Stop Guessing at Audit Season
Track Every Field That Matters — In One Place
The difference between a passed audit and a failed one is whether your dashboard tracked funding, condition, and lifecycle from the start. OxMaint captures all of it automatically as your team works, so the report is already built when someone asks for it.