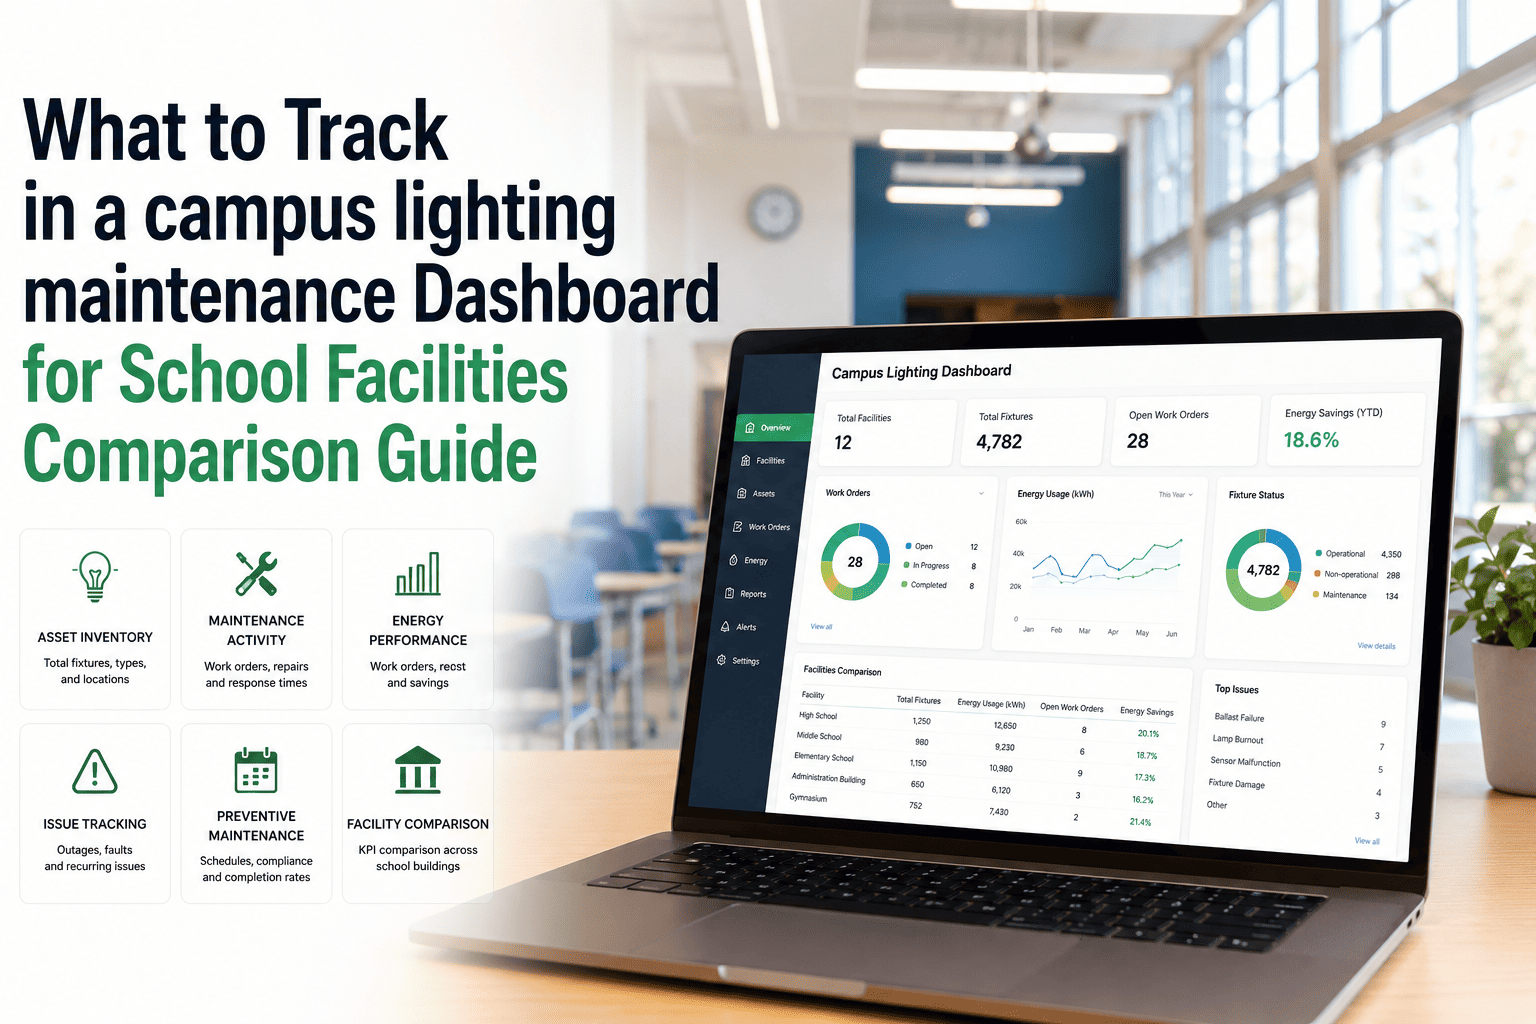
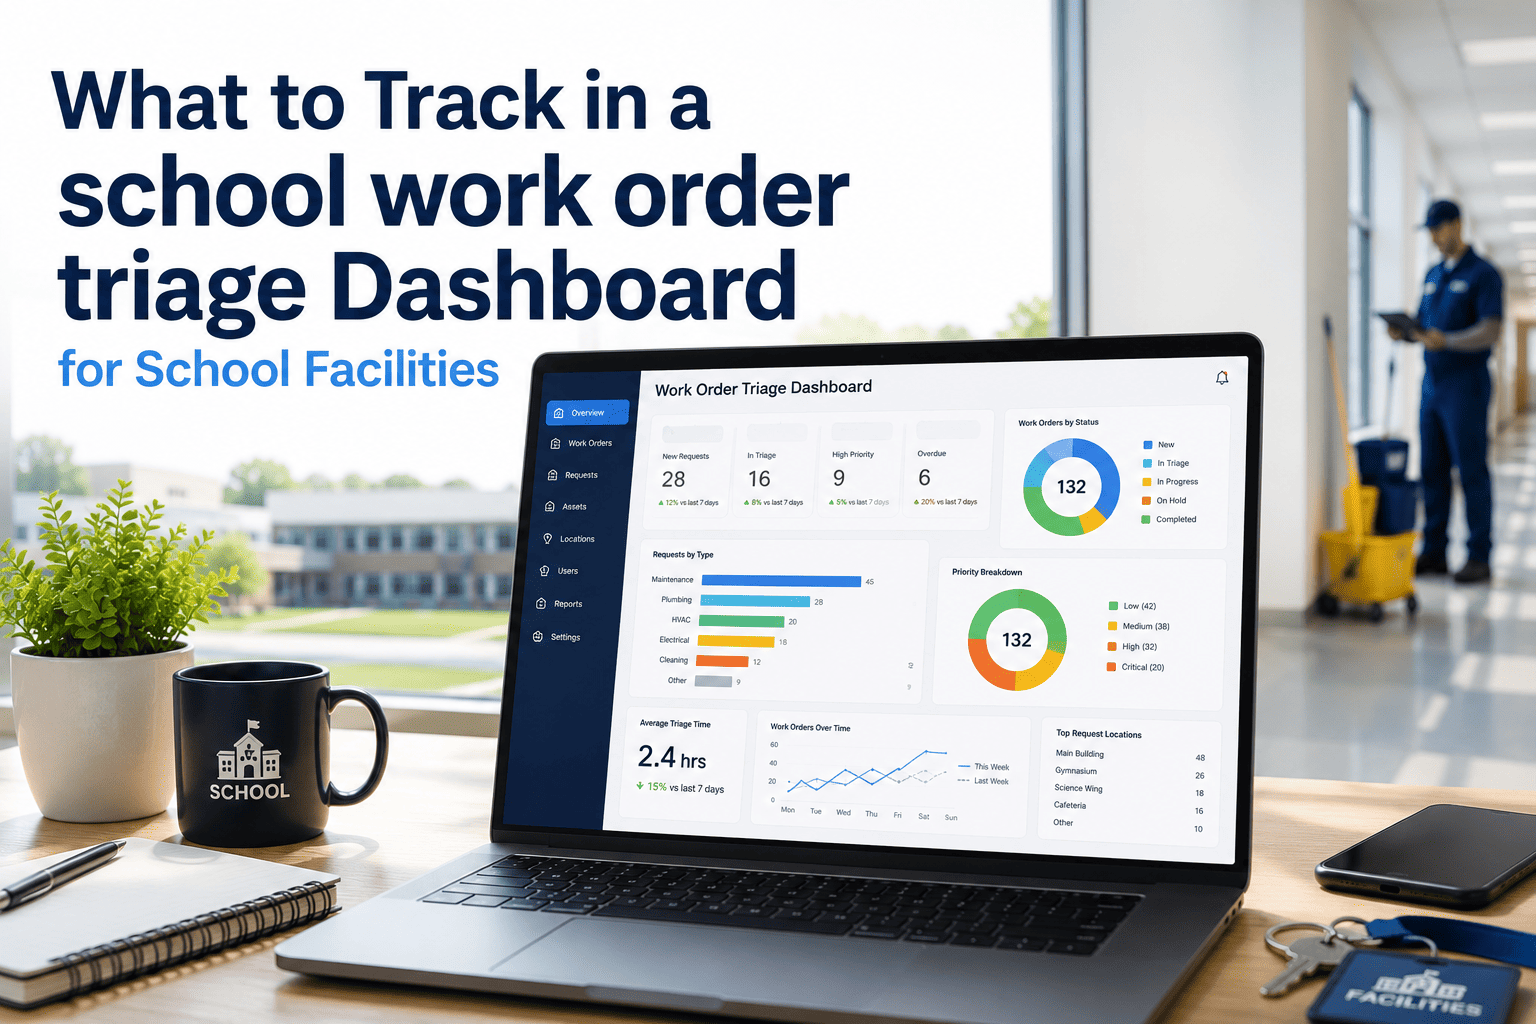
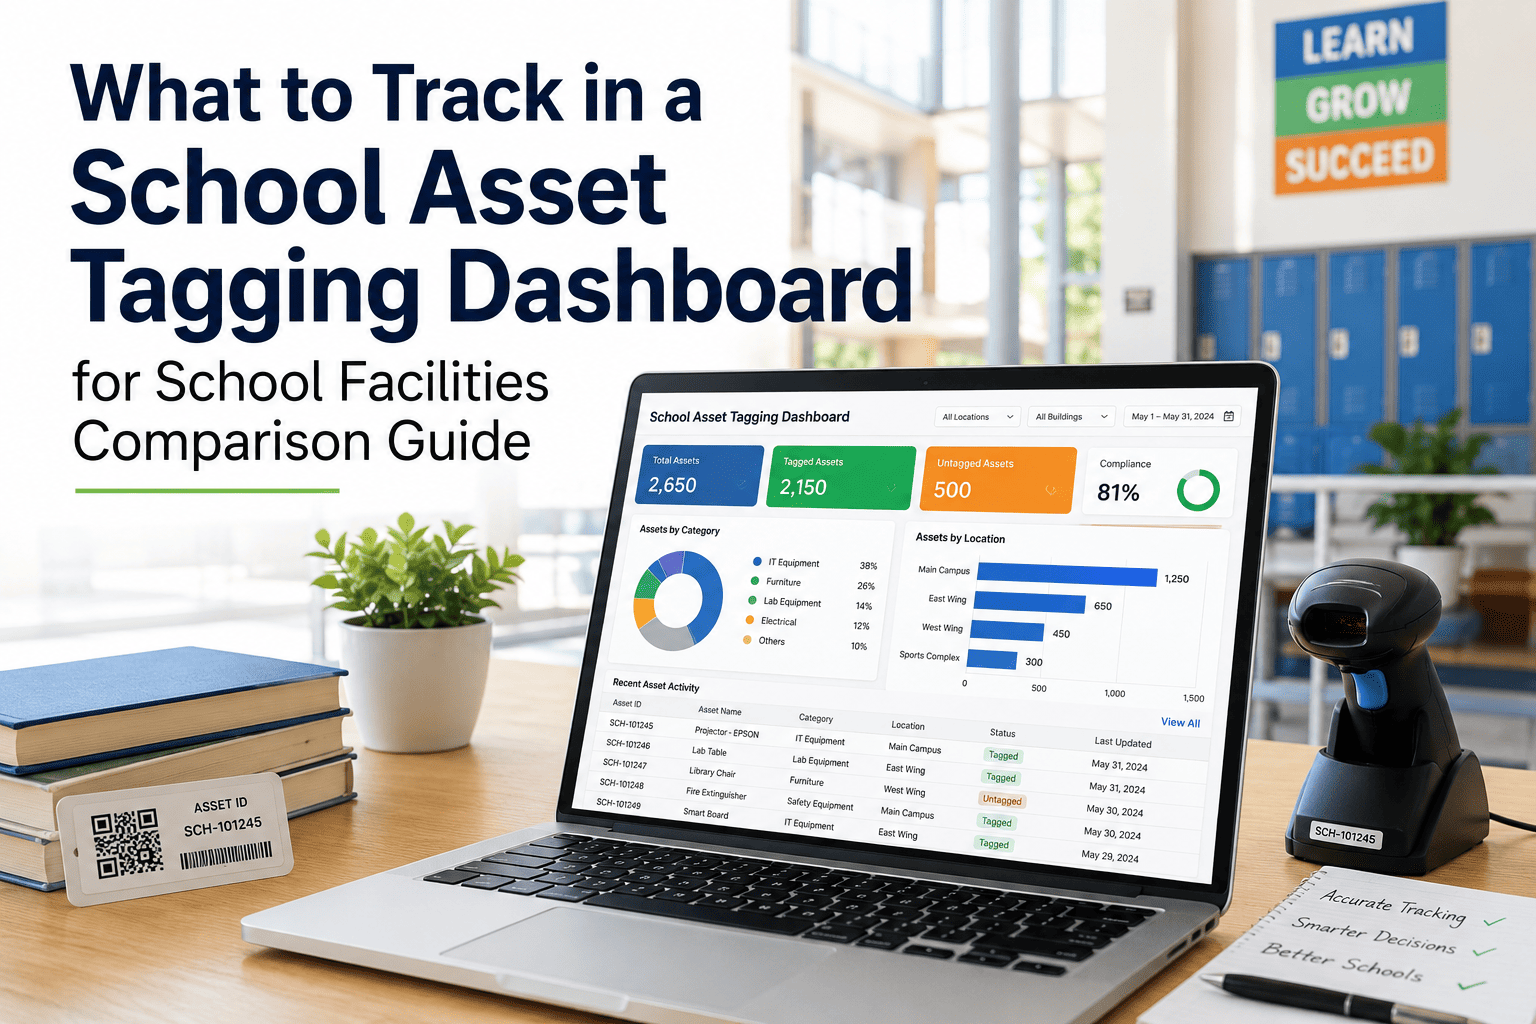
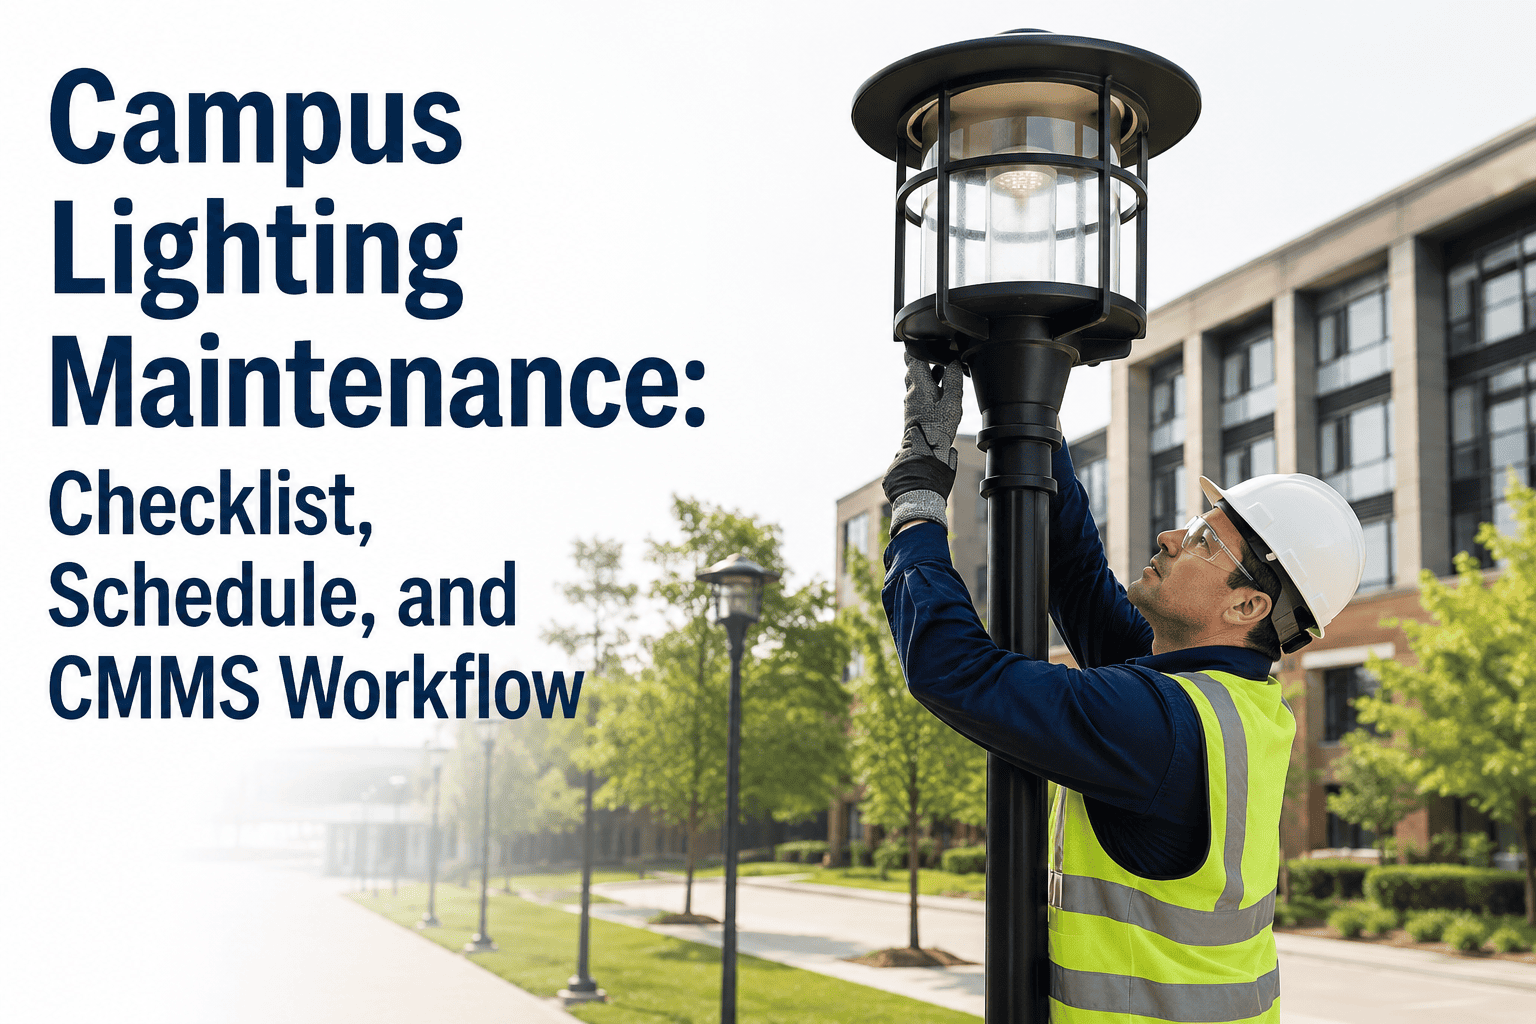
A flickering hallway light is a minor annoyance. A failed emergency exit light during a fire drill is a compliance violation. A burned-out gym fixture during an evening event is a safety hazard and an angry phone call to the facilities director. Most school districts track lighting repairs the same way they track every other work order — buried in a generic list with no visibility into energy waste, fixture lifespan, or which buildings are bleeding electricity costs. A proper lighting maintenance dashboard changes that by separating lighting assets from the noise and surfacing exactly what matters: which fixtures are failing repeatedly, where energy spend is climbing, and which buildings need a retrofit conversation before the next budget cycle. To see how OxMaint structures this for school and campus facilities teams, you can start a free trial.
Energy and Lighting / Dashboard Comparison Guide
What a Real Campus Lighting Maintenance Dashboard Should Track
Not every metric belongs on a lighting dashboard. Here is what separates a dashboard that gets ignored from one that actually drives decisions about repairs, retrofits, and energy budgets.
The Five Metrics That Belong on Every Lighting Dashboard
Most maintenance software shows you a list of completed work orders. A lighting dashboard needs to show patterns, not just history. These five metrics turn raw repair data into decisions.
01
Fixture Failure Frequency by Building
Tracks how often fixtures fail per building and per fixture type, so you can spot a gym with chronic ballast failures before it becomes a recurring complaint.
02
Emergency and Exit Light Compliance Status
A real-time view of which exit and emergency fixtures have passed their required inspection, since these are the lights auditors check first.
03
Average Repair Time by Fixture Type
LED drivers, ballasts, and sensors all fail differently. Average repair time by type tells you where technicians are losing the most hours.
04
Energy Consumption Trend per Building
Pairing lighting work orders with utility data shows which buildings would benefit most from an LED retrofit, ranked by payback period.
05
Parts Consumption and Reorder Triggers
Ballasts, drivers, and bulbs consumed per month, with automatic reorder points so technicians are never stuck waiting on a part for a classroom fix.
Dashboard Comparison: Spreadsheet vs Generic CMMS vs OxMaint
| Capability | Spreadsheet Tracking | Generic CMMS | OxMaint Lighting Dashboard |
| Fixture-level failure history |
Manual, easy to lose |
Buried in general asset list |
Dedicated lighting asset view |
| Emergency light compliance tracking |
Separate paper log |
Not built in |
Automated inspection reminders |
| Energy trend by building |
Not possible |
Limited reporting |
Visual building-level trends |
| Mobile access for technicians |
No |
Sometimes |
Full mobile work order access |
| AI-suggested retrofit priorities |
No |
No |
Built into reporting layer |
Why Lighting Deserves Its Own Dashboard
35%
Of campus electricity spend typically comes from lighting systems alone
50-60%
Energy reduction districts report after LED retrofits guided by usage data
3x
Faster repair turnaround when fixture history is asset-linked, not buried in a general list
Common Mistakes Districts Make With Lighting Tracking
Treating Every Fixture the Same
Gym high-bays, classroom panels, and exterior pole lights fail for different reasons and on different cycles. Lumping them into one generic asset category hides the patterns that matter most.
No Link Between Repairs and Utility Bills
Facilities teams that track work orders separately from energy spend miss the connection between a chronically failing fixture and a rising electricity bill in that same building.
Waiting for a Failure to Schedule Inspection
Emergency and exit lighting should be checked on a fixed schedule, not only after someone notices it's dark — by then a compliance window may already be missed.
No Building-Level Comparison
Without comparing failure rates and energy use across buildings side by side, it's nearly impossible to justify which building gets the next retrofit budget.
Rolling Out a Lighting Dashboard in Three Phases
Phase 1
Import existing fixture inventory and tag each one by building, zone, and fixture type so reporting has a foundation to build on.
Phase 2
Run a full semester of work orders through the system so failure patterns and repair times start to show real trends instead of guesses.
Phase 3
Pair the dashboard with utility billing data to rank buildings by retrofit payback period and bring that ranking into the next budget meeting.
See Your Lighting Data the Way Your Budget Committee Wants It
OxMaint turns scattered lighting work orders into a building-by-building view of failures, energy trends, and retrofit priorities — built for the conversations you have with your business office every spring. Ready to see your own campus data laid out this way?
Frequently Asked Questions
Can a lighting dashboard track multiple school buildings at once?
Yes, OxMaint groups lighting assets by building and zone, so a district facilities director can compare failure rates and energy trends across every campus from a single view.
Start a free trial to see a multi-building view.
Does it help with emergency lighting compliance inspections?
Exit and emergency fixtures are flagged with inspection due dates, and technicians complete the check directly from their phone, which keeps the compliance record audit-ready year round.
Can the dashboard help decide which buildings need an LED retrofit first?
By pairing repair frequency with energy consumption trends, the dashboard ranks buildings by retrofit payback period, so capital budgets go to the highest-impact projects first.
Is this only useful for large districts with many buildings?
Smaller campuses benefit too, since even a single building's lighting failure pattern can reveal a wiring issue or a fixture batch that needs replacing.
Book a demo to see a single-campus setup.
How long does it take to set up lighting tracking in OxMaint?
Most districts import their existing fixture list and begin tracking work orders the same week, with the dashboard populating meaningful trends within the first full semester of use.
Stop Guessing Which Buildings Need a Lighting Retrofit
OxMaint gives school and campus facilities teams a dedicated lighting dashboard that tracks failures, energy trends, and compliance in one place — so every retrofit decision is backed by real data, not a hunch. Bring your data into focus before the next budget cycle.