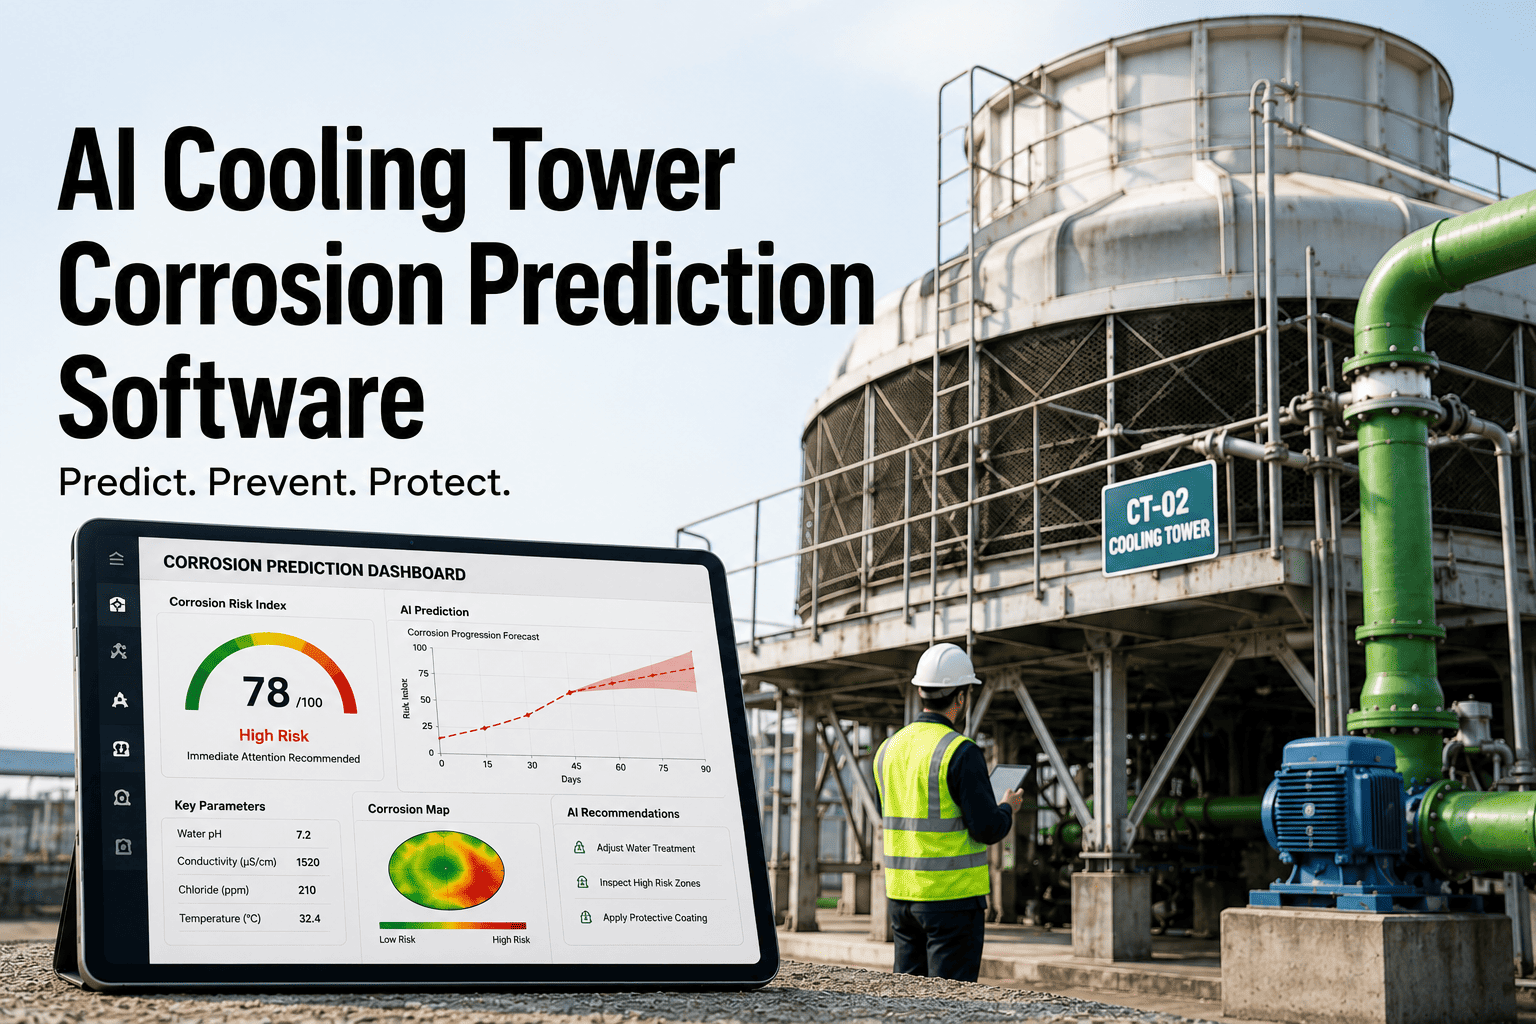
Cooling tower corrosion rarely announces itself until a heat exchanger tube perforates mid-summer or a distribution header fails during a plant shutdown. Left untreated, mild steel components can lose metal at nearly 60 mils per year, turning a small water chemistry gap into a six-figure equipment replacement. Facility teams relying only on quarterly lab coupons are often reading yesterday's water chemistry while today's pH excursion is already pitting their heat exchangers. AI-powered corrosion monitoring closes that gap by reading pH, conductivity, and corrosion trends continuously and flagging deviations before metal loss accelerates. See it for yourself with a demo of Oxmaint's corrosion monitoring dashboard.
AI Corrosion Monitoring · Predictive Maintenance · CMMS
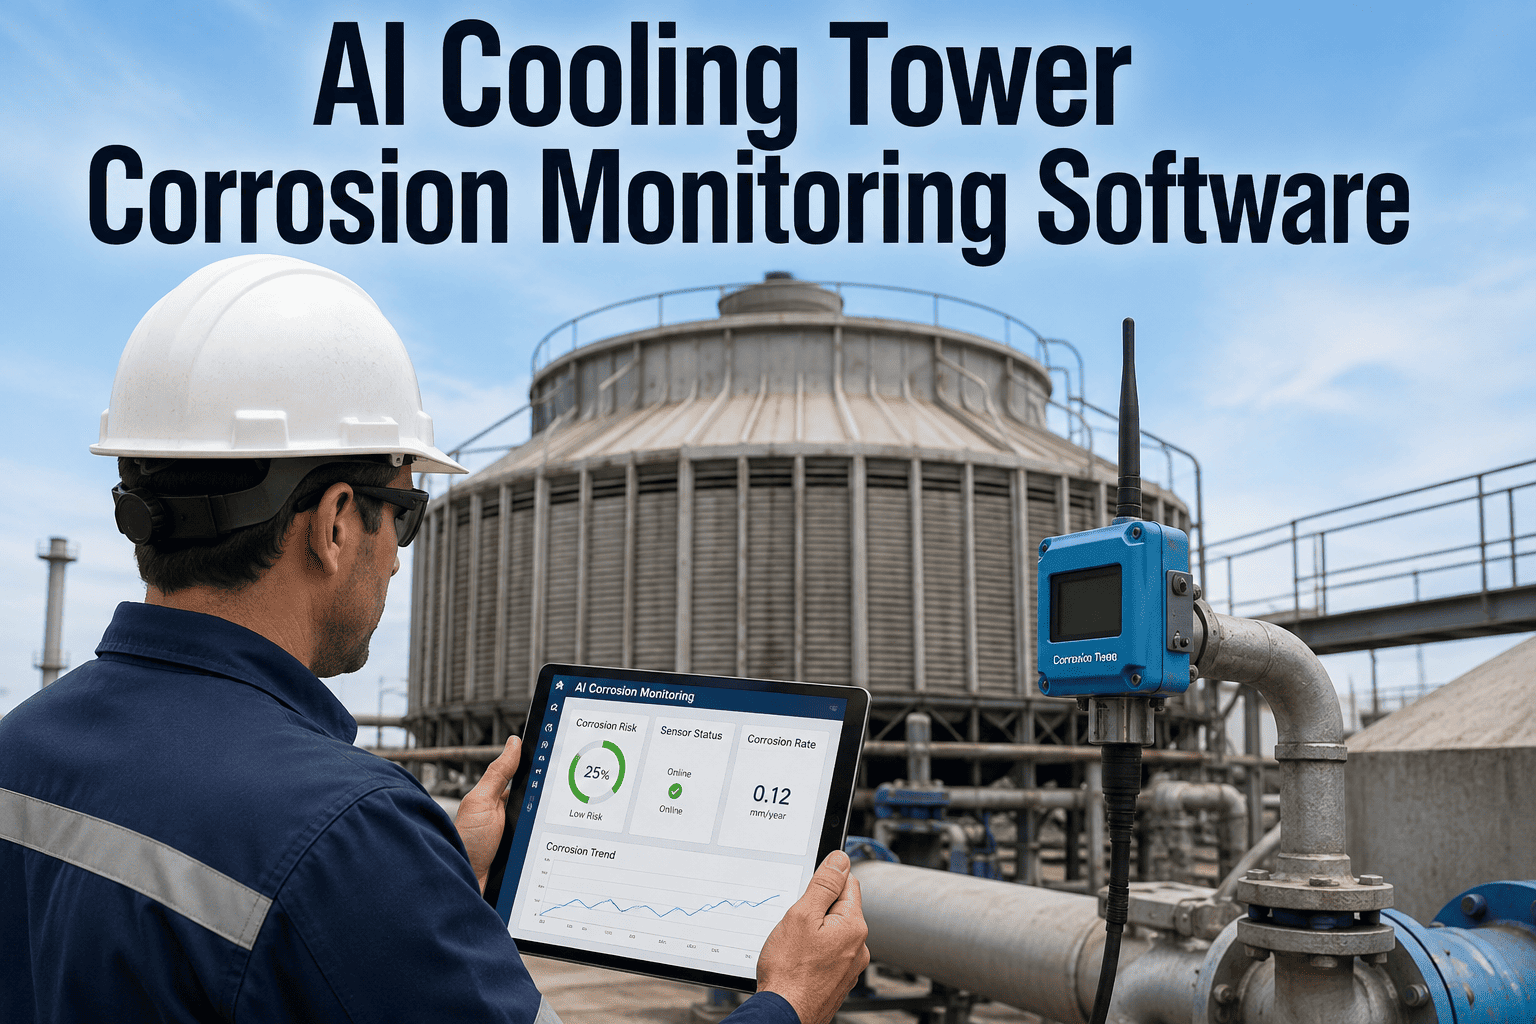
AI Cooling Tower Corrosion Monitoring Software
Stop waiting on quarterly lab coupons to find out your heat exchangers are already pitted. Oxmaint reads live water chemistry, correlates it against corrosion rate benchmarks, and alerts your team before metal loss becomes a leak.
60 mpy
metal loss rate in an untreated cooling tower system with no corrosion inhibitor
< 1.0 mpy
rate considered excellent protection for mild steel in a properly treated system
7.0–8.5
target pH operating band before corrosion or scale risk increases sharply
Why Cooling Tower Corrosion Is So Expensive to Ignore
Corrosion damage compounds quietly. By the time a technician spots rust-colored water or a pressure drop, the metal loss has usually been building for months — and pitting corrosion can cause a sudden failure even while average readings still look acceptable.
Untreated Systems Lose Metal Fast
A system running without corrosion inhibitors or monitoring can lose metal at roughly 0.060 inches per year. That thickness disappears from tube walls and headers long before any visible leak appears.
Pitting Outpaces General Corrosion
Localized pitting is typically three to five times faster than the general corrosion rate. Average readings can look fine on paper while a single pit quietly perforates a tube wall.
Lab Coupon Results Arrive Too Late
Standard corrosion coupons sit in the system for 60 to 90 days before a lab reports the result. Whatever damage happened during that window is only discovered after the fact.
pH Swings Trigger Rapid Metal Loss
Water below the 7.0–8.5 target band becomes significantly more aggressive toward mild steel. Short excursions between lab visits often go completely undocumented.
Corrosion Rate Benchmarks Your CMMS Should Be Watching
Not all metal loss is equal, and the acceptable rate depends on the metallurgy in your system. These are the industry benchmark ranges water treatment professionals use to grade a corrosion coupon report.
Mild Steel Corrosion Scale (mils per year)
Excellent
Acceptable
Fair
Unacceptable
0
1.0
3.0
5.0
10+
How AI-Powered Corrosion Monitoring Works
Oxmaint layers continuous sensor data on top of your lab coupon program so nothing falls into a 90-day blind spot. Here is the path a single reading takes from sensor to resolved work order.
1
Continuous Water Chemistry Capture
pH, conductivity, ORP, and temperature readings feed into the CMMS every few minutes from inline sensors and coupon rack data.
2
Corrosion Rate Correlation
Live chemistry is compared against coupon history and metallurgy-specific thresholds for mild steel, copper, and brass components.
3
Early Deviation Alerting
A pH excursion or inhibitor dropout triggers a mobile alert to the responsible technician before the mils-per-year rate climbs.
4
Auto-Generated Work Order
A breach of your facility threshold creates a work order with asset history, dosing logs, and a recommended correction attached.
5
Trend Logging & Audit Report
Corrected readings, coupon lab results, and technician actions are logged automatically for compliance and quarterly trend review.
Catch Corrosion Before It Becomes a Leak
Oxmaint pairs your coupon program with continuous chemistry tracking, automatic threshold alerts, and audit-ready reporting on every cooling tower you manage.
Corrosion Monitoring KPIs That Matter
These are the numbers reliability teams track to know whether their water treatment program is actually protecting the system, not just running on schedule.
Under 1.0 mpy
Mild Steel Target Rate
Facilities running continuous monitoring alongside inhibitor dosing keep mild steel loss under one mil per year.
7.0 – 8.5
pH Operating Band
Readings drifting outside this range trigger an alert long before the mils-per-year rate climbs on the next coupon.
60 – 90 Days
Coupon Verification Cycle
Lab coupons remain the ground truth for calibrating live sensor trends and validating inhibitor effectiveness.
24 / 7
Continuous Trend Coverage
Sensor and AI monitoring close the gap between quarterly lab reports so nothing drifts unnoticed for months.
Expert Review
CT
Cooling Systems Reliability Desk
Water Treatment & Corrosion Analysis
Corrosion coupons remain the most trusted way to confirm what is actually happening to metal inside a cooling tower, but their 60 to 90 day exposure window means a facility only learns about a problem well after it started. Pitting corrosion is the bigger concern for most teams, since it can run three to five times faster than the general corrosion rate and cause a tube failure while the average reading still looks acceptable. Pairing coupon data with continuous pH, conductivity, and ORP monitoring gives reliability teams a live view between lab cycles, so an inhibitor dropout or pH excursion gets caught and corrected in hours rather than discovered on the next quarterly report. Facilities that combine both methods consistently hold mild steel loss under the one mil per year mark considered excellent for a properly treated system.
Frequently Asked Questions
What is a normal corrosion rate for a cooling tower system?
A properly treated system typically holds mild steel loss under 1.0 mil per year and copper under 0.2 mils per year. Anything above 5.0 mpy for steel is considered unacceptable.
Book a demo to see your own thresholds mapped out.
How is cooling tower corrosion actually measured?
Corrosion coupons are weighed, installed for 60 to 90 days, then reweighed to calculate a mils-per-year rate. Continuous sensors track pH, conductivity, and ORP between coupon cycles.
Start free on Oxmaint to combine both data sources.
What causes cooling tower corrosion to spike suddenly?
The most common causes are a dropped corrosion inhibitor residual, a pH excursion below 7.0, or a spike in chloride or sulfate levels in the makeup water.
Book a demo to see alert configuration for each cause.
Can AI monitoring replace corrosion coupons entirely?
No. Coupons remain the verified ground-truth measurement of actual metal loss. AI monitoring fills the gap between lab cycles by tracking the chemistry that drives corrosion in real time.
Try Oxmaint free to see how the two work together.
How quickly should a facility respond to a corrosion alert?
Best practice is correcting inhibitor dosing or pH within hours of an alert, not waiting for the next scheduled water test. Faster response keeps pitting rates from compounding.
Book a demo to see response-time tracking.
Protect Every Tower Before Corrosion Gets Expensive
Oxmaint brings continuous water chemistry tracking, corrosion rate benchmarking, automatic alerting, and audit-ready reporting into one CMMS built for cooling tower reliability teams.